Microeconomics ECON 101 Assignment: Monopoly, Revenue, Discrimination

Verified

Added on  2023/06/15

|7
|756
|245
Homework Assignment
AI Summary
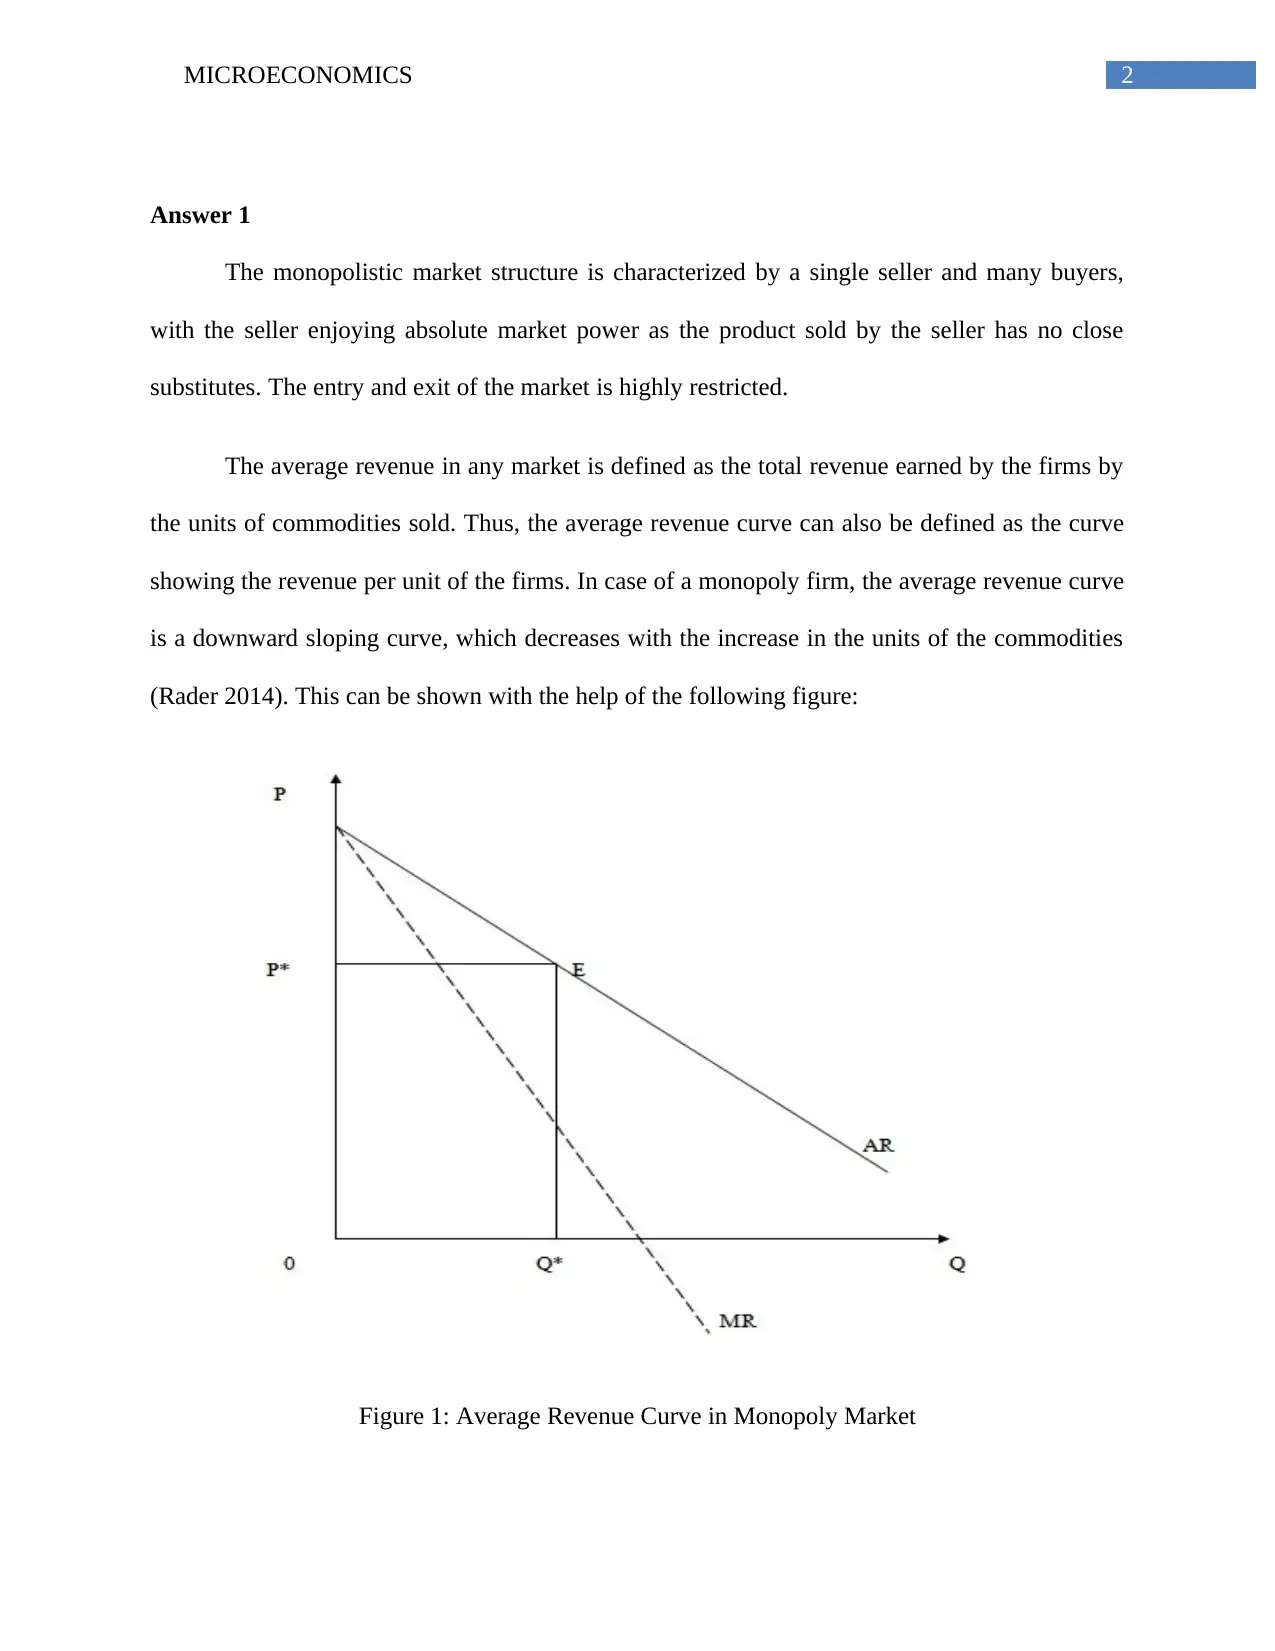
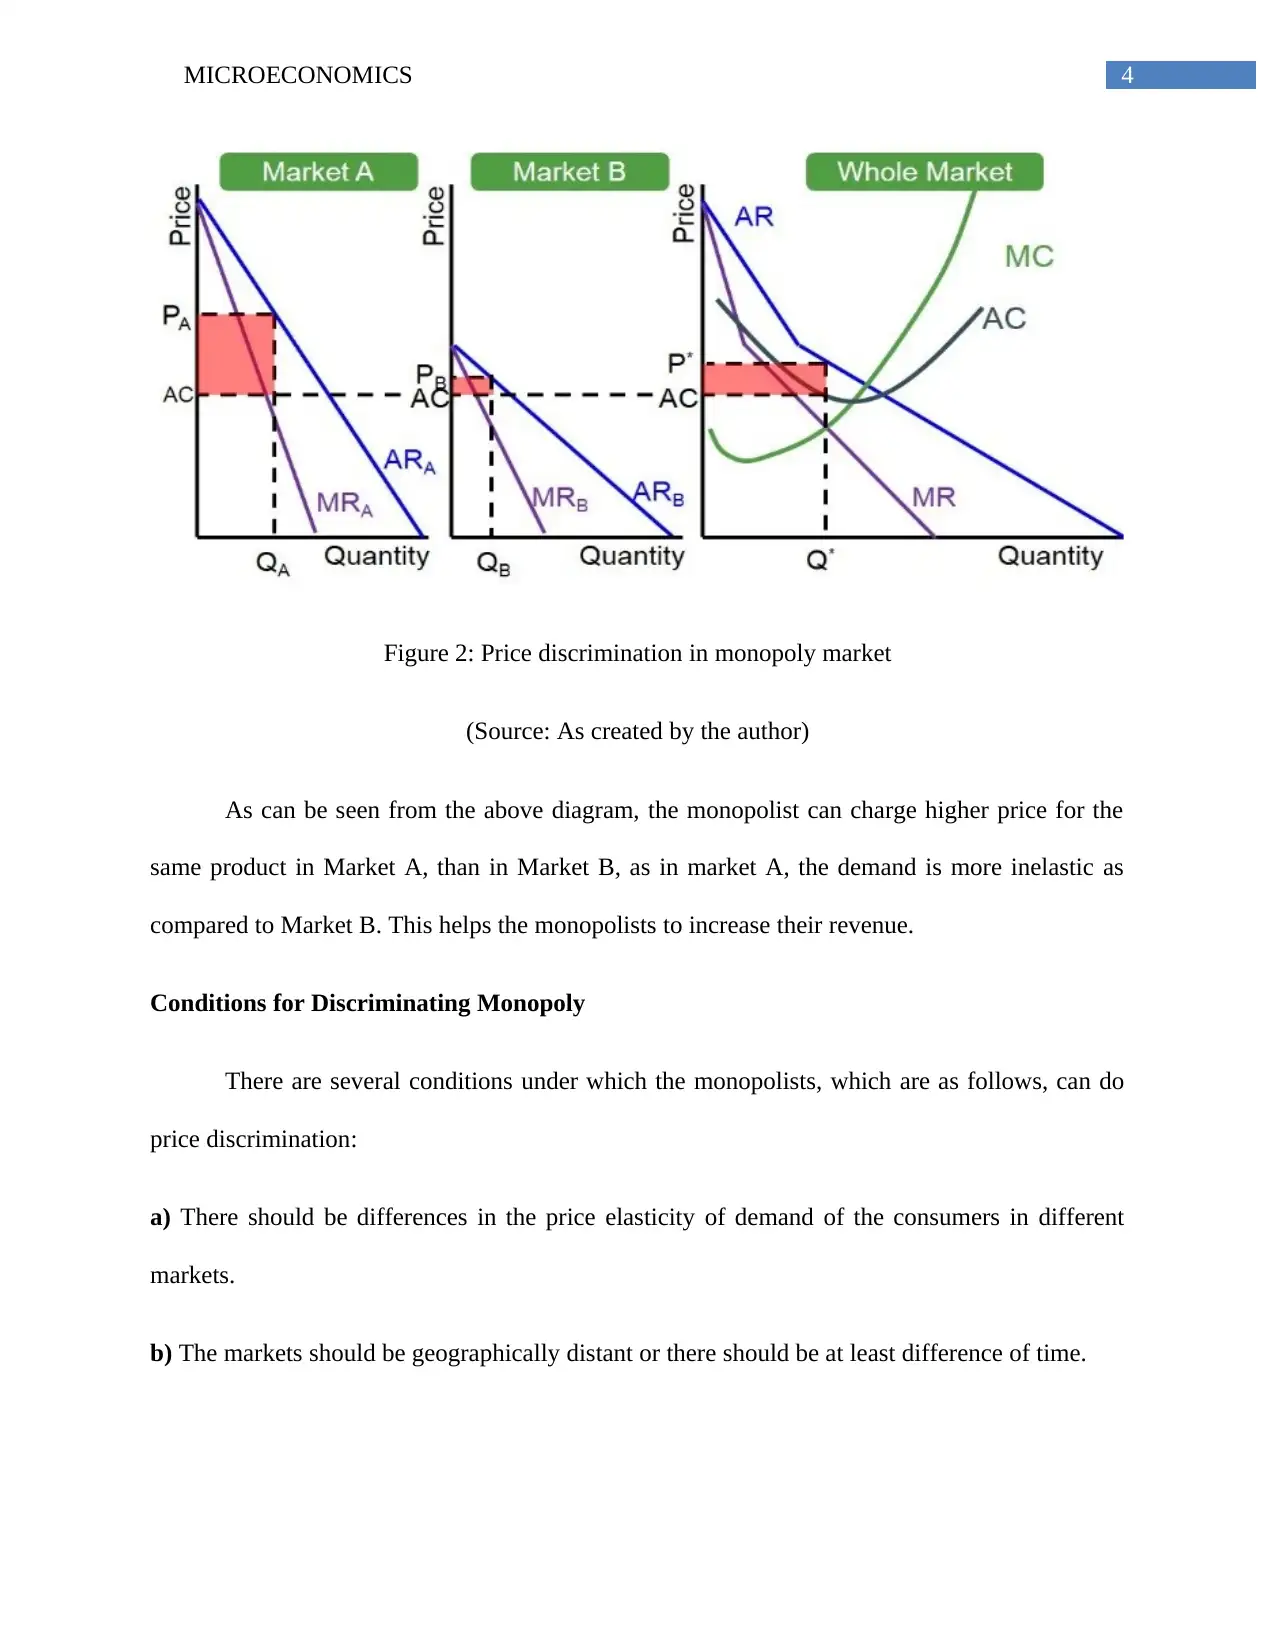
This microeconomics assignment solution defines the average revenue curve in a monopoly market, illustrating its downward-sloping nature and its relationship to the monopolist's demand curve. It further explains discriminatory monopoly, where a seller charges different prices to different consumers based on their willingness to pay, highlighting the conditions necessary for this practice, such as differences in price elasticity, geographical or temporal separation of markets, and the absence of arbitrage. The solution also includes diagrams to visually represent these concepts, offering a comprehensive understanding of monopoly behavior and pricing strategies.
tabler-icon-diamond-filled.svg

Contribute Materials

Your contribution can guide someone’s learning journey. Share your documents today.
Document Page
Running head: MICROECONOMICS
Microeconomics
Name of the Student
Name of the University
Author Note
tabler-icon-diamond-filled.svg

Secure Best Marks with AI Grader

Need help grading? Try our AI Grader for instant feedback on your assignments.
Document Page
1MICROECONOMICS
Table of Contents
Answer 1..........................................................................................................................................2
Answer 2..........................................................................................................................................3
References........................................................................................................................................7
Document Page
2MICROECONOMICS
Answer 1
The monopolistic market structure is characterized by a single seller and many buyers,
with the seller enjoying absolute market power as the product sold by the seller has no close
substitutes. The entry and exit of the market is highly restricted.
The average revenue in any market is defined as the total revenue earned by the firms by
the units of commodities sold. Thus, the average revenue curve can also be defined as the curve
showing the revenue per unit of the firms. In case of a monopoly firm, the average revenue curve
is a downward sloping curve, which decreases with the increase in the units of the commodities
(Rader 2014). This can be shown with the help of the following figure:
Figure 1: Average Revenue Curve in Monopoly Market
Document Page
3MICROECONOMICS
(Source: As created by the author)
As can be seen from the above figure, the average revenue curve, in case of a monopoly
firm, is the price charged by the monopolist per unit of the commodity or service sold by him,
which makes the AR curve similar to the demand curve for the monopolist itself. This is because
the monopolist captures the whole of the market at any given level of output. Therefore, to
increase the number of units of their goods, which they want to sell, the monopolists have to
reduce their price as to attract new customers they need to capture that clientele who have not
already bought the concerned commodity. Thus, the average revenue curve or the demand curve
in case of a monopolist is downward sloping (Ekelund Jr and Hébert 2013).
Answer 2
The monopoly market structure, consisting of one seller and many buyers, allow the
sellers to enjoy full market power and price-decisive capabilities. Often this capability leads to
an economic phenomenon, which is known as discriminating monopoly. The discriminating
behavior is the practice of usually the monopolists to charge different prices from different
consumers, depending upon their willingness to pay for the product.
In “Discriminating Monopoly”, the same producer charges higher prices from a sector of
his or her clientele and comparatively lower prices from another sector for a commodity whose
cost of production is uniform for the producer. The degrees of discrimination, however, vary
according to the discriminating power of the monopolists and the nature of demands of the
consumer (Solomon, Russell-Bennett and Previte 2012).
tabler-icon-diamond-filled.svg

Secure Best Marks with AI Grader

Need help grading? Try our AI Grader for instant feedback on your assignments.
Document Page
4MICROECONOMICS
Figure 2: Price discrimination in monopoly market
(Source: As created by the author)
As can be seen from the above diagram, the monopolist can charge higher price for the
same product in Market A, than in Market B, as in market A, the demand is more inelastic as
compared to Market B. This helps the monopolists to increase their revenue.
Conditions for Discriminating Monopoly
There are several conditions under which the monopolists, which are as follows, can do
price discrimination:
a) There should be differences in the price elasticity of demand of the consumers in different
markets.
b) The markets should be geographically distant or there should be at least difference of time.
Document Page
5MICROECONOMICS
c) The possibility of arbitrage (the tendency of a group of individuals to buy from a place of
cheaper price and to sell at a place with higher demand and higher price) should be absent
between the markets (Dixon et al. 2012).
Document Page
6MICROECONOMICS
References
Dixon, P.B., Bowles, S., Kendrick, D., Taylor, L. and Roberts, M., 2012. Notes and problems in
microeconomic theory (Vol. 15). Elsevier.
Ekelund Jr, R.B. and Hébert, R.F., 2013. A history of economic theory and method. Waveland
Press.
Rader, T., 2014. Theory of microeconomics. Academic Press.
Solomon, M., Russell-Bennett, R. and Previte, J., 2012. Consumer behaviour. Pearson Higher
Education AU.
chevron_up_icon
1 out of 7
circle_padding
hide_on_mobile
zoom_out_icon
logo.png

Your All-in-One AI-Powered Toolkit for Academic Success.

Available 24*7 on WhatsApp / Email

[object Object]