Economics Report: Monopoly Behavior, Costs, and Government Policies
VerifiedAdded on 2022/09/16
|24
|5132
|37
Report
AI Summary
This economics report analyzes the behavior and objectives of a monopoly firm, using the Indian Railways as a case study. It calculates short-run and long-run costs, revenue, and profit maximization strategies. The report examines macroeconomic policies of the Indian government, including GDP trends, business cycles, inflation, unemployment, fiscal, and monetary policies, and their impact on the industrial sector. The analysis includes tables detailing cost and revenue calculations, and discusses government intervention to correct market failures. The report concludes by highlighting the relationship between economic policies and the performance of the monopoly firm.
Running head: ECONOMICS
Economics
Name of the Student
Name of the University
Course ID
Economics
Name of the Student
Name of the University
Course ID
Paraphrase This Document
Need a fresh take? Get an instant paraphrase of this document with our AI Paraphraser
1ECONOMICS
Executive Summary
The aim of this paper is to identify the behavior and objectives of a monopoly firm. It measures
the cost functions, revenues and possible profits of the concerned organization. The goal of the
paper is to recognize the macroeconomic policies and decisions of the Indian government and
their effects on the industrial sector. This paper includes the 10-year GDP trends of Indian
economy and their relation with the different phases of business cycle. This report incorporates
the unemployment and inflation data of the Indian economy and tries to justify the relation
between the two. Lastly, it connotes the impact of fiscal and monetary policy on the different
sectors of an economy and relates with the concerned product in our study.
2ECONOMICS
Table of Contents
Introduction......................................................................................................................................3
Analyzing the profit maximizing actions of the Indian railways....................................................3
Calculating the short-run and long-run costs...............................................................................4
Revenue calculation of the monopoly firm.................................................................................5
Monopoly profit of the firm.........................................................................................................6
A monopolist's profit maximization strategy...............................................................................6
Macroeconomic concern and policies of the government...............................................................8
Business cycles and their impact on the firms...........................................................................10
Inflation and unemployment......................................................................................................11
Fiscal policy...............................................................................................................................13
Monetary policy of the country.................................................................................................15
Conclusion.....................................................................................................................................17
References......................................................................................................................................18
⊘ This is a preview!⊘
Do you want full access?
Subscribe today to unlock all pages.
Trusted by 1+ million students worldwide
3ECONOMICS
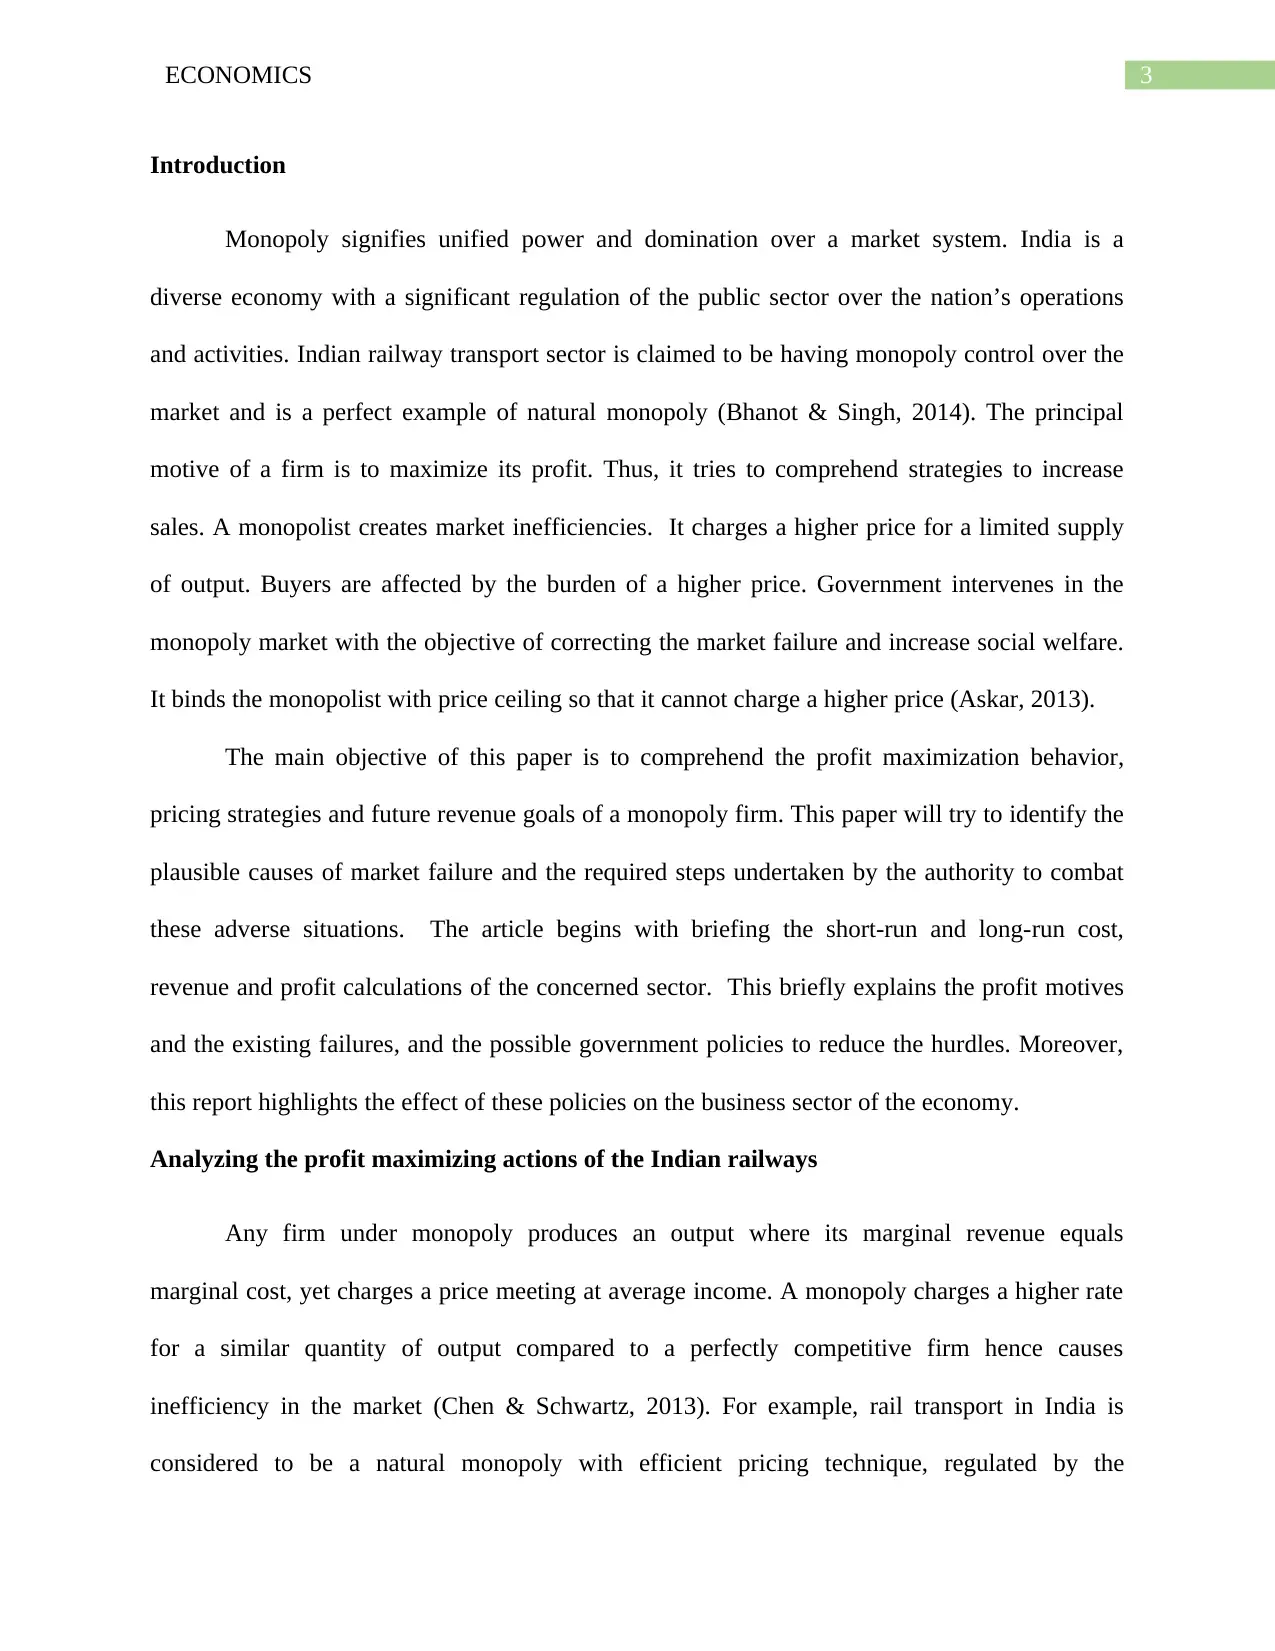
Introduction
Monopoly signifies unified power and domination over a market system. India is a
diverse economy with a significant regulation of the public sector over the nation’s operations
and activities. Indian railway transport sector is claimed to be having monopoly control over the
market and is a perfect example of natural monopoly (Bhanot & Singh, 2014). The principal
motive of a firm is to maximize its profit. Thus, it tries to comprehend strategies to increase
sales. A monopolist creates market inefficiencies. It charges a higher price for a limited supply
of output. Buyers are affected by the burden of a higher price. Government intervenes in the
monopoly market with the objective of correcting the market failure and increase social welfare.
It binds the monopolist with price ceiling so that it cannot charge a higher price (Askar, 2013).
The main objective of this paper is to comprehend the profit maximization behavior,
pricing strategies and future revenue goals of a monopoly firm. This paper will try to identify the
plausible causes of market failure and the required steps undertaken by the authority to combat
these adverse situations. The article begins with briefing the short-run and long-run cost,
revenue and profit calculations of the concerned sector. This briefly explains the profit motives
and the existing failures, and the possible government policies to reduce the hurdles. Moreover,
this report highlights the effect of these policies on the business sector of the economy.
Analyzing the profit maximizing actions of the Indian railways
Any firm under monopoly produces an output where its marginal revenue equals
marginal cost, yet charges a price meeting at average income. A monopoly charges a higher rate
for a similar quantity of output compared to a perfectly competitive firm hence causes
inefficiency in the market (Chen & Schwartz, 2013). For example, rail transport in India is
considered to be a natural monopoly with efficient pricing technique, regulated by the
Paraphrase This Document
Need a fresh take? Get an instant paraphrase of this document with our AI Paraphraser
4ECONOMICS
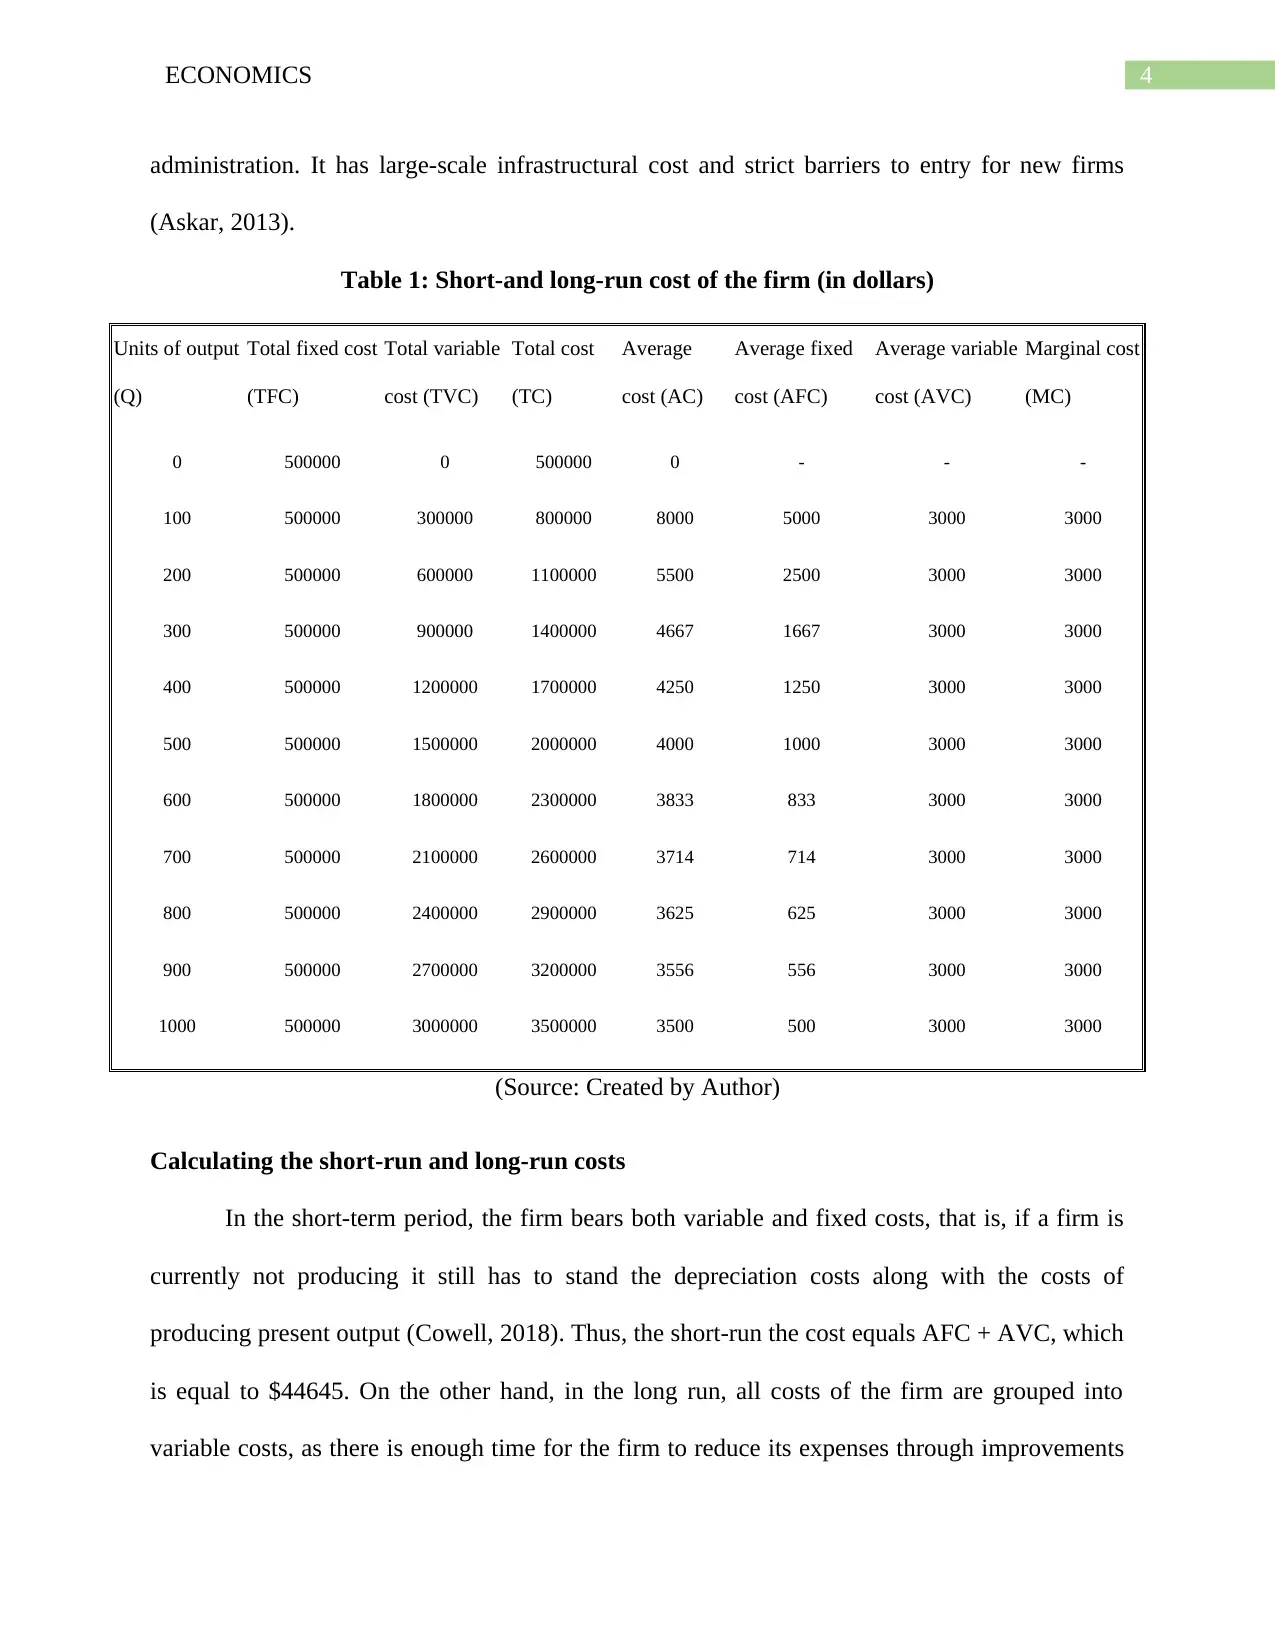
administration. It has large-scale infrastructural cost and strict barriers to entry for new firms
(Askar, 2013).
Table 1: Short-and long-run cost of the firm (in dollars)
Units of output
(Q)
Total fixed cost
(TFC)
Total variable
cost (TVC)
Total cost
(TC)
Average
cost (AC)
Average fixed
cost (AFC)
Average variable
cost (AVC)
Marginal cost
(MC)
0 500000 0 500000 0 - - -
100 500000 300000 800000 8000 5000 3000 3000
200 500000 600000 1100000 5500 2500 3000 3000
300 500000 900000 1400000 4667 1667 3000 3000
400 500000 1200000 1700000 4250 1250 3000 3000
500 500000 1500000 2000000 4000 1000 3000 3000
600 500000 1800000 2300000 3833 833 3000 3000
700 500000 2100000 2600000 3714 714 3000 3000
800 500000 2400000 2900000 3625 625 3000 3000
900 500000 2700000 3200000 3556 556 3000 3000
1000 500000 3000000 3500000 3500 500 3000 3000
(Source: Created by Author)
Calculating the short-run and long-run costs
In the short-term period, the firm bears both variable and fixed costs, that is, if a firm is
currently not producing it still has to stand the depreciation costs along with the costs of
producing present output (Cowell, 2018). Thus, the short-run the cost equals AFC + AVC, which
is equal to $44645. On the other hand, in the long run, all costs of the firm are grouped into
variable costs, as there is enough time for the firm to reduce its expenses through improvements
5ECONOMICS
in technology. Fixed costs include the salaries of employees, maintenance expenses, capital
depreciation whereas; variable costs are the introduction of new technologies, infrastructure
development to improve service quality. Thus, the long-run cost equals total cost, which is equal
to TFC + TVC and is equal to $22 million.
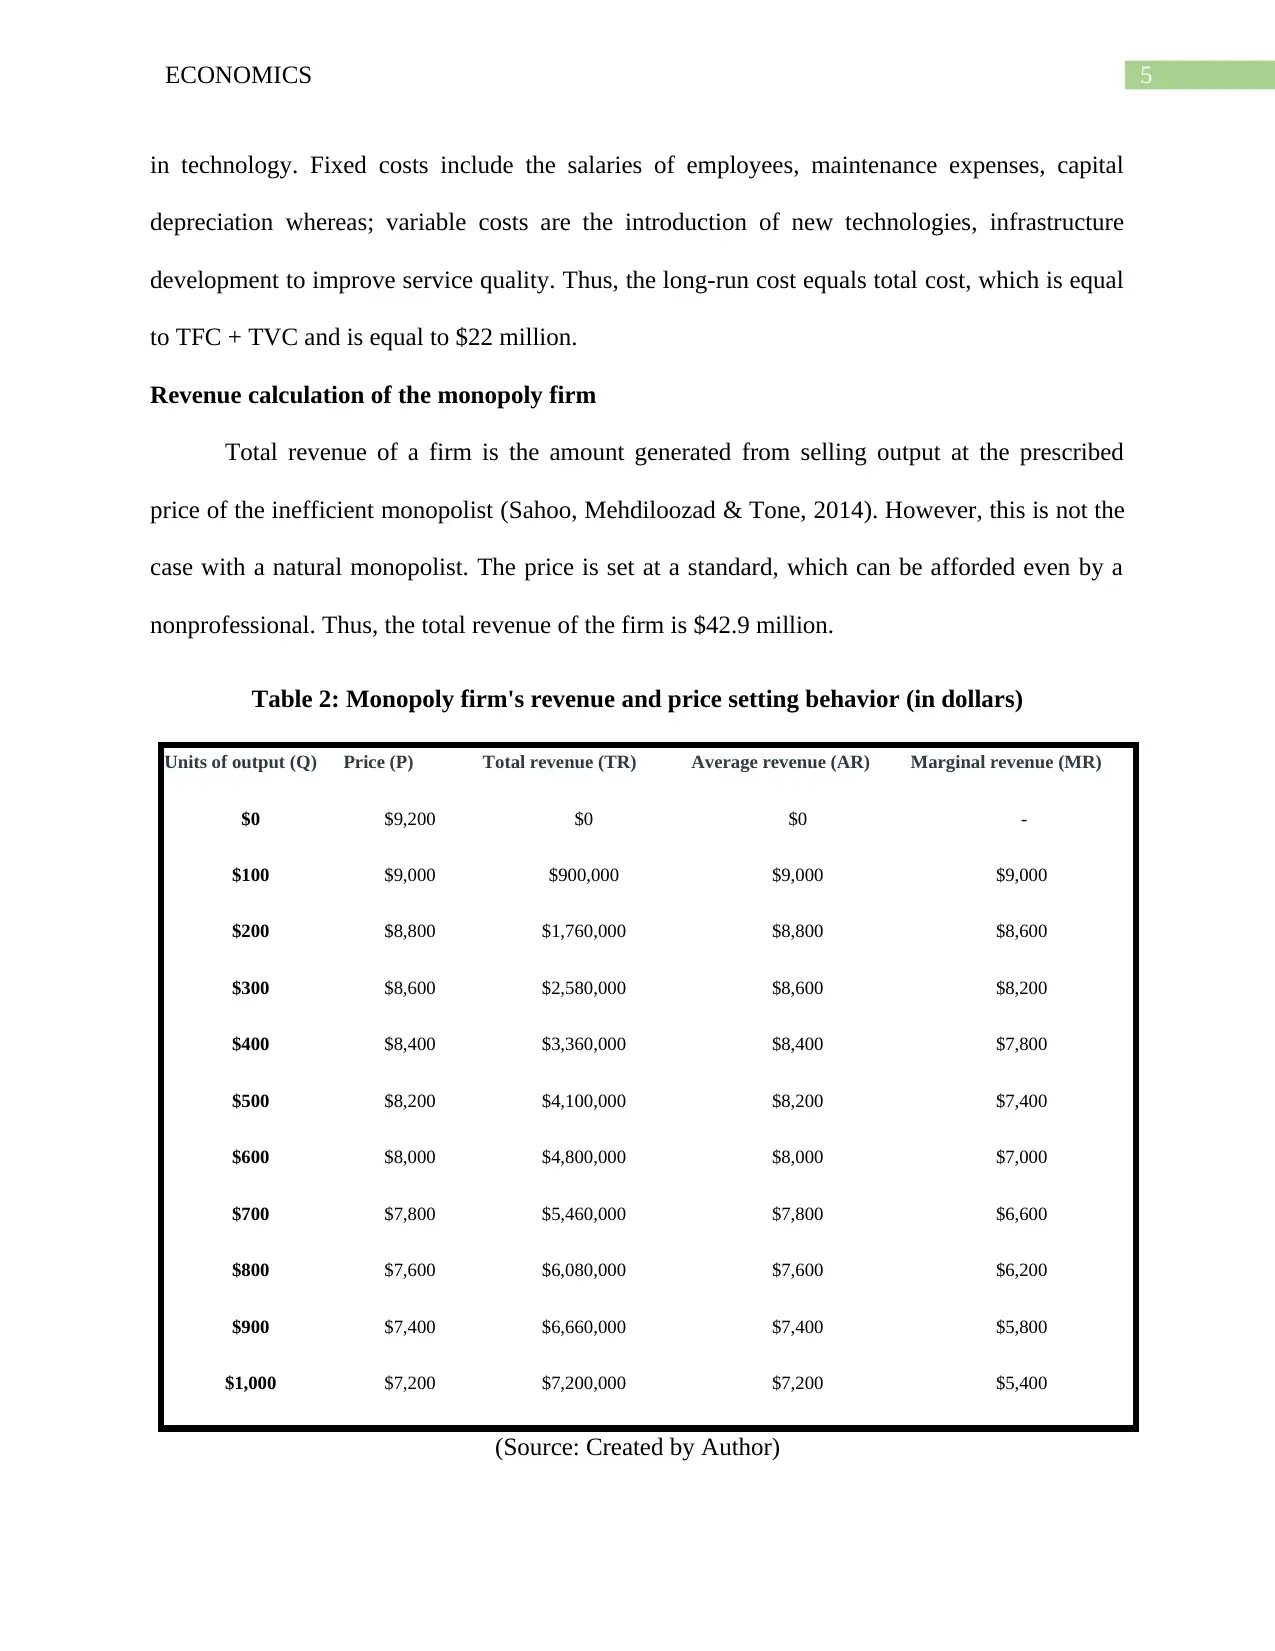
Revenue calculation of the monopoly firm
Total revenue of a firm is the amount generated from selling output at the prescribed
price of the inefficient monopolist (Sahoo, Mehdiloozad & Tone, 2014). However, this is not the
case with a natural monopolist. The price is set at a standard, which can be afforded even by a
nonprofessional. Thus, the total revenue of the firm is $42.9 million.
Table 2: Monopoly firm's revenue and price setting behavior (in dollars)
Units of output (Q) Price (P) Total revenue (TR) Average revenue (AR) Marginal revenue (MR)
$0 $9,200 $0 $0 -
$100 $9,000 $900,000 $9,000 $9,000
$200 $8,800 $1,760,000 $8,800 $8,600
$300 $8,600 $2,580,000 $8,600 $8,200
$400 $8,400 $3,360,000 $8,400 $7,800
$500 $8,200 $4,100,000 $8,200 $7,400
$600 $8,000 $4,800,000 $8,000 $7,000
$700 $7,800 $5,460,000 $7,800 $6,600
$800 $7,600 $6,080,000 $7,600 $6,200
$900 $7,400 $6,660,000 $7,400 $5,800
$1,000 $7,200 $7,200,000 $7,200 $5,400
(Source: Created by Author)
in technology. Fixed costs include the salaries of employees, maintenance expenses, capital
depreciation whereas; variable costs are the introduction of new technologies, infrastructure
development to improve service quality. Thus, the long-run cost equals total cost, which is equal
to TFC + TVC and is equal to $22 million.
Revenue calculation of the monopoly firm
Total revenue of a firm is the amount generated from selling output at the prescribed
price of the inefficient monopolist (Sahoo, Mehdiloozad & Tone, 2014). However, this is not the
case with a natural monopolist. The price is set at a standard, which can be afforded even by a
nonprofessional. Thus, the total revenue of the firm is $42.9 million.
Table 2: Monopoly firm's revenue and price setting behavior (in dollars)
Units of output (Q) Price (P) Total revenue (TR) Average revenue (AR) Marginal revenue (MR)
$0 $9,200 $0 $0 -
$100 $9,000 $900,000 $9,000 $9,000
$200 $8,800 $1,760,000 $8,800 $8,600
$300 $8,600 $2,580,000 $8,600 $8,200
$400 $8,400 $3,360,000 $8,400 $7,800
$500 $8,200 $4,100,000 $8,200 $7,400
$600 $8,000 $4,800,000 $8,000 $7,000
$700 $7,800 $5,460,000 $7,800 $6,600
$800 $7,600 $6,080,000 $7,600 $6,200
$900 $7,400 $6,660,000 $7,400 $5,800
$1,000 $7,200 $7,200,000 $7,200 $5,400
(Source: Created by Author)
⊘ This is a preview!⊘
Do you want full access?
Subscribe today to unlock all pages.
Trusted by 1+ million students worldwide
6ECONOMICS
Paraphrase This Document
Need a fresh take? Get an instant paraphrase of this document with our AI Paraphraser
7ECONOMICS
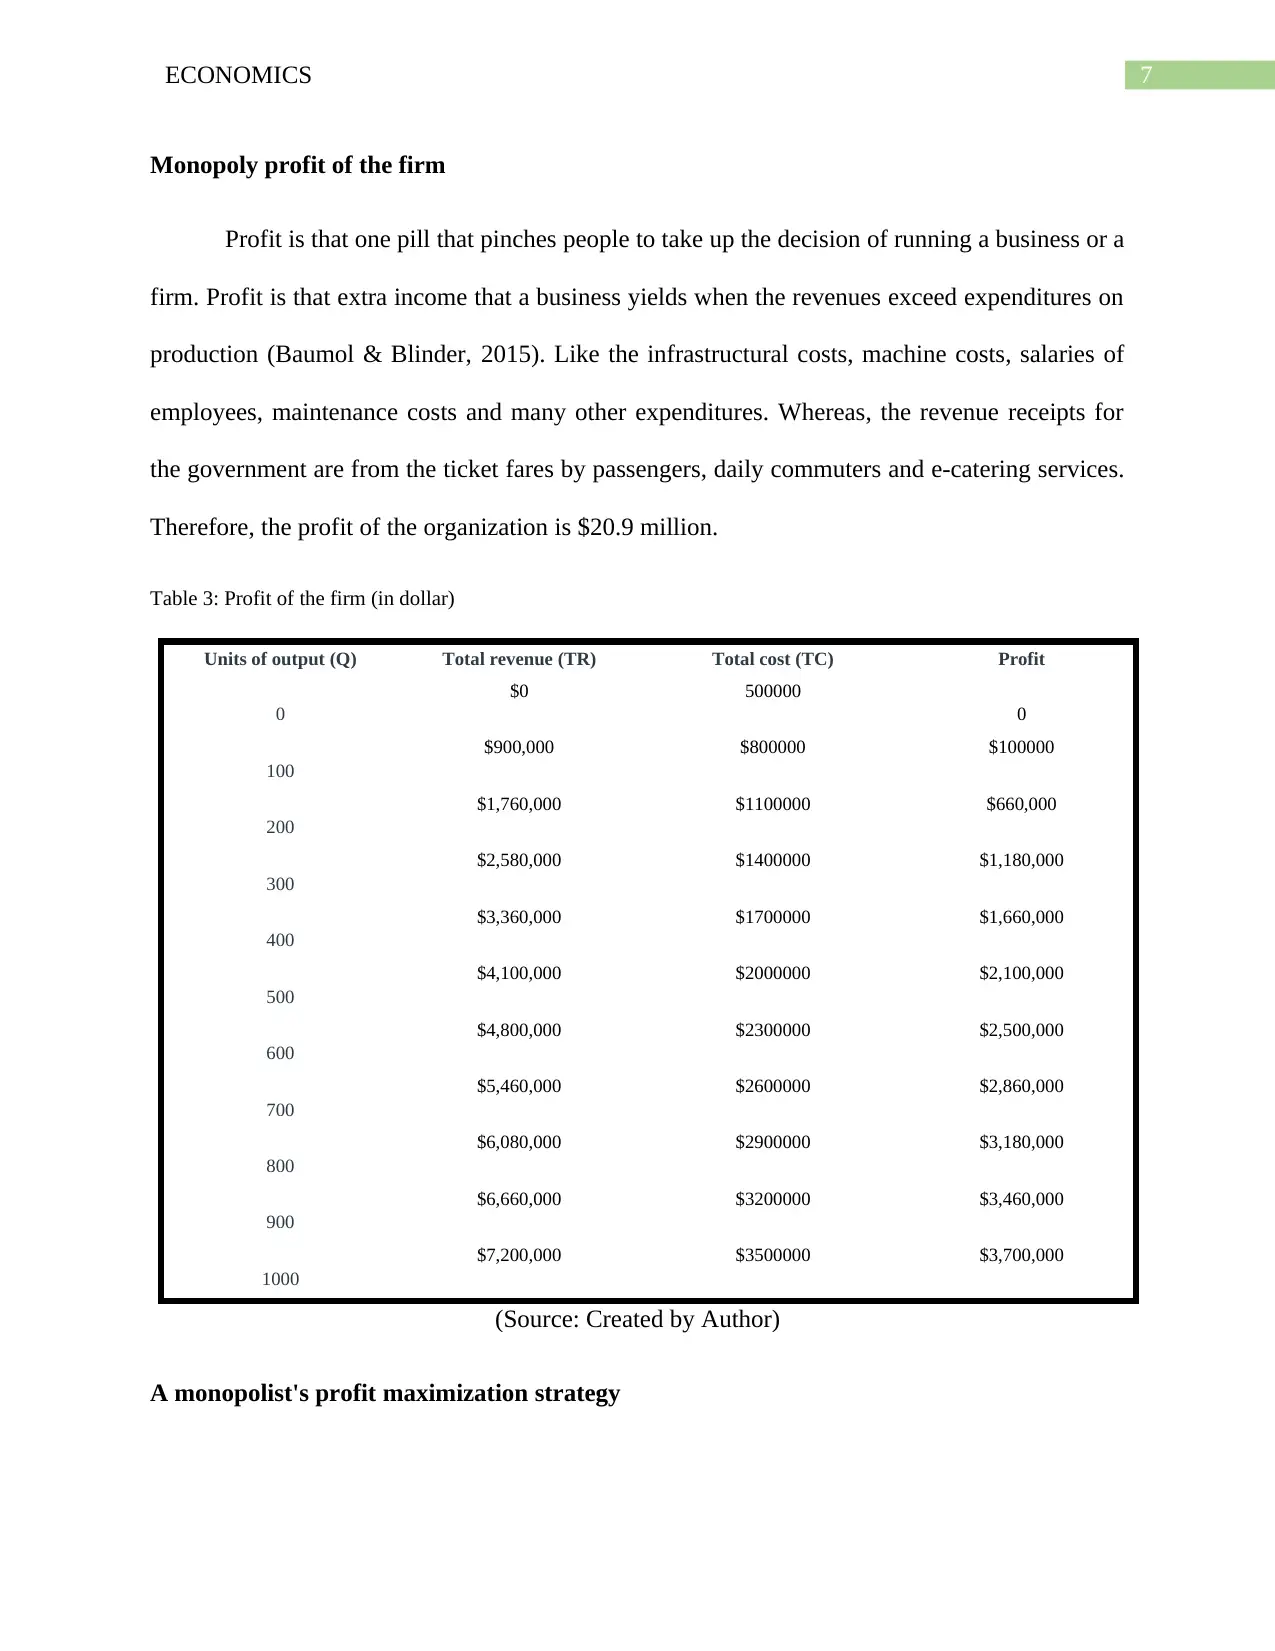
Monopoly profit of the firm
Profit is that one pill that pinches people to take up the decision of running a business or a
firm. Profit is that extra income that a business yields when the revenues exceed expenditures on
production (Baumol & Blinder, 2015). Like the infrastructural costs, machine costs, salaries of
employees, maintenance costs and many other expenditures. Whereas, the revenue receipts for
the government are from the ticket fares by passengers, daily commuters and e-catering services.
Therefore, the profit of the organization is $20.9 million.
Table 3: Profit of the firm (in dollar)
Units of output (Q) Total revenue (TR) Total cost (TC) Profit
0
$0 500000
0
100
$900,000 $800000 $100000
200
$1,760,000 $1100000 $660,000
300
$2,580,000 $1400000 $1,180,000
400
$3,360,000 $1700000 $1,660,000
500
$4,100,000 $2000000 $2,100,000
600
$4,800,000 $2300000 $2,500,000
700
$5,460,000 $2600000 $2,860,000
800
$6,080,000 $2900000 $3,180,000
900
$6,660,000 $3200000 $3,460,000
1000
$7,200,000 $3500000 $3,700,000
(Source: Created by Author)
A monopolist's profit maximization strategy
8ECONOMICS
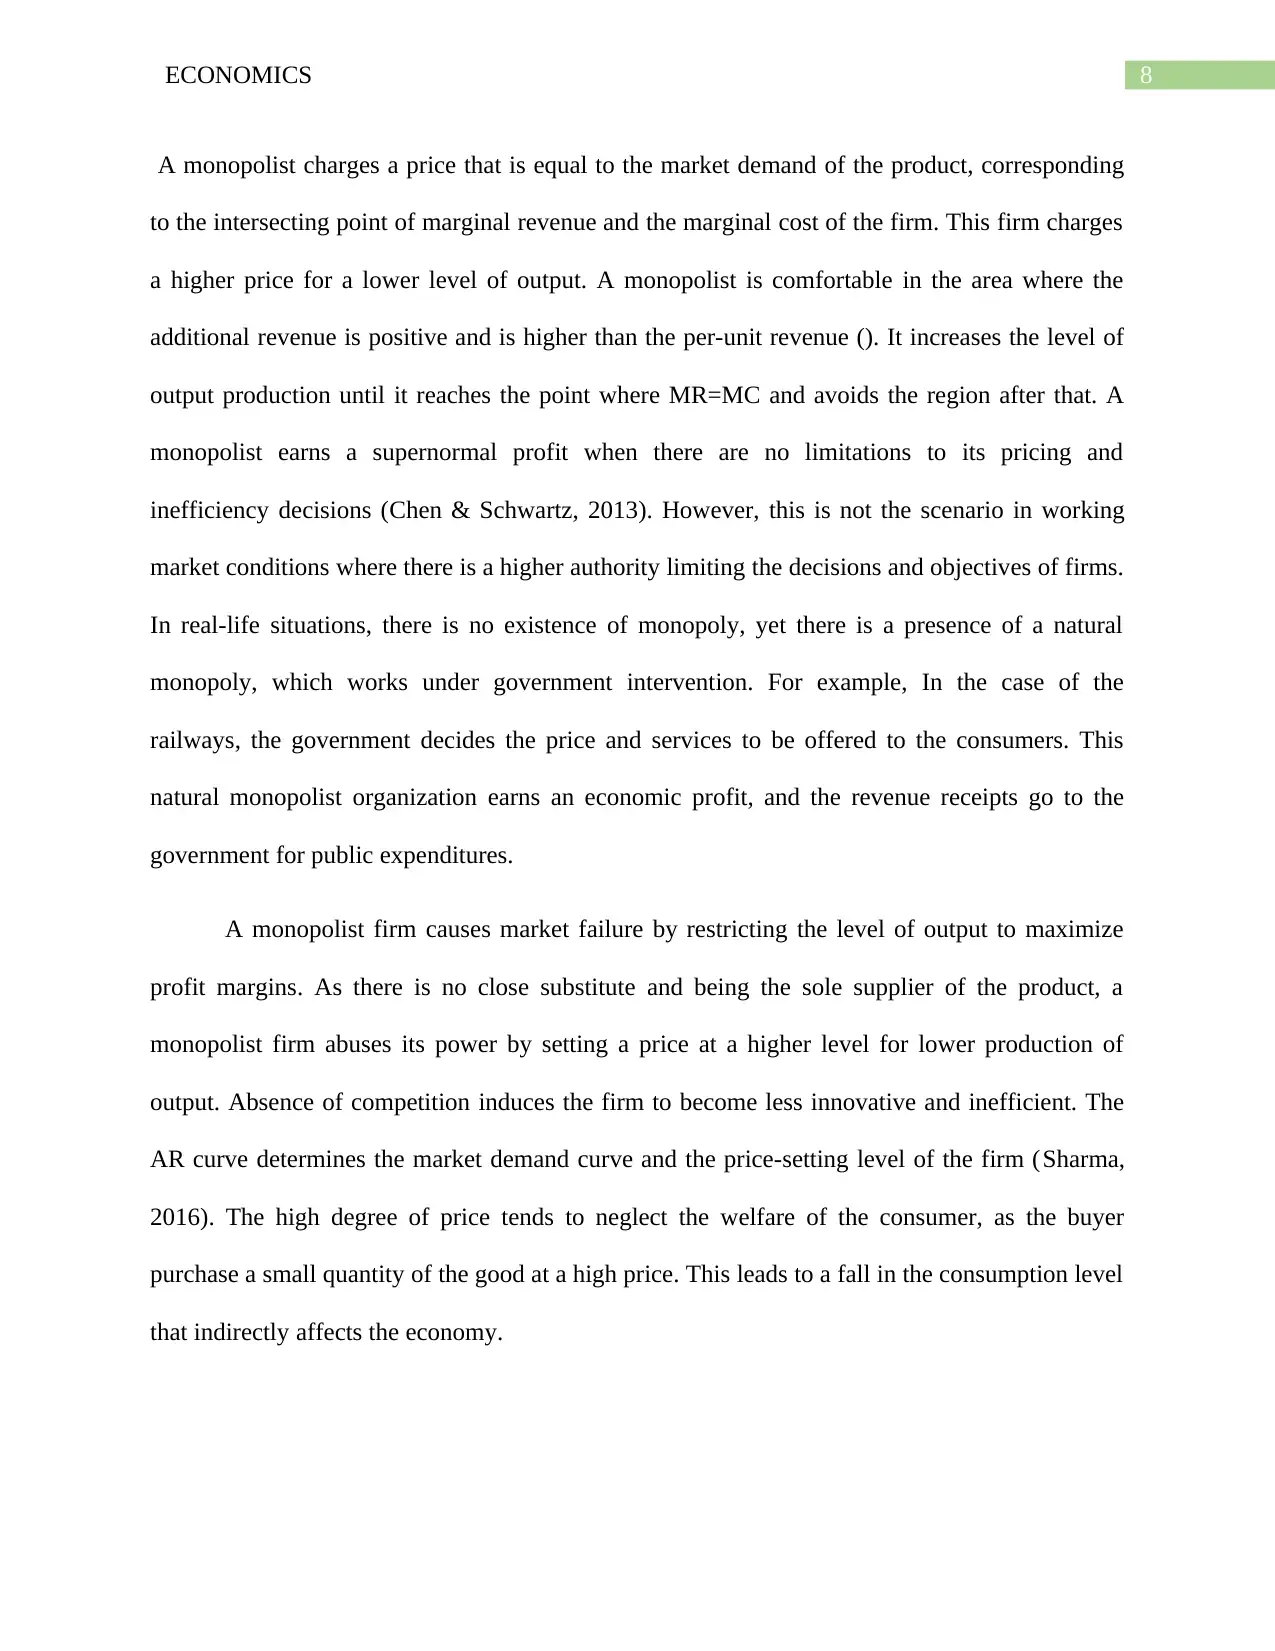
A monopolist charges a price that is equal to the market demand of the product, corresponding
to the intersecting point of marginal revenue and the marginal cost of the firm. This firm charges
a higher price for a lower level of output. A monopolist is comfortable in the area where the
additional revenue is positive and is higher than the per-unit revenue (). It increases the level of
output production until it reaches the point where MR=MC and avoids the region after that. A
monopolist earns a supernormal profit when there are no limitations to its pricing and
inefficiency decisions (Chen & Schwartz, 2013). However, this is not the scenario in working
market conditions where there is a higher authority limiting the decisions and objectives of firms.
In real-life situations, there is no existence of monopoly, yet there is a presence of a natural
monopoly, which works under government intervention. For example, In the case of the
railways, the government decides the price and services to be offered to the consumers. This
natural monopolist organization earns an economic profit, and the revenue receipts go to the
government for public expenditures.
A monopolist firm causes market failure by restricting the level of output to maximize
profit margins. As there is no close substitute and being the sole supplier of the product, a
monopolist firm abuses its power by setting a price at a higher level for lower production of
output. Absence of competition induces the firm to become less innovative and inefficient. The
AR curve determines the market demand curve and the price-setting level of the firm (Sharma,
2016). The high degree of price tends to neglect the welfare of the consumer, as the buyer
purchase a small quantity of the good at a high price. This leads to a fall in the consumption level
that indirectly affects the economy.
⊘ This is a preview!⊘
Do you want full access?
Subscribe today to unlock all pages.
Trusted by 1+ million students worldwide
9ECONOMICS
100 200 300 400 500 600 700 800 900 1000 1100
$1,000.00
$2,000.00
$3,000.00
$4,000.00
$5,000.00
$6,000.00
$7,000.00
$8,000.00
$9,000.00
$10,000.00
AC, MC, AR. MR
AC
MC
AR
MR
Output
Cost, Revenue
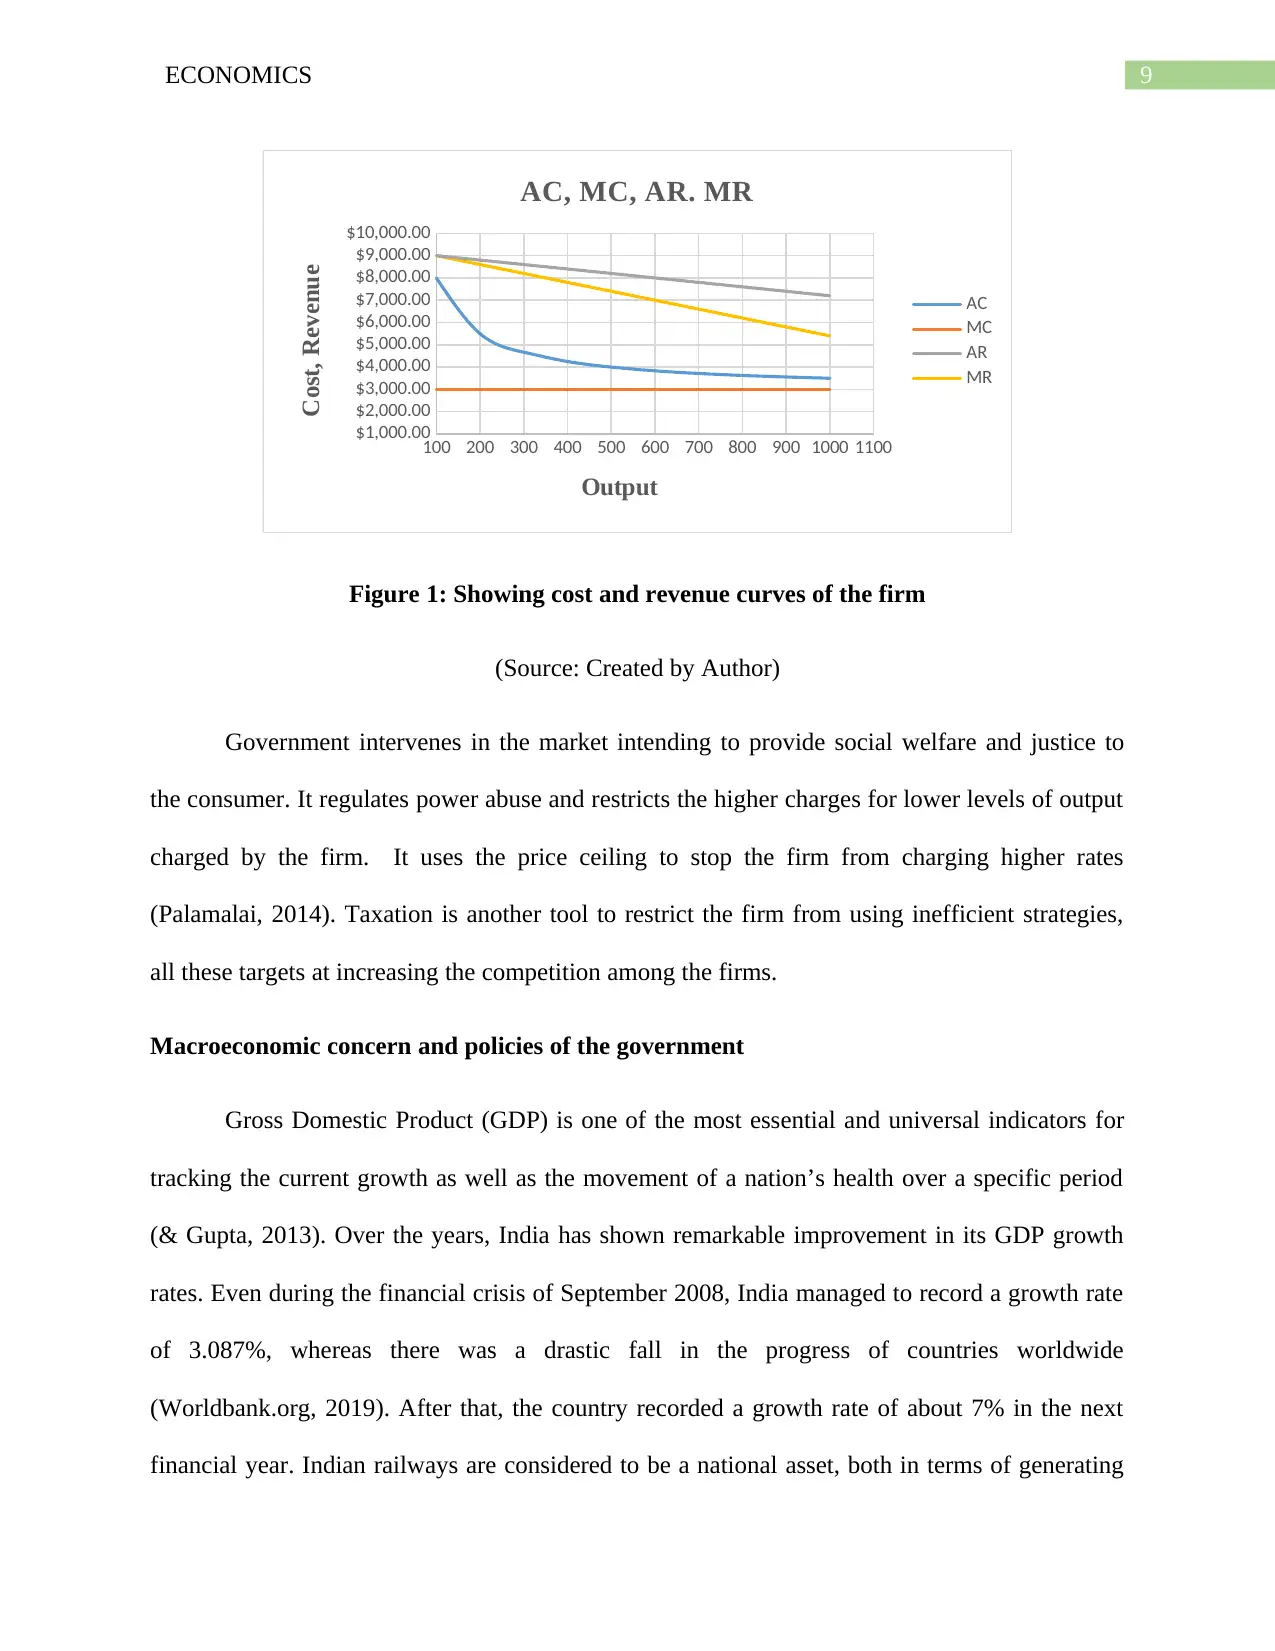
Figure 1: Showing cost and revenue curves of the firm
(Source: Created by Author)
Government intervenes in the market intending to provide social welfare and justice to
the consumer. It regulates power abuse and restricts the higher charges for lower levels of output
charged by the firm. It uses the price ceiling to stop the firm from charging higher rates
(Palamalai, 2014). Taxation is another tool to restrict the firm from using inefficient strategies,
all these targets at increasing the competition among the firms.
Macroeconomic concern and policies of the government
Gross Domestic Product (GDP) is one of the most essential and universal indicators for
tracking the current growth as well as the movement of a nation’s health over a specific period
(& Gupta, 2013). Over the years, India has shown remarkable improvement in its GDP growth
rates. Even during the financial crisis of September 2008, India managed to record a growth rate
of 3.087%, whereas there was a drastic fall in the progress of countries worldwide
(Worldbank.org, 2019). After that, the country recorded a growth rate of about 7% in the next
financial year. Indian railways are considered to be a national asset, both in terms of generating
100 200 300 400 500 600 700 800 900 1000 1100
$1,000.00
$2,000.00
$3,000.00
$4,000.00
$5,000.00
$6,000.00
$7,000.00
$8,000.00
$9,000.00
$10,000.00
AC, MC, AR. MR
AC
MC
AR
MR
Output
Cost, Revenue
Figure 1: Showing cost and revenue curves of the firm
(Source: Created by Author)
Government intervenes in the market intending to provide social welfare and justice to
the consumer. It regulates power abuse and restricts the higher charges for lower levels of output
charged by the firm. It uses the price ceiling to stop the firm from charging higher rates
(Palamalai, 2014). Taxation is another tool to restrict the firm from using inefficient strategies,
all these targets at increasing the competition among the firms.
Macroeconomic concern and policies of the government
Gross Domestic Product (GDP) is one of the most essential and universal indicators for
tracking the current growth as well as the movement of a nation’s health over a specific period
(& Gupta, 2013). Over the years, India has shown remarkable improvement in its GDP growth
rates. Even during the financial crisis of September 2008, India managed to record a growth rate
of 3.087%, whereas there was a drastic fall in the progress of countries worldwide
(Worldbank.org, 2019). After that, the country recorded a growth rate of about 7% in the next
financial year. Indian railways are considered to be a national asset, both in terms of generating
Paraphrase This Document
Need a fresh take? Get an instant paraphrase of this document with our AI Paraphraser
10ECONOMICS
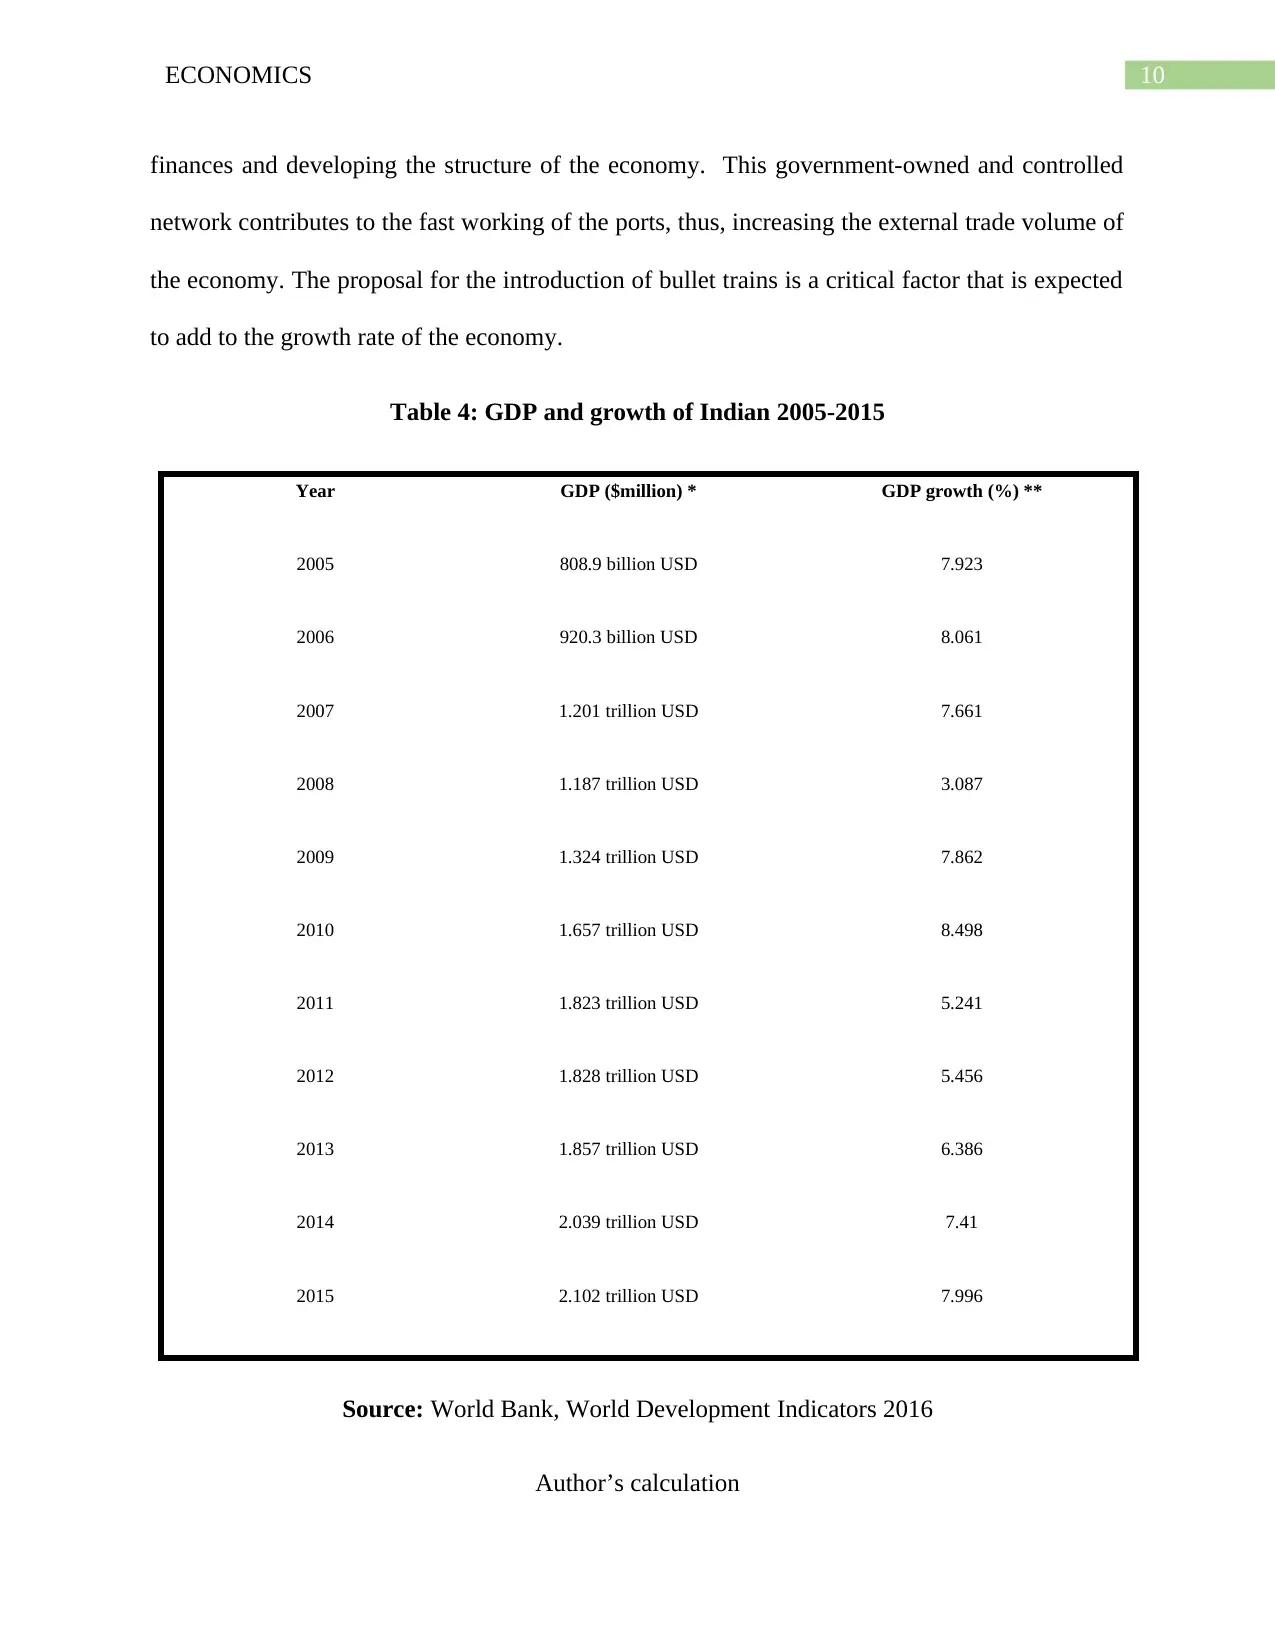
finances and developing the structure of the economy. This government-owned and controlled
network contributes to the fast working of the ports, thus, increasing the external trade volume of
the economy. The proposal for the introduction of bullet trains is a critical factor that is expected
to add to the growth rate of the economy.
Table 4: GDP and growth of Indian 2005-2015
Year GDP ($million) * GDP growth (%) **
2005 808.9 billion USD 7.923
2006 920.3 billion USD 8.061
2007 1.201 trillion USD 7.661
2008 1.187 trillion USD 3.087
2009 1.324 trillion USD 7.862
2010 1.657 trillion USD 8.498
2011 1.823 trillion USD 5.241
2012 1.828 trillion USD 5.456
2013 1.857 trillion USD 6.386
2014 2.039 trillion USD 7.41
2015 2.102 trillion USD 7.996
Source: World Bank, World Development Indicators 2016
Author’s calculation

11ECONOMICS
⊘ This is a preview!⊘
Do you want full access?
Subscribe today to unlock all pages.
Trusted by 1+ million students worldwide
1 out of 24
Related Documents


Your All-in-One AI-Powered Toolkit for Academic Success.
+13062052269
info@desklib.com
Available 24*7 on WhatsApp / Email
![[object Object]](/_next/static/media/star-bottom.7253800d.svg)
Unlock your academic potential
Copyright © 2020–2026 A2Z Services. All Rights Reserved. Developed and managed by ZUCOL.