Data Analysis and Linear Forecasting of Monthly Expenses - Assessment

Verified

Added on  2022/12/28

|12
|1362
|38
Homework Assignment
AI Summary
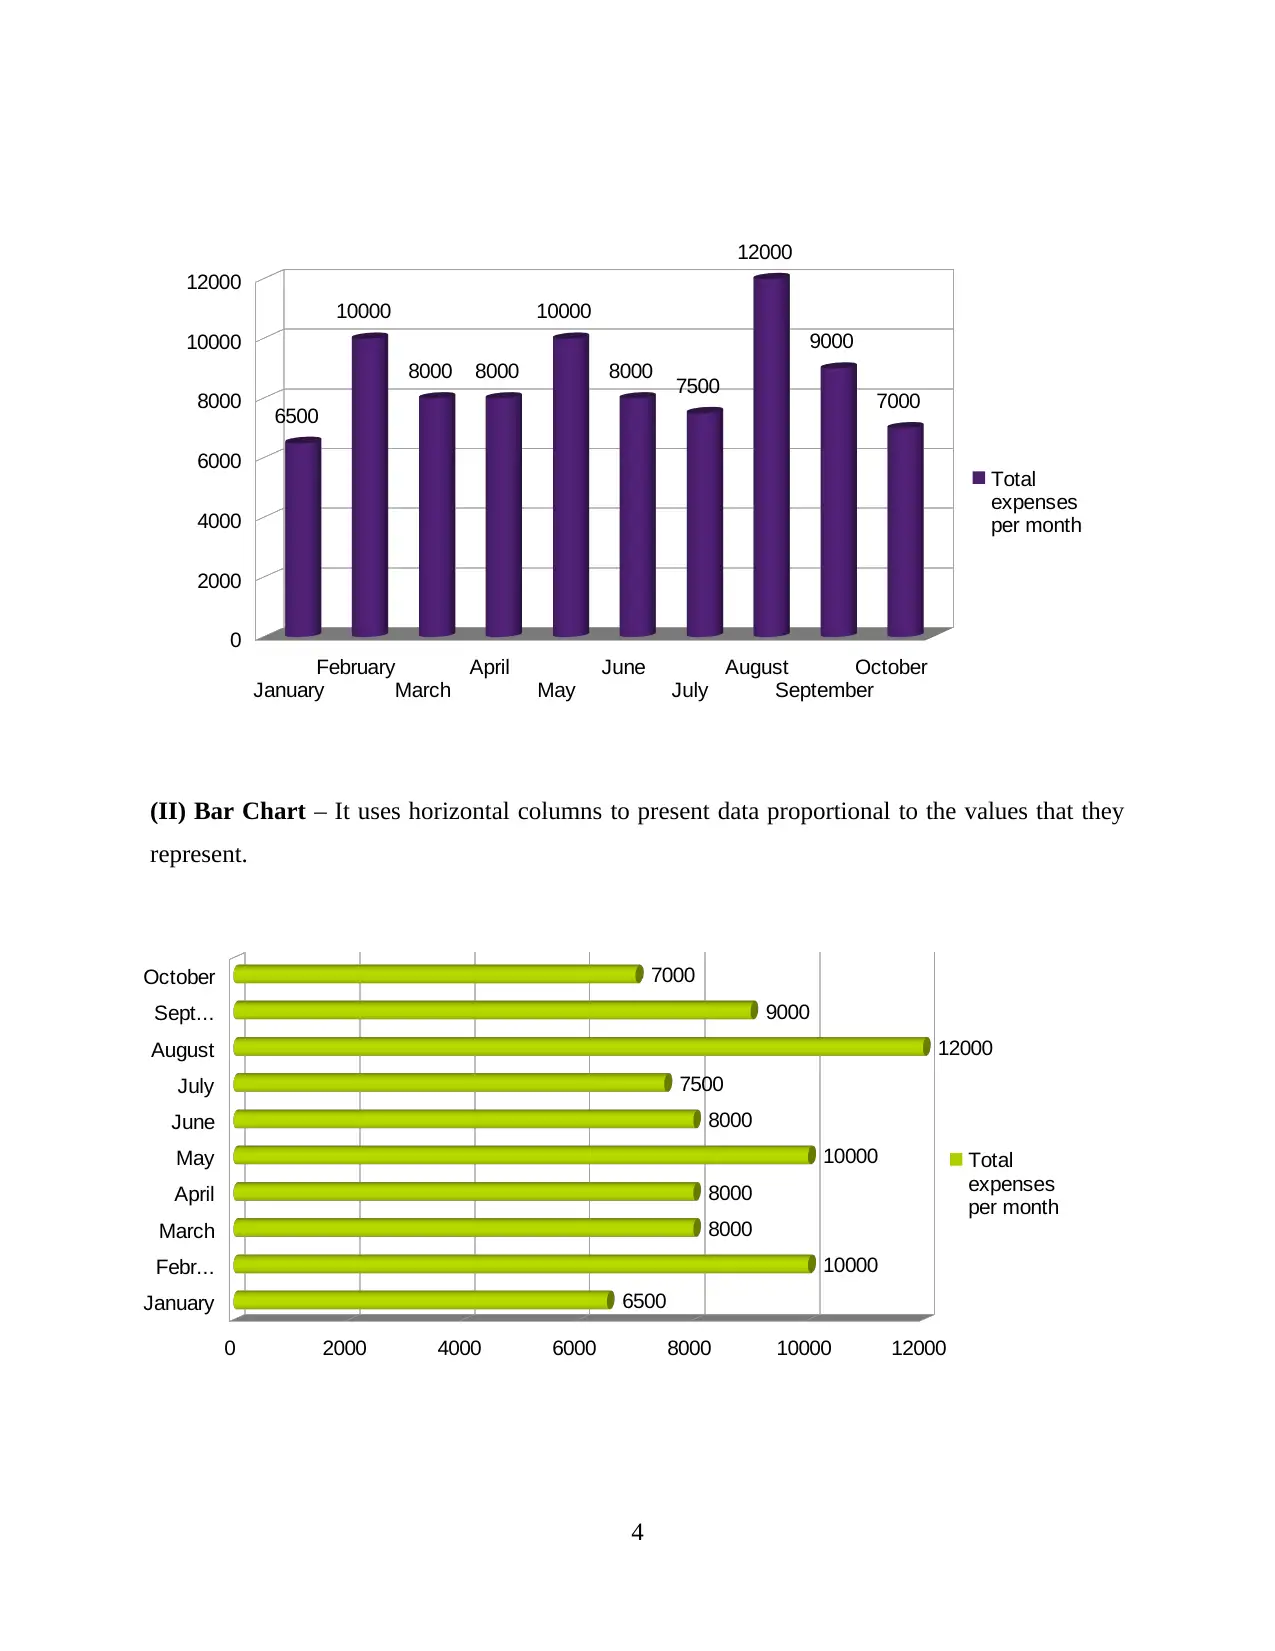
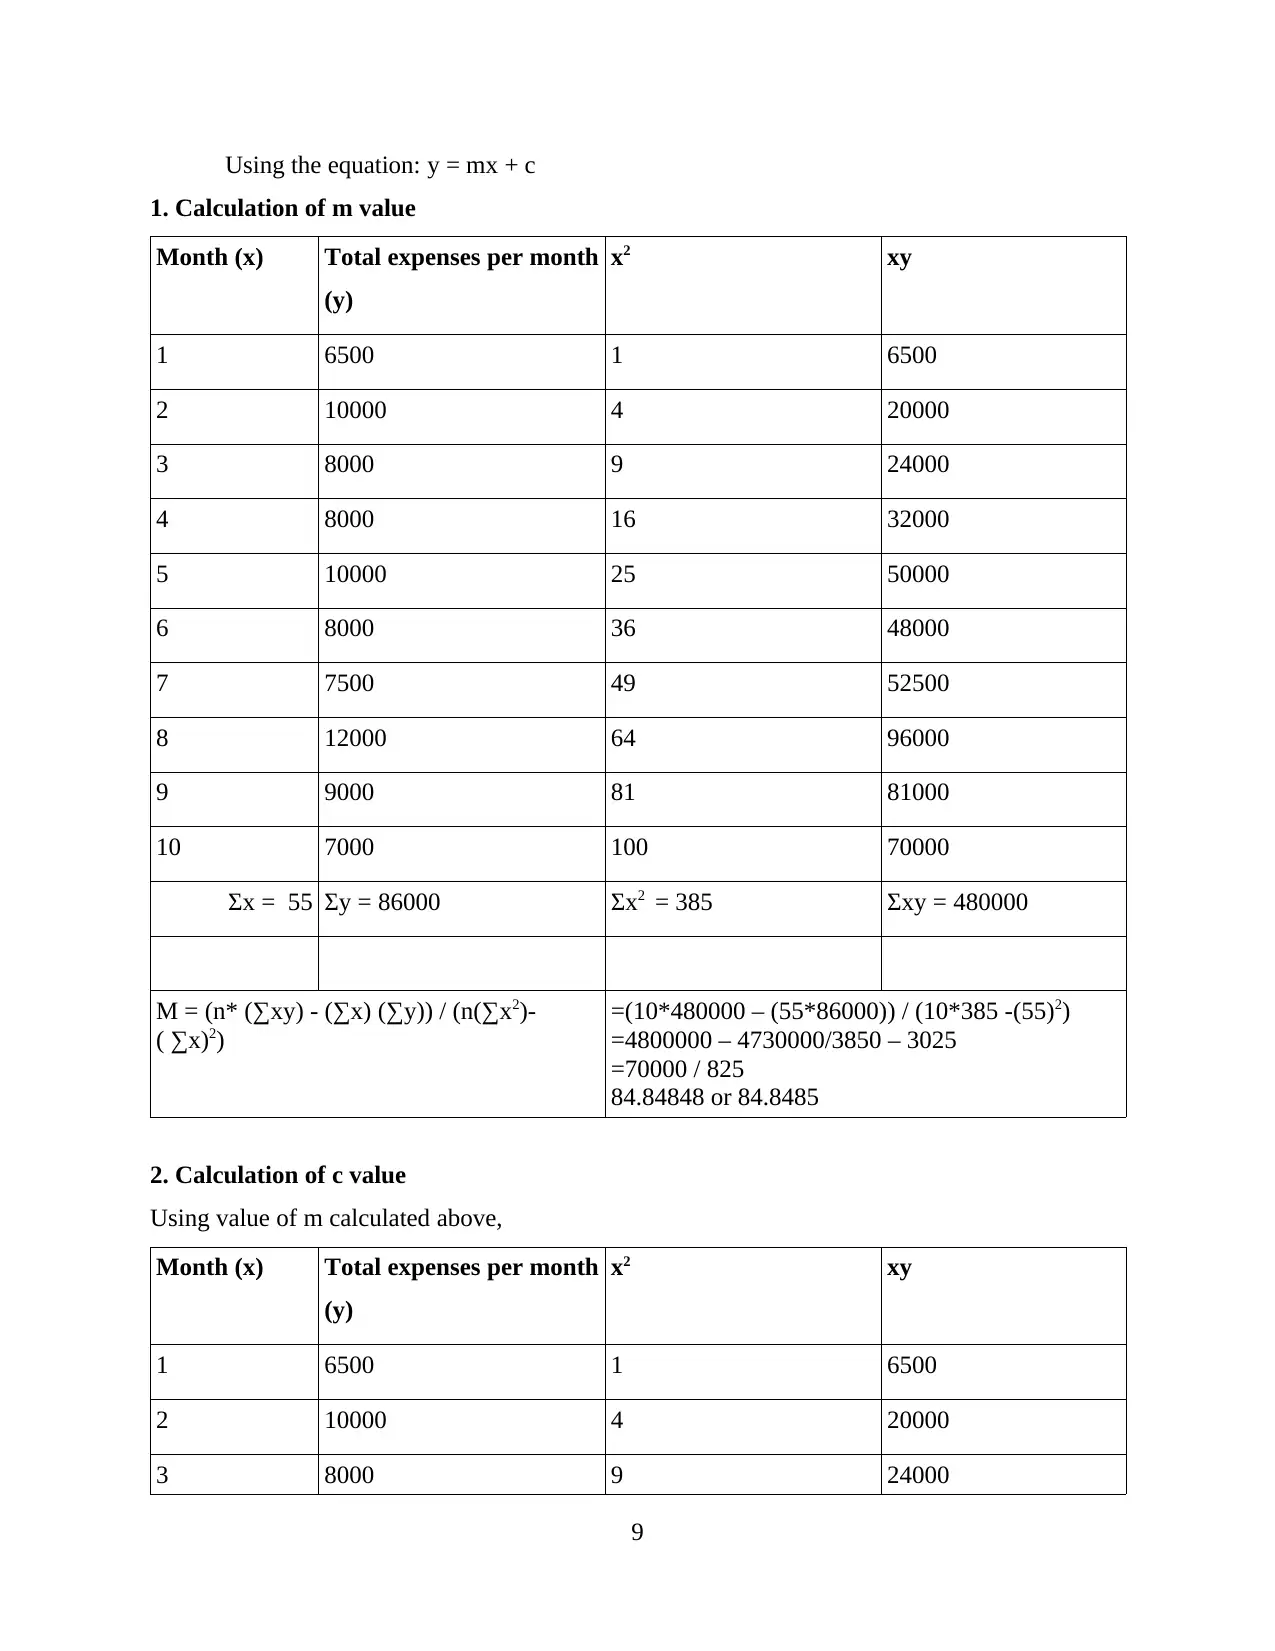
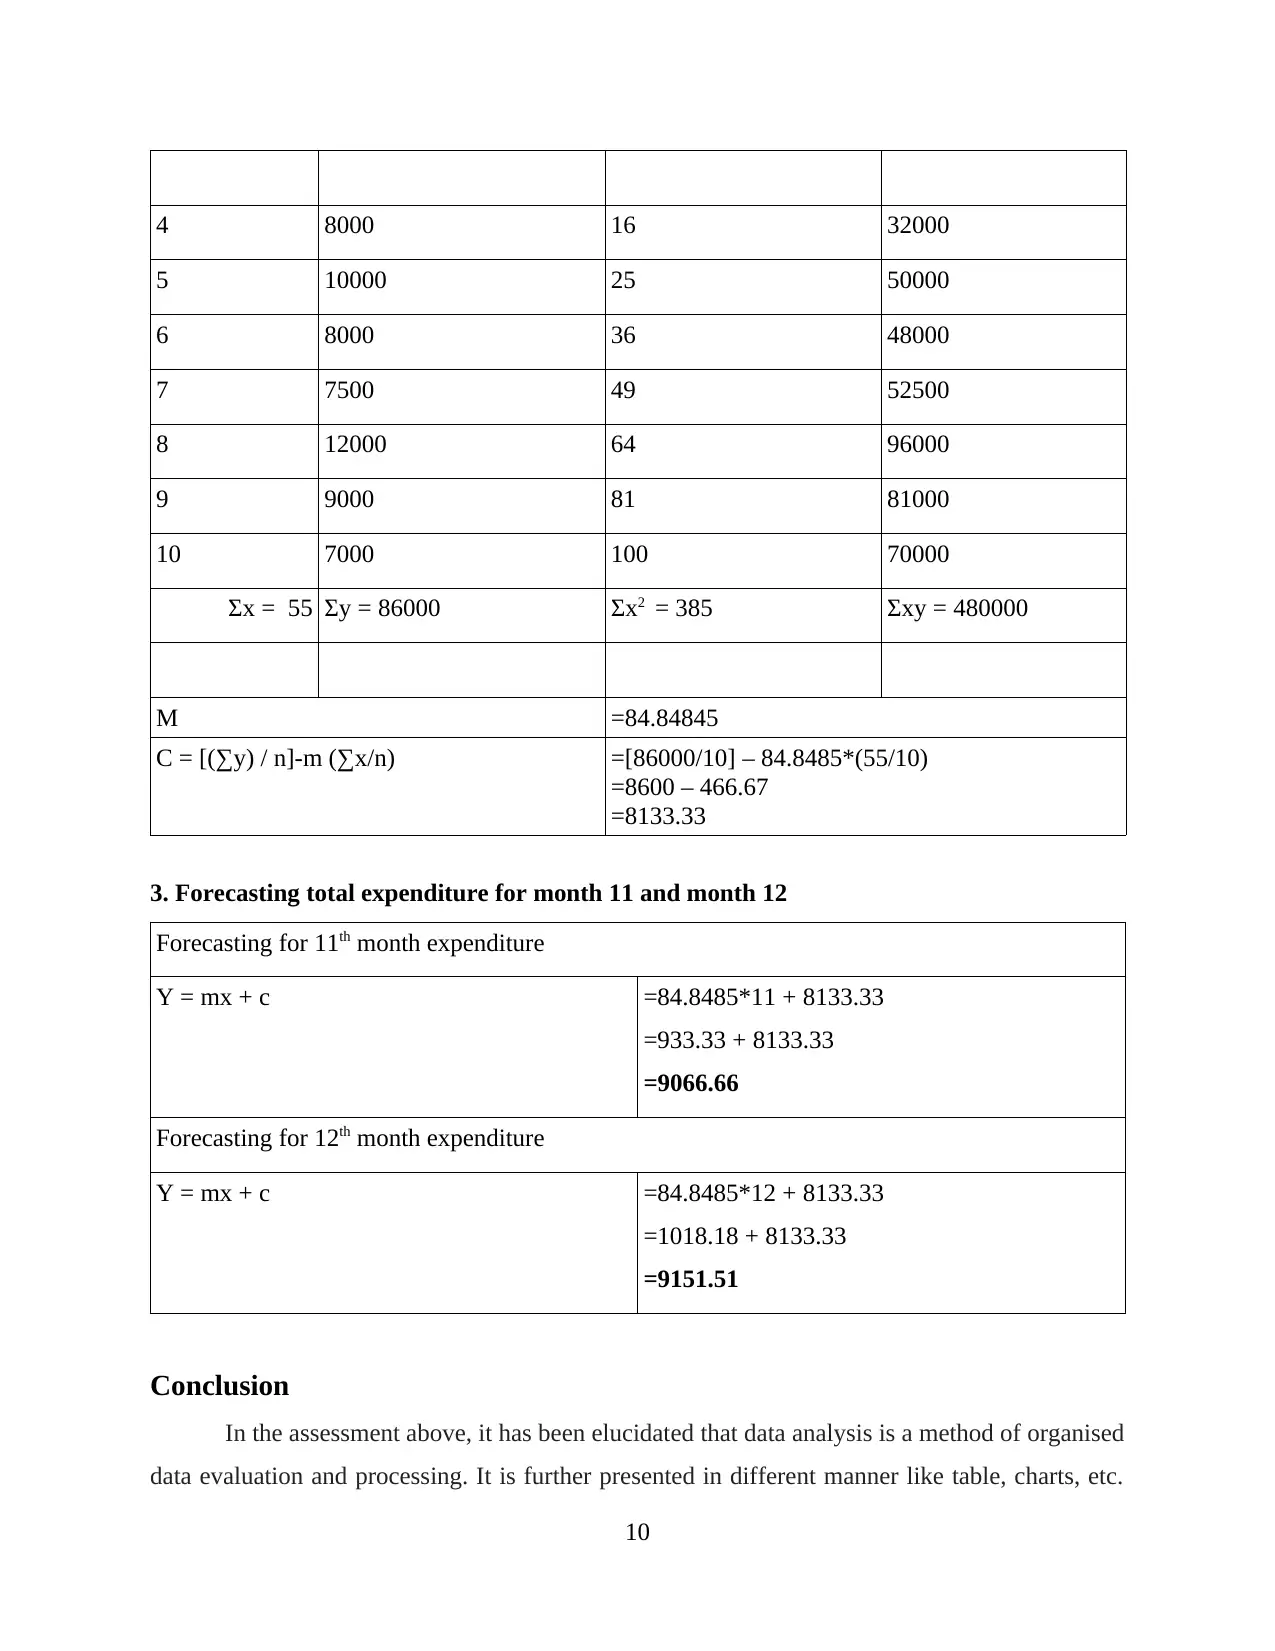
This assignment delves into the analysis of monthly expense data, utilizing a range of data mining techniques to extract meaningful insights. It begins with a tabular presentation of the data, followed by graphical representations using column and bar charts to visualize expenditure trends. The assignment then proceeds to calculate key statistical measures, including mean, median, mode, range, and standard deviation, providing a comprehensive understanding of the data's central tendencies and dispersion. Furthermore, the assessment incorporates linear forecasting to predict future monthly expenditures, offering practical application of data analysis principles. The document concludes with a summary of the findings and a list of references supporting the analysis.
Document Page
Numeracy and Data
Analysis
1
tabler-icon-diamond-filled.svg

Paraphrase This Document

Need a fresh take? Get an instant paraphrase of this document with our AI Paraphraser
Document Page
Table of Contents
Introduction......................................................................................................................................3
Main Body.......................................................................................................................................3
1. Monthly data in tabular presentation..................................................................................3
2. Monthly data in graphical presentation..............................................................................3
3. Calculations........................................................................................................................4
4. Linear forecasting model....................................................................................................8
Conclusion.......................................................................................................................................9
References......................................................................................................................................10
2
Document Page
Introduction
Data analysis aims to mine data to evaluate, process and transform data to generate
meaningful information out of it. In the assessment mentioned below, certain questions related to
data analysis has been given (Hounslow, 2018). A set of monthly expenses for 10 consecutive
months has been taken to undertake the process of data mining and drawing observation from the
same. Firstly, a tabular presentation has been drawn for the monthly data which forms the basis
for graphical representation. Column chart and bar chart have been charted. Further, using the
data mentioned above, mean, mode, median, range and standard deviation has been determined.
In addition, assessment covers forecasting the monthly expenditure for 11th and 12th month using
linear forecasting method.
Main Body
1. Monthly data in tabular presentation
Month Total expenses per month
January 6500
February 10000
March 8000
April 8000
May 10000
June 8000
July 7500
August 12000
September 9000
October 7000
2. Monthly data in graphical presentation
(I) Column Chart – Column chart is one the charts and uses vertical columns to depict data
collection on the chart.
3
Document Page
(II) Bar Chart – It uses horizontal columns to present data proportional to the values that they
represent.
4
January
February
March
April
May
June
July
August
September
October
0
2000
4000
6000
8000
10000
12000
6500
10000
8000 8000
10000
8000 7500
12000
9000
7000
Total
expenses
per month
January
Febr...
March
April
May
June
July
August
Sept...
October
0 2000 4000 6000 8000 10000 12000
6500
10000
8000
8000
10000
8000
7500
12000
9000
7000
Total
expenses
per month
tabler-icon-diamond-filled.svg

Paraphrase This Document

Need a fresh take? Get an instant paraphrase of this document with our AI Paraphraser
Document Page
3. Calculations
1. Mean
Mean is calculated by dividing summation of all the numbers in the data set by the
number of items in the data set. It is also known as average (Heeringa, West and Berglund,
2017).
Month Total expenses per month
January 6500
February 10000
March 8000
April 8000
May 10000
June 8000
July 7500
August 12000
September 9000
October 7000
Total ( Σx) 86000
Mean = Σx / n 86000/10
Mean 8600
2. Median
Median refers to the middle number of the data series arranged in an ascending or
descending order. In case of odd numbered series, it is the value of item placed in the middle of
the series and in case of even numbered series, it is the value of average of item placed in the
middle plus value of item placed next in series.
Month Total expenses per month
January 6500
5
Document Page
October 7000
July 7500
March 8000
April 8000
June 8000
September 9000
February 10000
May 10000
August 12000
N 10
M = (N/2th item + (N/2th item+1) / 2 =(10/2th item + (10/2th item + 1) / 2
=(5th item + 6th item) / 2
=(8000 + 8000) / 2
=16000 / 2
= 8000
3. Mode
Mode refers to that number which is most frequently observed in the data set. In other
words, that value in a set of data which occurs repeatedly is known as mode (Congalton and
Green, 2019).
Month Total expenses per month
January 6500
February 10000
March 8000
April 8000
6
Document Page
May 10000
June 8000
July 7500
August 12000
September 9000
October 7000
4. Range
Range refers to the difference between largest and smallest values in a given data set. It
takes into account only two extreme data values.
Month Total expenses per month
January 6500
February 10000
March 8000
April 8000
May 10000
June 8000
July 7500
August 12000
September 9000
October 7000
Highest value 12000
Lowest Value 6500
Range =(12000 – 6500)
7
tabler-icon-diamond-filled.svg

Paraphrase This Document

Need a fresh take? Get an instant paraphrase of this document with our AI Paraphraser
Document Page
= 5500
5. Standard Deviation
It is a statistical tool that is used to measure the dispersion of a dataset relative to its mean
and is calculated as square root of the variance. Further the data points are from the mean, higher
is the deviation within the data set and therefore, the more spread out is the data, higher is the
value of standard deviation (Kim, 2016).
Month Total expenses per month (X) X - mean (X - mean)2
January 6500 -2100 4410000
February 10000 1400 1960000
March 8000 -600 360000
April 8000 -600 360000
May 10000 1400 1960000
June 8000 -600 360000
July 7500 -1100 1210000
August 12000 3400 11560000
September 9000 400 160000
October 7000 -1600 2560000
Total 86000 0 24900000
Mean ( Σx / n) 8600
Variance = ((X - mean)2) / n =24900000 / 10
=2490000
Standard Deviation = (X - mean)2 / n or √Variance =√2490000
=1577.97
4. Linear forecasting model
8
Document Page
Using the equation: y = mx + c
1. Calculation of m value
Month (x) Total expenses per month
(y)
x2 xy
1 6500 1 6500
2 10000 4 20000
3 8000 9 24000
4 8000 16 32000
5 10000 25 50000
6 8000 36 48000
7 7500 49 52500
8 12000 64 96000
9 9000 81 81000
10 7000 100 70000
Σx = 55 Σy = 86000 Σx2 = 385 Σxy = 480000
M = (n* (∑xy) - (∑x) (∑y)) / (n(∑x2)-
( ∑x)2)
=(10*480000 – (55*86000)) / (10*385 -(55)2)
=4800000 – 4730000/3850 – 3025
=70000 / 825
84.84848 or 84.8485
2. Calculation of c value
Using value of m calculated above,
Month (x) Total expenses per month
(y)
x2 xy
1 6500 1 6500
2 10000 4 20000
3 8000 9 24000
9
Document Page
4 8000 16 32000
5 10000 25 50000
6 8000 36 48000
7 7500 49 52500
8 12000 64 96000
9 9000 81 81000
10 7000 100 70000
Σx = 55 Σy = 86000 Σx2 = 385 Σxy = 480000
M =84.84845
C = [(∑y) / n]-m (∑x/n) =[86000/10] – 84.8485*(55/10)
=8600 – 466.67
=8133.33
3. Forecasting total expenditure for month 11 and month 12
Forecasting for 11th month expenditure
Y = mx + c =84.8485*11 + 8133.33
=933.33 + 8133.33
=9066.66
Forecasting for 12th month expenditure
Y = mx + c =84.8485*12 + 8133.33
=1018.18 + 8133.33
=9151.51
Conclusion
In the assessment above, it has been elucidated that data analysis is a method of organised
data evaluation and processing. It is further presented in different manner like table, charts, etc.
10
tabler-icon-diamond-filled.svg

Paraphrase This Document

Need a fresh take? Get an instant paraphrase of this document with our AI Paraphraser
Document Page
to ease off extracting data for further calculations. This study assessment had predominantly
been aimed at observing the results obtained from the data analysis to draw meaningful
inferences and make required forecasts.
11
Document Page
References
Books and Journal
Congalton, R.G. and Green, K., 2019. Assessing the accuracy of remotely sensed data:
principles and practices. CRC press.
Heeringa, S.G., West, B.T. and Berglund, P.A., 2017. Applied survey data analysis. CRC press.
Hounslow, A., 2018. Water quality data: analysis and interpretation. CRC press.
Kim, J.H., 2016. Narrative data analysis and interpretation: Flirting with data. Understanding
Narrative Inquiry, edited by J Kim, pp.185-224.
12
chevron_up_icon
1 out of 12
circle_padding
hide_on_mobile
zoom_out_icon
[object Object]