Financial Analysis and Proposal: Morgan Watch Store Business Expansion

Verified

Added on  2020/12/30

|10
|1347
|127
Report
AI Summary
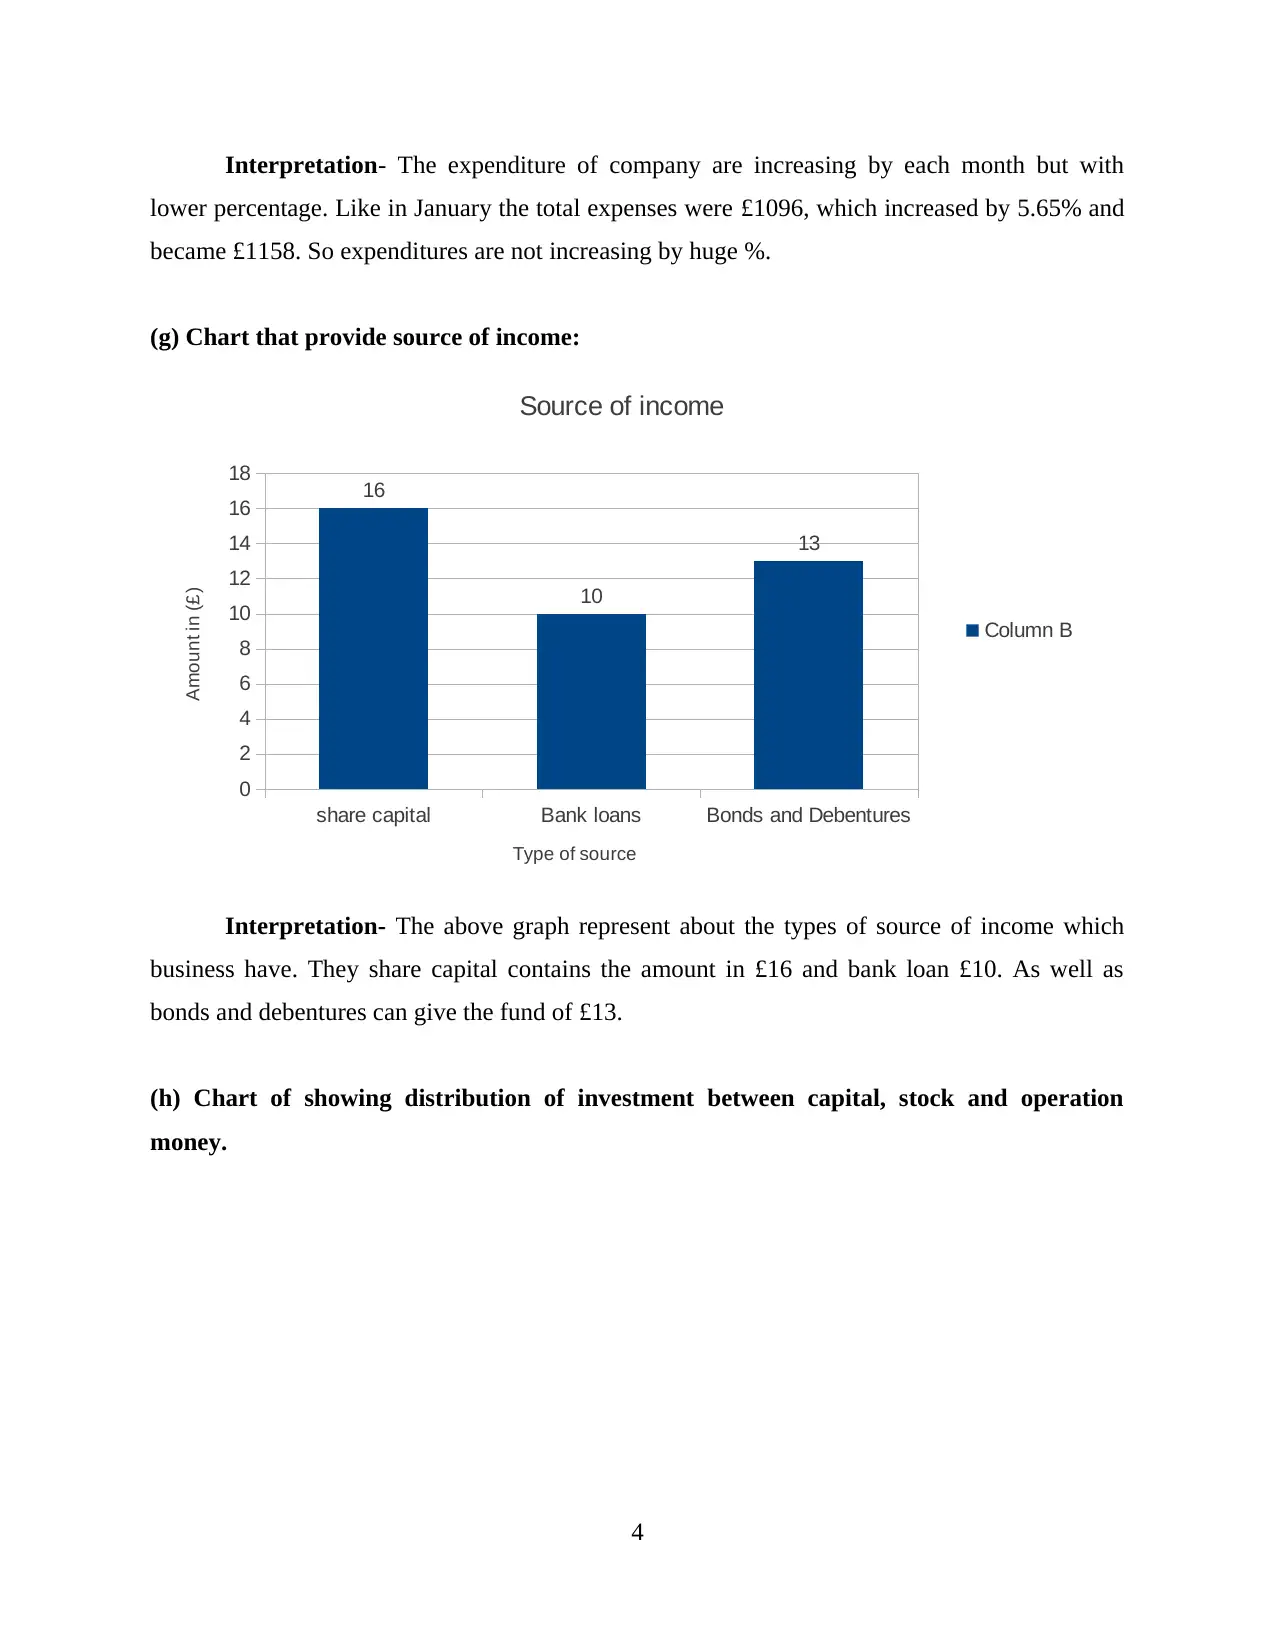
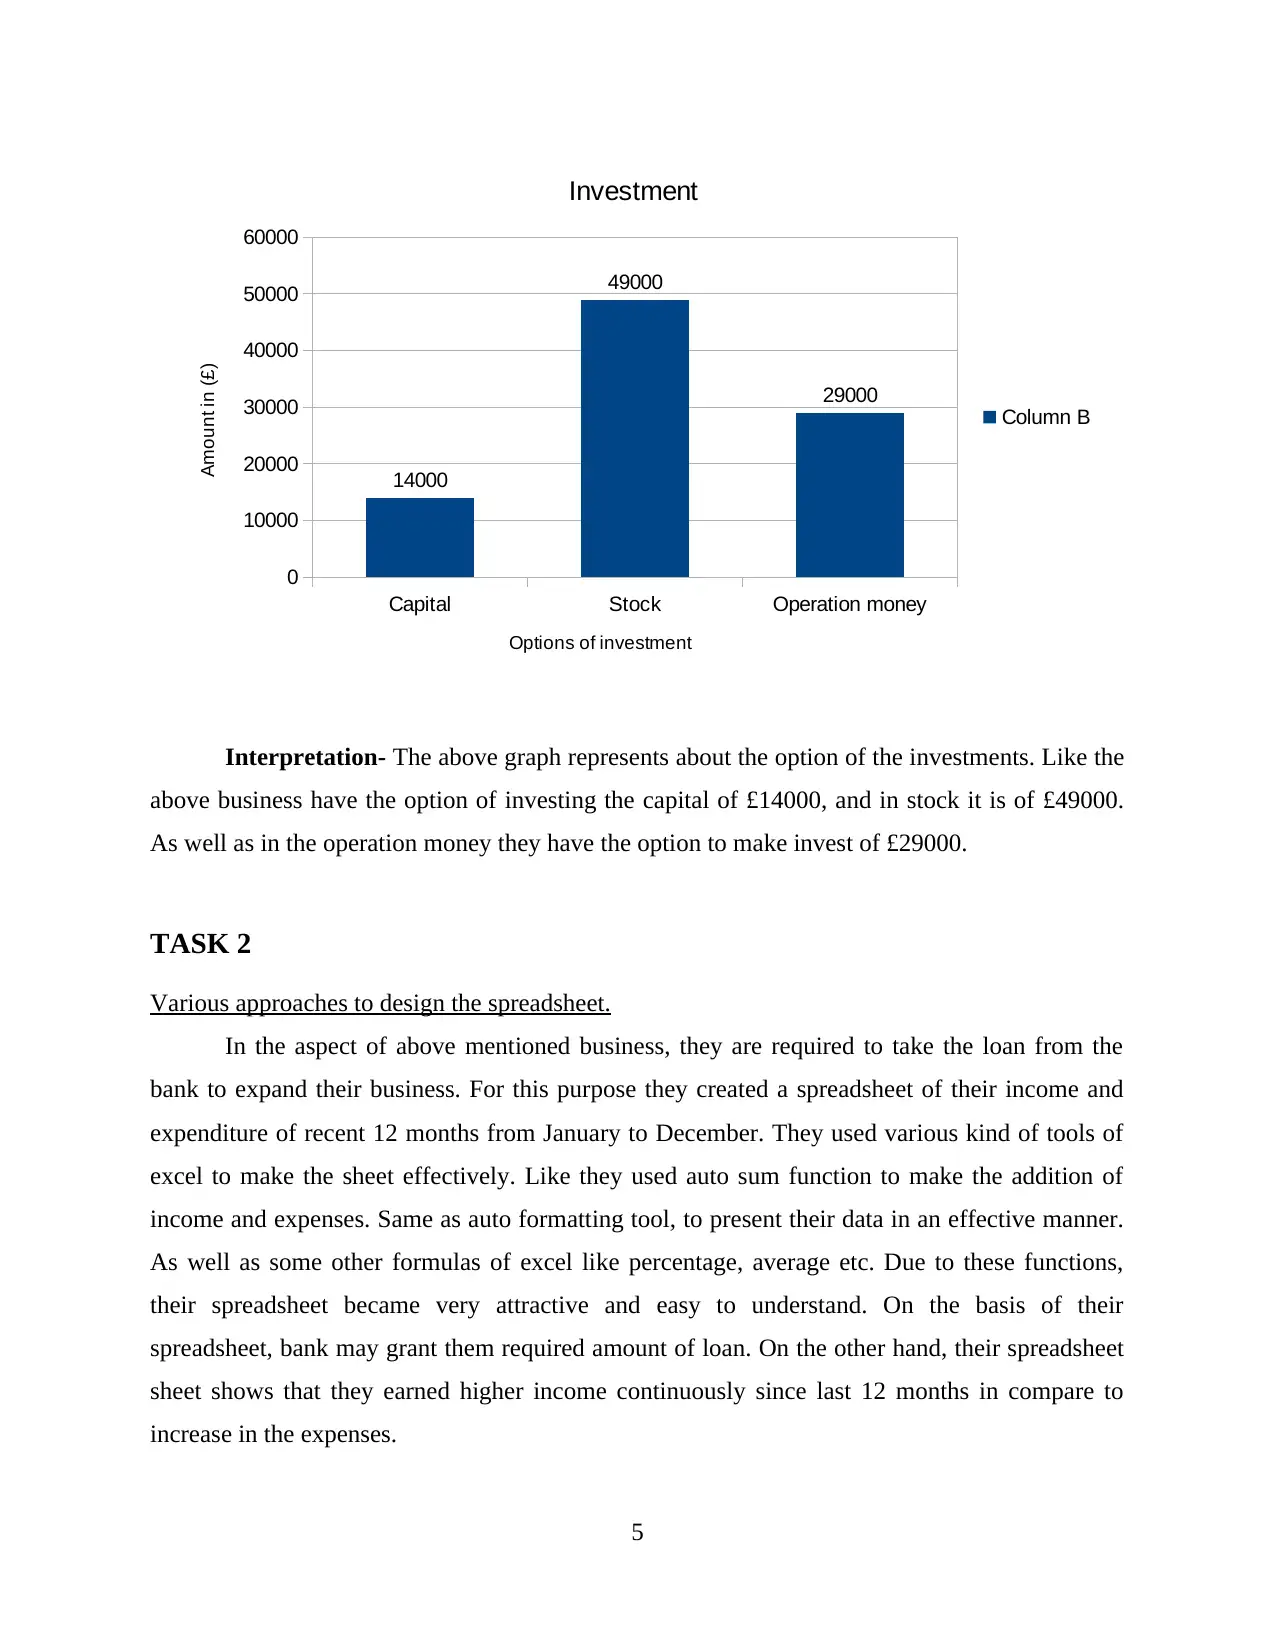
This report presents a financial analysis of Morgan Watch Store, a retail business seeking expansion. It includes a description of the business, detailing its current operations and future goals. The report provides a 12-month breakdown of sales and expenses, utilizing Excel functions like auto-sum, auto-format, average, and percentage calculations. Charts illustrate expenditure trends and sources of income, along with investment distributions. The analysis showcases the company's financial health and its strategies for expansion, including a loan proposal to a local bank. The report concludes that effective financial planning and presentation are crucial for securing funding, emphasizing the importance of a clear and understandable income and expenditure statement to potential lenders. References to relevant books and journals are included.
tabler-icon-diamond-filled.svg

Contribute Materials

Your contribution can guide someone’s learning journey. Share your documents today.
Document Page
ASSIGNMENT 2
tabler-icon-diamond-filled.svg

Secure Best Marks with AI Grader

Need help grading? Try our AI Grader for instant feedback on your assignments.
Document Page
Table of Contents
INTRODUCTION...........................................................................................................................1
TASK 1............................................................................................................................................1
(A) Description of the business....................................................................................................1
(B) Sales and expense of 12 months (January to December)......................................................1
TASK 2............................................................................................................................................5
Various approaches to design the spreadsheet.............................................................................5
CONCLUSION ...............................................................................................................................6
REFERENCES................................................................................................................................7
Document Page
Document Page
INTRODUCTION
The retail world of the UK is broad, it consists different kind of shops, supermarkets etc.
Eventually, this retail sector of the United kingdom, plays a significant role in the aspect of their
economic growth. Herein, the project report, a company from retail sector is selected that needs
the fund to expand their business. For this purpose they will require to make a proposal(including
their 12 month income and expenses) to their local bank.
TASK 1.
(A) Description of the business.
The name of business is Morgan watch store. The business sells the watches of different
variety to the customers. They have their shop in the London. Now they wants to expand their
business by increasing their product portfolio like glasses, perfumes, cloths etc. As well as
company wants to increase the area of shop because their shop is small. Apart from it they wants
to start repairing store along with selling. On the other hand, their earning is good from many
years and to implement plan of expanding the business, they require fund from the local bank.
(B) Sales and expense of 12 months (January to December)
1
tabler-icon-diamond-filled.svg

Secure Best Marks with AI Grader

Need help grading? Try our AI Grader for instant feedback on your assignments.
Document Page
(a) Auto sum- The auto sum is a kind of function of the excel that makes the addition of the
numerical data easily in less time(Reding and Wermers, 2013). The users are needed to select the
data and require to put the formula of sum. Herein, the spreadsheet of income and expenditure of
business, the formula of function is used to calculate the addition. Like if user wants to make the
addition of data from A6 to A10, then formula will be =SUM(A6:A10). So with the use of this
formula users can calculate the sum of any numerical digits.
(b) Auto format- The function of auto format of excel is useful in changing the appearance of
the data in an effective way(Herkenhoff and Fogli, 2013). Eventually, the main use of this tool
of excel is to formatting the data to make the information effective. In the spreadsheet of income
and expenditure, this tool is used to change the formatting of the digits. This function works in
2
Document Page
this way like user entered the digit 10 th without use of formatting tool. This digit can be written
in a better way by use of auto format. It can be written as 10th.
(c)Average formula- This formula is used to compute the average of numerical data entered in
the excel. Due to this formula, the calculation of the average of the data can become easier with
higher accuracy(HAWi and Samaha, 2016). In the above spreadsheet, the average formula is
being used to calculate the average of the various digits. For example if user needs to calculate
the average of some digits from A1 to A20, then formula would be =AVERAGE(A1:A20).
(d) Percentage- The formula of percentage is helpful in calculating the % of numerical
digits(Winston, 2016). Due to this, formula of the excel, users can easily compute the percentage
of the data. Basically, this is useful in reducing the discounted % from any amount. Like if users
wants to calculate the percentage between B6 and B10, then formula will be =B10/B6%. So this
way of calculating the % saves the time in calculation as well as minimise the complexity.
(e) Password protect your spreadsheet- It is useful in protecting the information from the
unwanted users. This feature of excel provides security to maintain the privacy of the users. In
this, user can use the password with own choice and can protect their data from others.
Eventually, this feature is very important for the users because privacy is the primary need of all
the users.
(f) Chart for presenting the expenditure.
January
February
March
April
May
June
July
August
September
October
November
December
1060
1080
1100
1120
1140
1160
1180
1096 1101 1107 1113 1118 1124 1129 1135 1141 1146 1152 1158
Expenditures
Column B
Months
Amount in( £)
3
Document Page
Interpretation- The expenditure of company are increasing by each month but with
lower percentage. Like in January the total expenses were £1096, which increased by 5.65% and
became £1158. So expenditures are not increasing by huge %.
(g) Chart that provide source of income:
share capital Bank loans Bonds and Debentures
0
2
4
6
8
10
12
14
16
18 16
10
13
Source of income
Column B
Type of source
Amount in (£)
Interpretation- The above graph represent about the types of source of income which
business have. They share capital contains the amount in £16 and bank loan £10. As well as
bonds and debentures can give the fund of £13.
(h) Chart of showing distribution of investment between capital, stock and operation
money.
4
tabler-icon-diamond-filled.svg

Paraphrase This Document

Need a fresh take? Get an instant paraphrase of this document with our AI Paraphraser
Document Page
Interpretation- The above graph represents about the option of the investments. Like the
above business have the option of investing the capital of £14000, and in stock it is of £49000.
As well as in the operation money they have the option to make invest of £29000.
TASK 2
Various approaches to design the spreadsheet.
In the aspect of above mentioned business, they are required to take the loan from the
bank to expand their business. For this purpose they created a spreadsheet of their income and
expenditure of recent 12 months from January to December. They used various kind of tools of
excel to make the sheet effectively. Like they used auto sum function to make the addition of
income and expenses. Same as auto formatting tool, to present their data in an effective manner.
As well as some other formulas of excel like percentage, average etc. Due to these functions,
their spreadsheet became very attractive and easy to understand. On the basis of their
spreadsheet, bank may grant them required amount of loan. On the other hand, their spreadsheet
sheet shows that they earned higher income continuously since last 12 months in compare to
increase in the expenses.
5
Capital Stock Operation money
0
10000
20000
30000
40000
50000
60000
14000
49000
29000
Investment
Column B
Options of investment
Amount in (£)
Document Page
CONCLUSION
From above project report it has been concluded that finance is the key to expand the
business and it is not easy for the businesses to arrange the fund individually. The fund can be
arrange by loan which is granted by the banks or other financial institutions. Basically, banks
give the loan on the basis of the evaluation of company's recent financial performance and
expenditure. As well as the amount level of loan depends on the income level of the businesses.
Apart from it, the statement of income and expenditure should be effective and easy to
understand so that bank can understand about the financial situation of the businesses.
6
Document Page
REFERENCES
Books and journals:
Reding, E. and Wermers, L., 2013.Microsoft Excel 2013 for Medical Professionals. Cengage
Learning.
Winston, W., 2016.Microsoft Excel data analysis and business modeling. Microsoft press.
HAWi, N. S. and Samaha, M., 2016. To excel or not to excel: Strong evidence on the adverse
effect of smartphone addiction on academic performance.Computers & Education. 98.
pp.81-89.
Herkenhoff, L. and Fogli, J., 2013.Applied statistics for business and management using
Microsoft Excel. New York: Springer.
7
chevron_up_icon
1 out of 10
circle_padding
hide_on_mobile
zoom_out_icon
logo.png

Your All-in-One AI-Powered Toolkit for Academic Success.

Available 24*7 on WhatsApp / Email

[object Object]