Analyzing Morrison's Financial Performance Through Ratio Analysis

Verified

Added on  2022/09/18

|5
|789
|26
Report
AI Summary
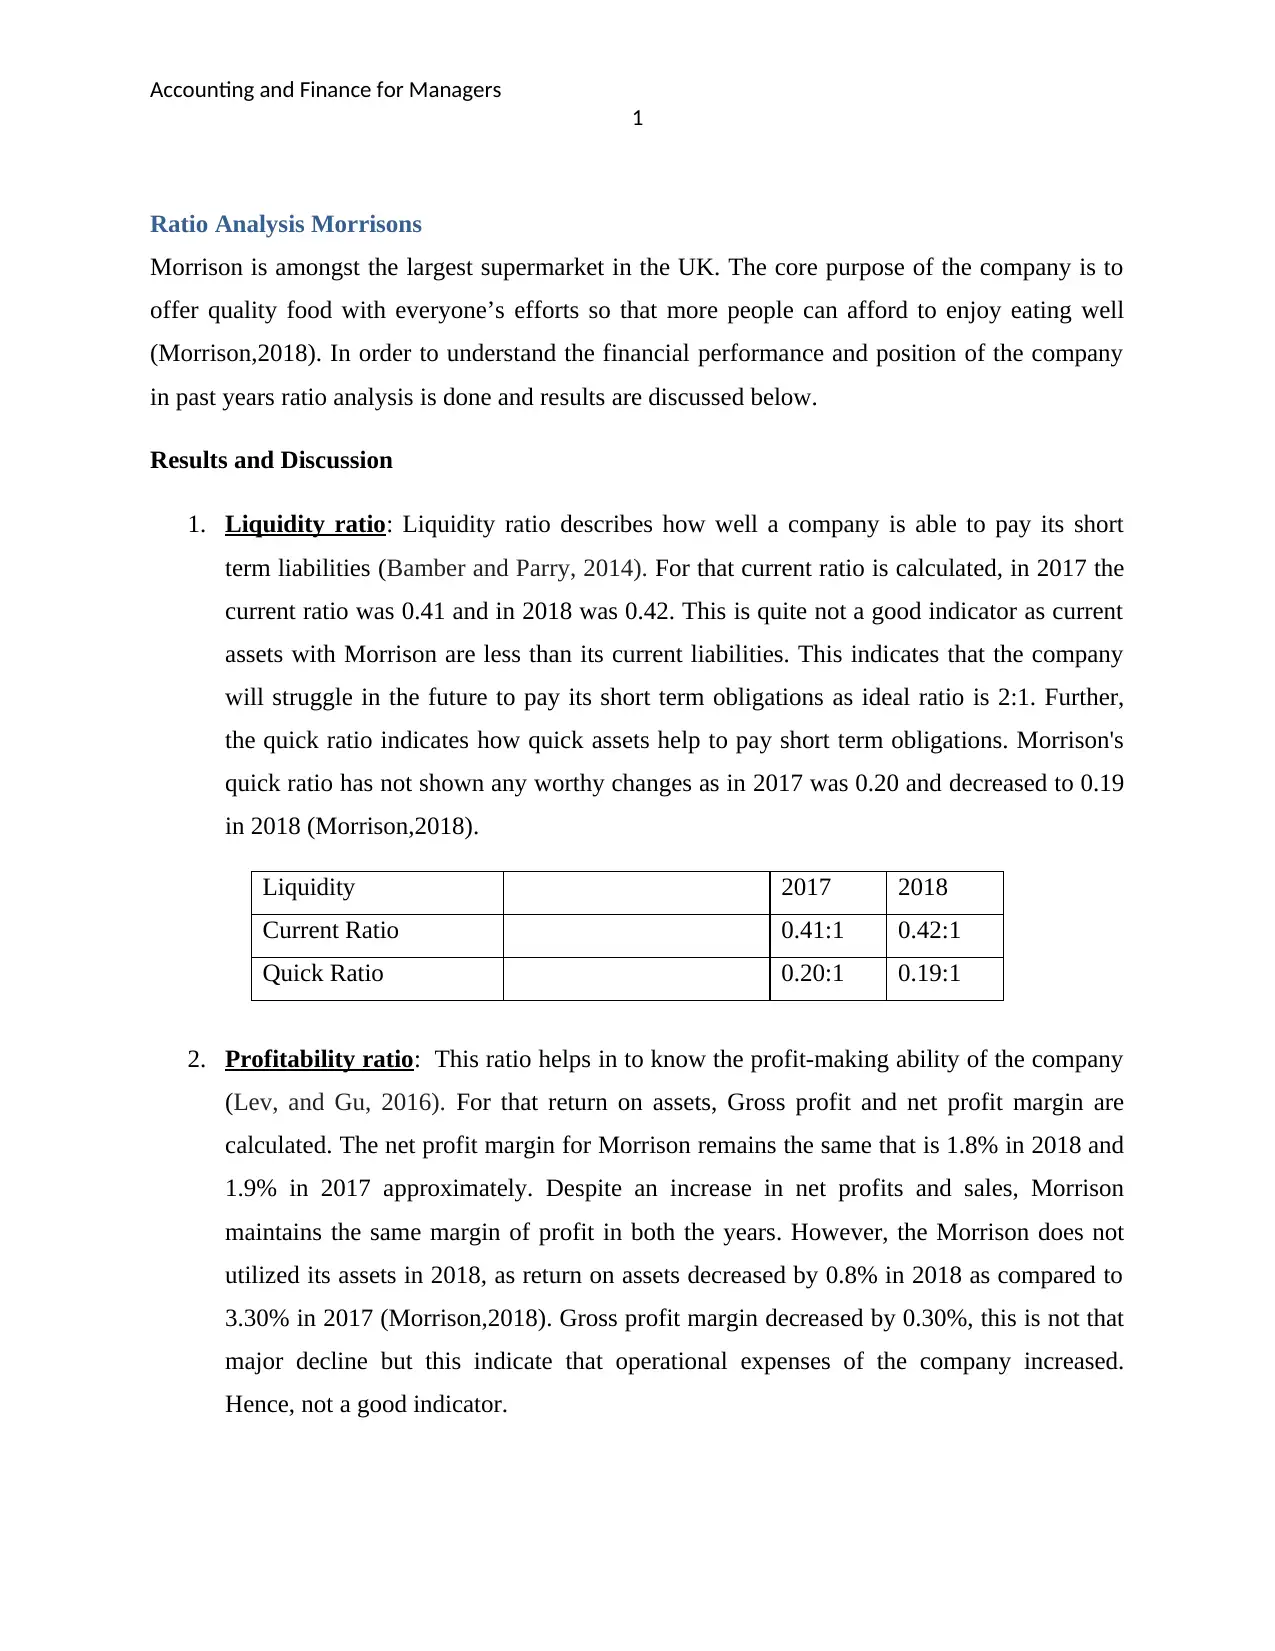
This report presents a financial ratio analysis of Wm Morrison Supermarkets, examining its performance from 2017 to 2018. The analysis includes calculations of liquidity ratios (current and quick ratio), profitability ratios (return on assets, net profit margin, and gross profit margin), capital gearing ratio (debt to equity ratio), and activity ratios (asset turnover and inventory turnover). The findings indicate that Morrison's faces challenges in liquidity, with current assets being less than current liabilities. The report shows stable profit margins, improved operational efficiency, and a less risky capital structure. Overall, the analysis suggests that Morrison's is a good investment option due to its stable profit margins and improved operational efficiency.
Document Page
RUNNING HEAD: ACCOUNTING AND FINANCE FOR MANAGERS 0
Accounting And Finance For Managers
tabler-icon-diamond-filled.svg

Paraphrase This Document

Need a fresh take? Get an instant paraphrase of this document with our AI Paraphraser
Document Page
Accounting and Finance for Managers
1
Ratio Analysis Morrisons
Morrison is amongst the largest supermarket in the UK. The core purpose of the company is to
offer quality food with everyone’s efforts so that more people can afford to enjoy eating well
(Morrison,2018). In order to understand the financial performance and position of the company
in past years ratio analysis is done and results are discussed below.
Results and Discussion
1. Liquidity ratio: Liquidity ratio describes how well a company is able to pay its short
term liabilities (Bamber and Parry, 2014). For that current ratio is calculated, in 2017 the
current ratio was 0.41 and in 2018 was 0.42. This is quite not a good indicator as current
assets with Morrison are less than its current liabilities. This indicates that the company
will struggle in the future to pay its short term obligations as ideal ratio is 2:1. Further,
the quick ratio indicates how quick assets help to pay short term obligations. Morrison's
quick ratio has not shown any worthy changes as in 2017 was 0.20 and decreased to 0.19
in 2018 (Morrison,2018).
Liquidity 2017 2018
Current Ratio 0.41:1 0.42:1
Quick Ratio 0.20:1 0.19:1
2. Profitability ratio: This ratio helps in to know the profit-making ability of the company
(Lev, and Gu, 2016). For that return on assets, Gross profit and net profit margin are
calculated. The net profit margin for Morrison remains the same that is 1.8% in 2018 and
1.9% in 2017 approximately. Despite an increase in net profits and sales, Morrison
maintains the same margin of profit in both the years. However, the Morrison does not
utilized its assets in 2018, as return on assets decreased by 0.8% in 2018 as compared to
3.30% in 2017 (Morrison,2018). Gross profit margin decreased by 0.30%, this is not that
major decline but this indicate that operational expenses of the company increased.
Hence, not a good indicator.
Document Page
Accounting and Finance for Managers
2
3. Capital
Gearing
ratio:
Capital
gearing
ratio is calculated to know the capital structure of the company, this includes the
proportion of debt and equity in the capital structure (Bamber and Parry, 2014).
Morrison's debt to equity ratio was 0.38 in 2017 and decreased to 0.28 in 2018
(Morrison,2018). As 38% structure was of debt and remaining equity in 2017 and in
2018, 28% debt and 72% equity. Higher debt ratio indicates that the company is mainly
depending on debts. Morrison ratio is low this indicates that the company is mainly run
with equity and has limited debt. This means that the company is less risky from the point
of view of investors (Lev, and Gu, 2016).
Capital Gearing 2017 2018
Debt to Equity Ratio Total Debt/ Total Equity 38.15
%
28.98
%
4. Activity ratio: This indicates the efficiency of business generating profits from its
operational cost (Lev, and Gu, 2016). Morrison has higher asset turnover in 2018 that is
1.79, which indicates that the company is utilizing its assets in the best possible way and
its operational efficiency improved as compared to 2017 (Morrsion,2018). Inventory
turnover of Morrison increased that is not good as this indicates that in 15 days Morrison
replaces its inventory and this increased from 14 days in 2017 to 15 days
(Morrison,2018).
Operational Efficiency 2017 2018
Asset Turnover Sales/ Total Assets 1.76 Times 1.79
Times
Inventory turnover ratio Sales/ Inventory 14 days 15 days
Profitability 2017 2018
Return on Assets Net Profit/ Total Assets 3.30% 3.22%
Net Profit Margin Net Profits/Sales 1.9% 1.8%
Gross Profit Margin Gross Profit/Sales 3.70% 3.67%
Document Page
Accounting and Finance for Managers
3
Hence, from the analysis, it can be concluded that Morrison is a good option for investors in
order to invest because of less risky structure, stable profit margins and improve the operational
efficiency of Morrison.
tabler-icon-diamond-filled.svg

Paraphrase This Document

Need a fresh take? Get an instant paraphrase of this document with our AI Paraphraser
Document Page
Accounting and Finance for Managers
4
References
Bamber, M. and Parry, S., 2014. Accounting and Finance for Managers: A Decision-making
Approach. Kogan Page Publishers.
Lev, B. and Gu, F., 2016. The end of accounting and the path forward for investors and
managers. John Wiley & Sons.
Morrison,2018. Building a Broader, Stronger Business. Accessed From:
http://www.annualreports.com/HostedData/AnnualReports/PDF/LSE_MRW_2018.pdf
chevron_up_icon
1 out of 5
circle_padding
hide_on_mobile
zoom_out_icon