Comparative Analysis: Mortality, Fertility, and Population Projections

Verified

Added on  2020/05/03

|6
|933
|92
Project
AI Summary
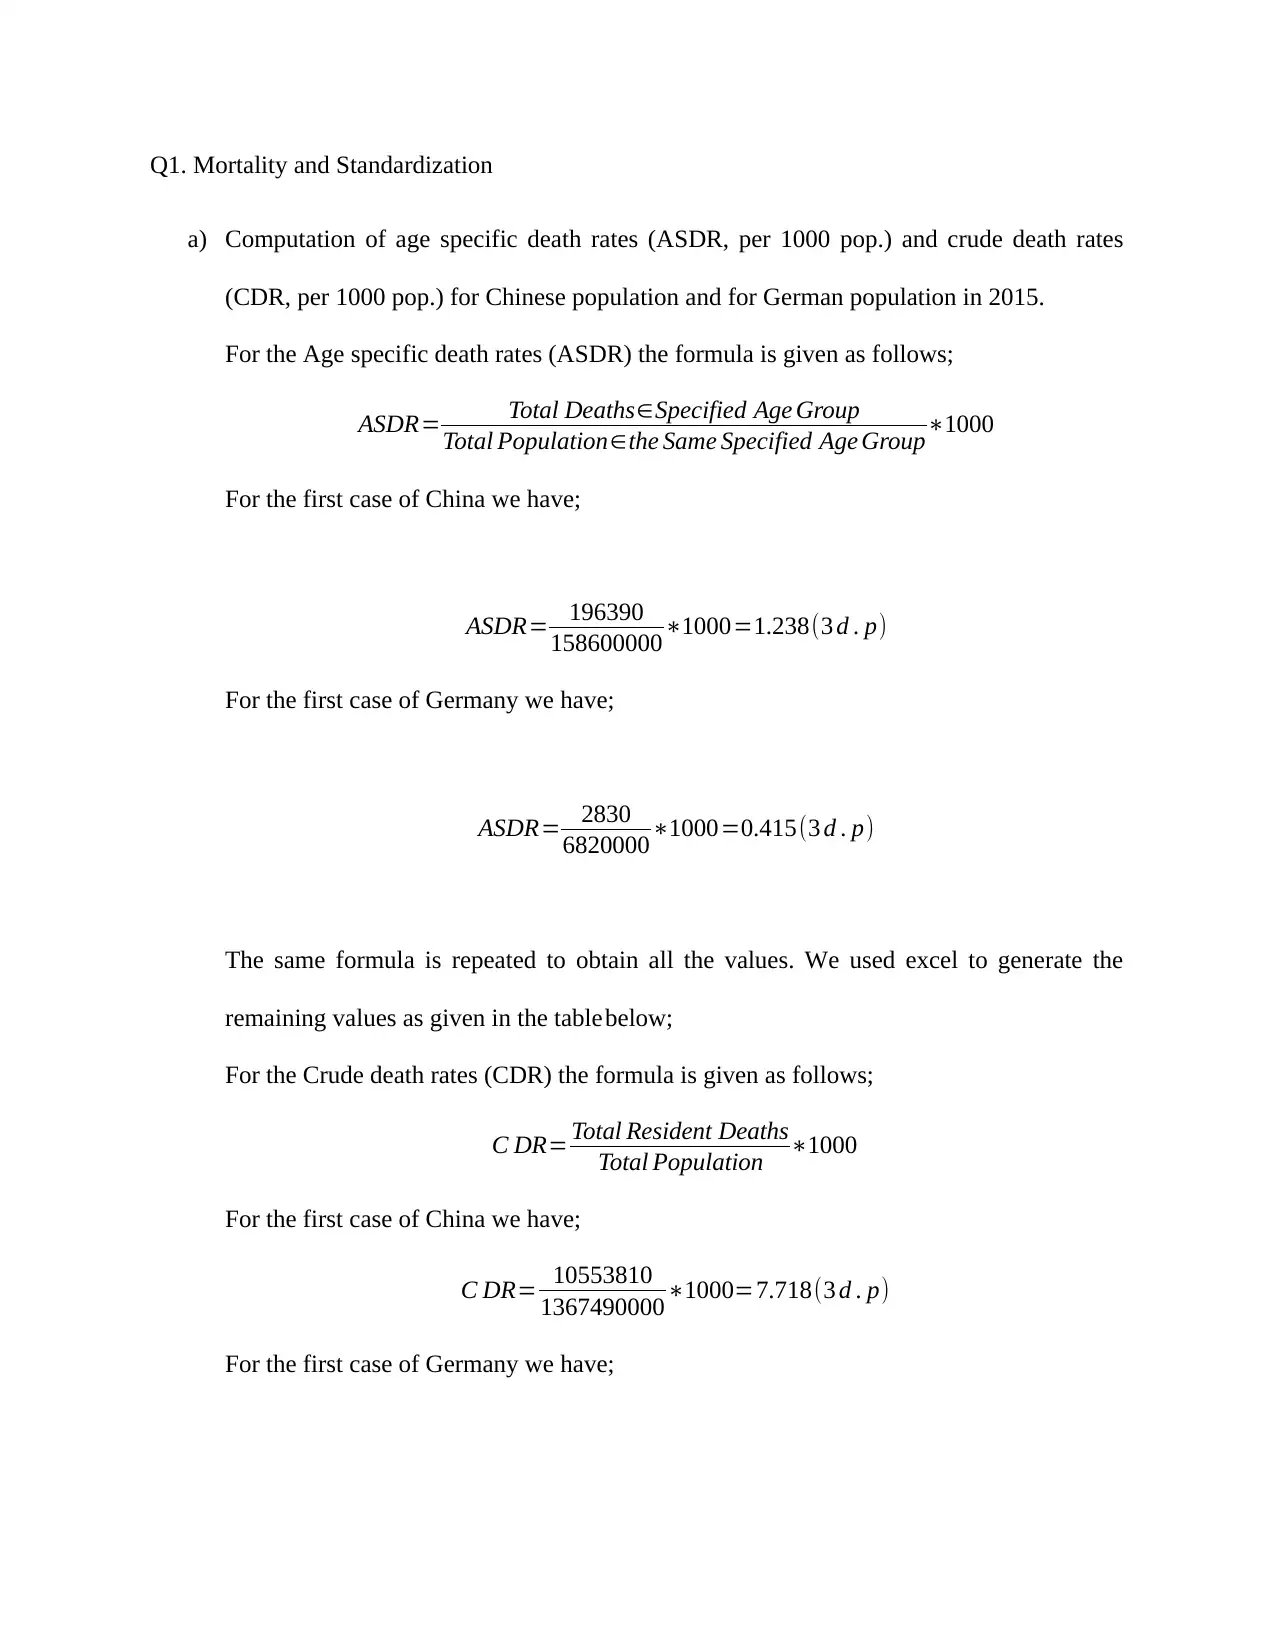
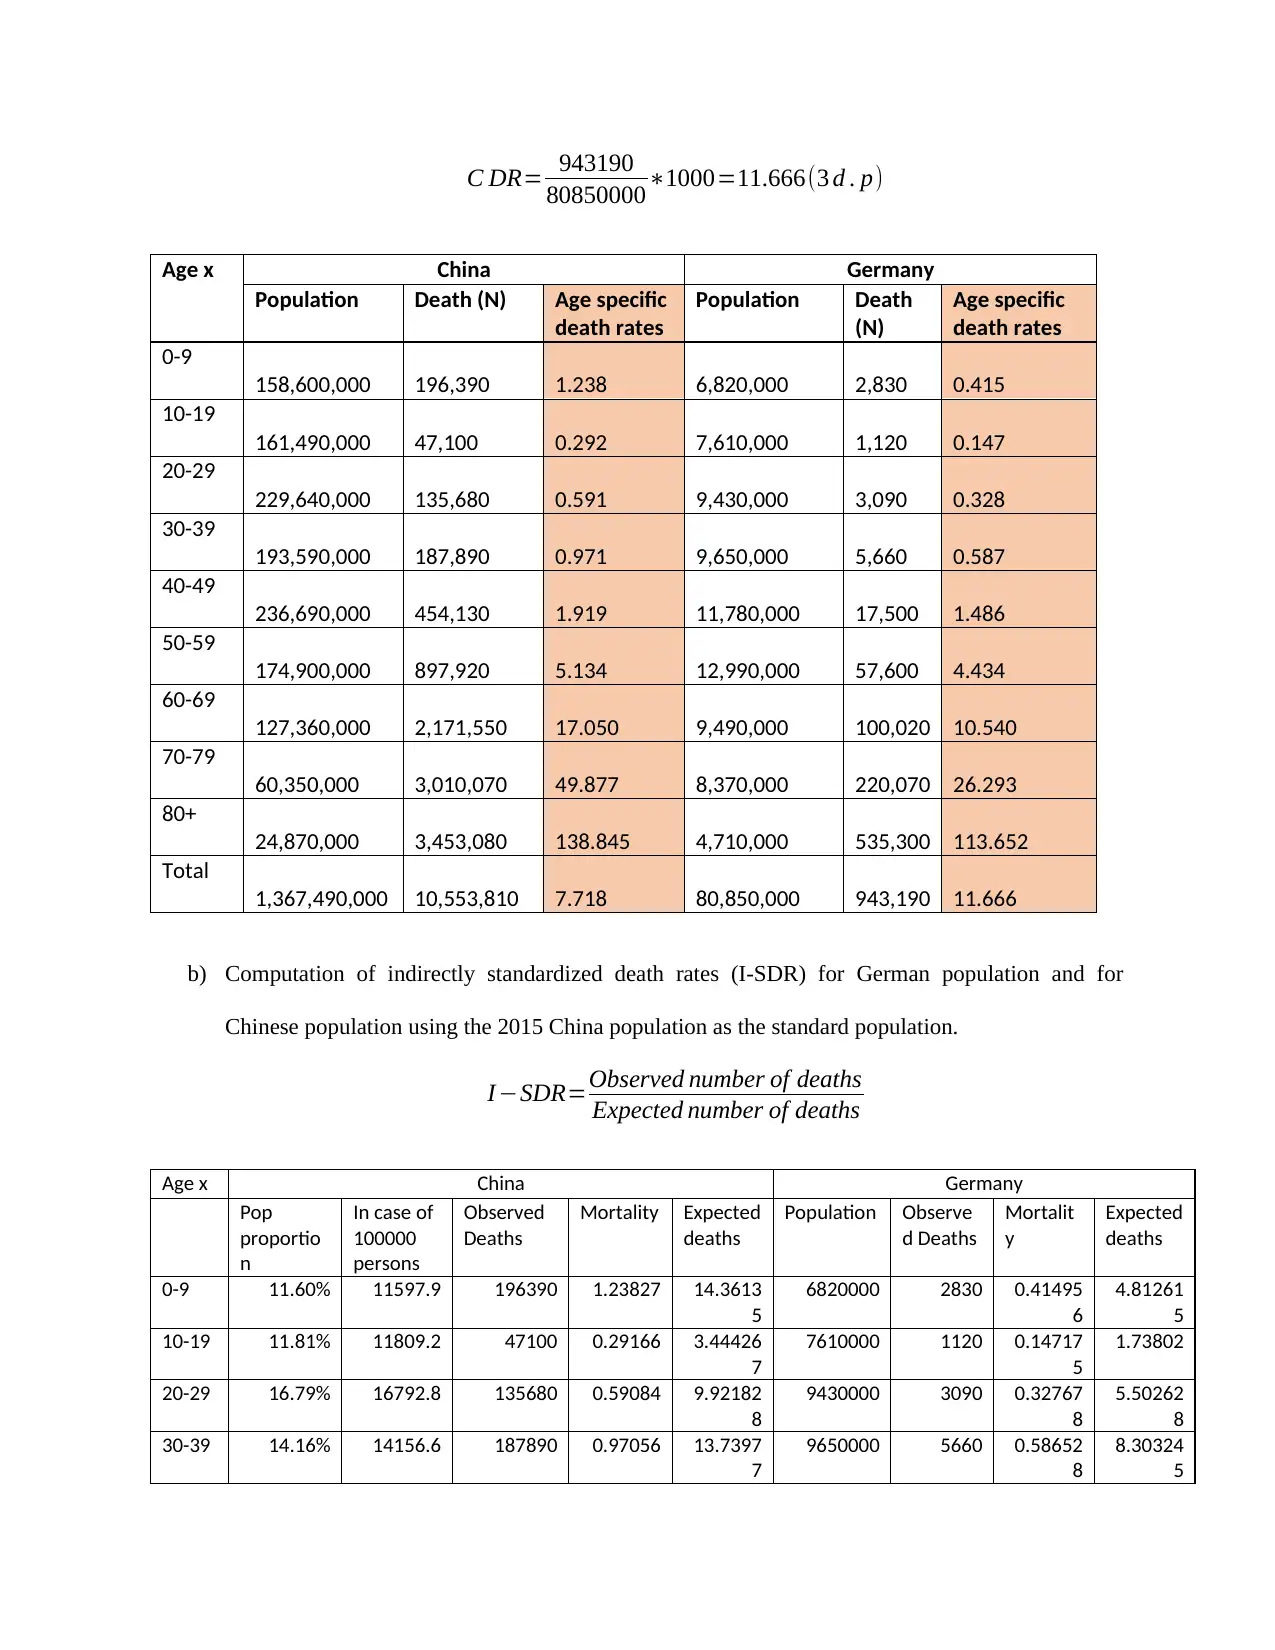
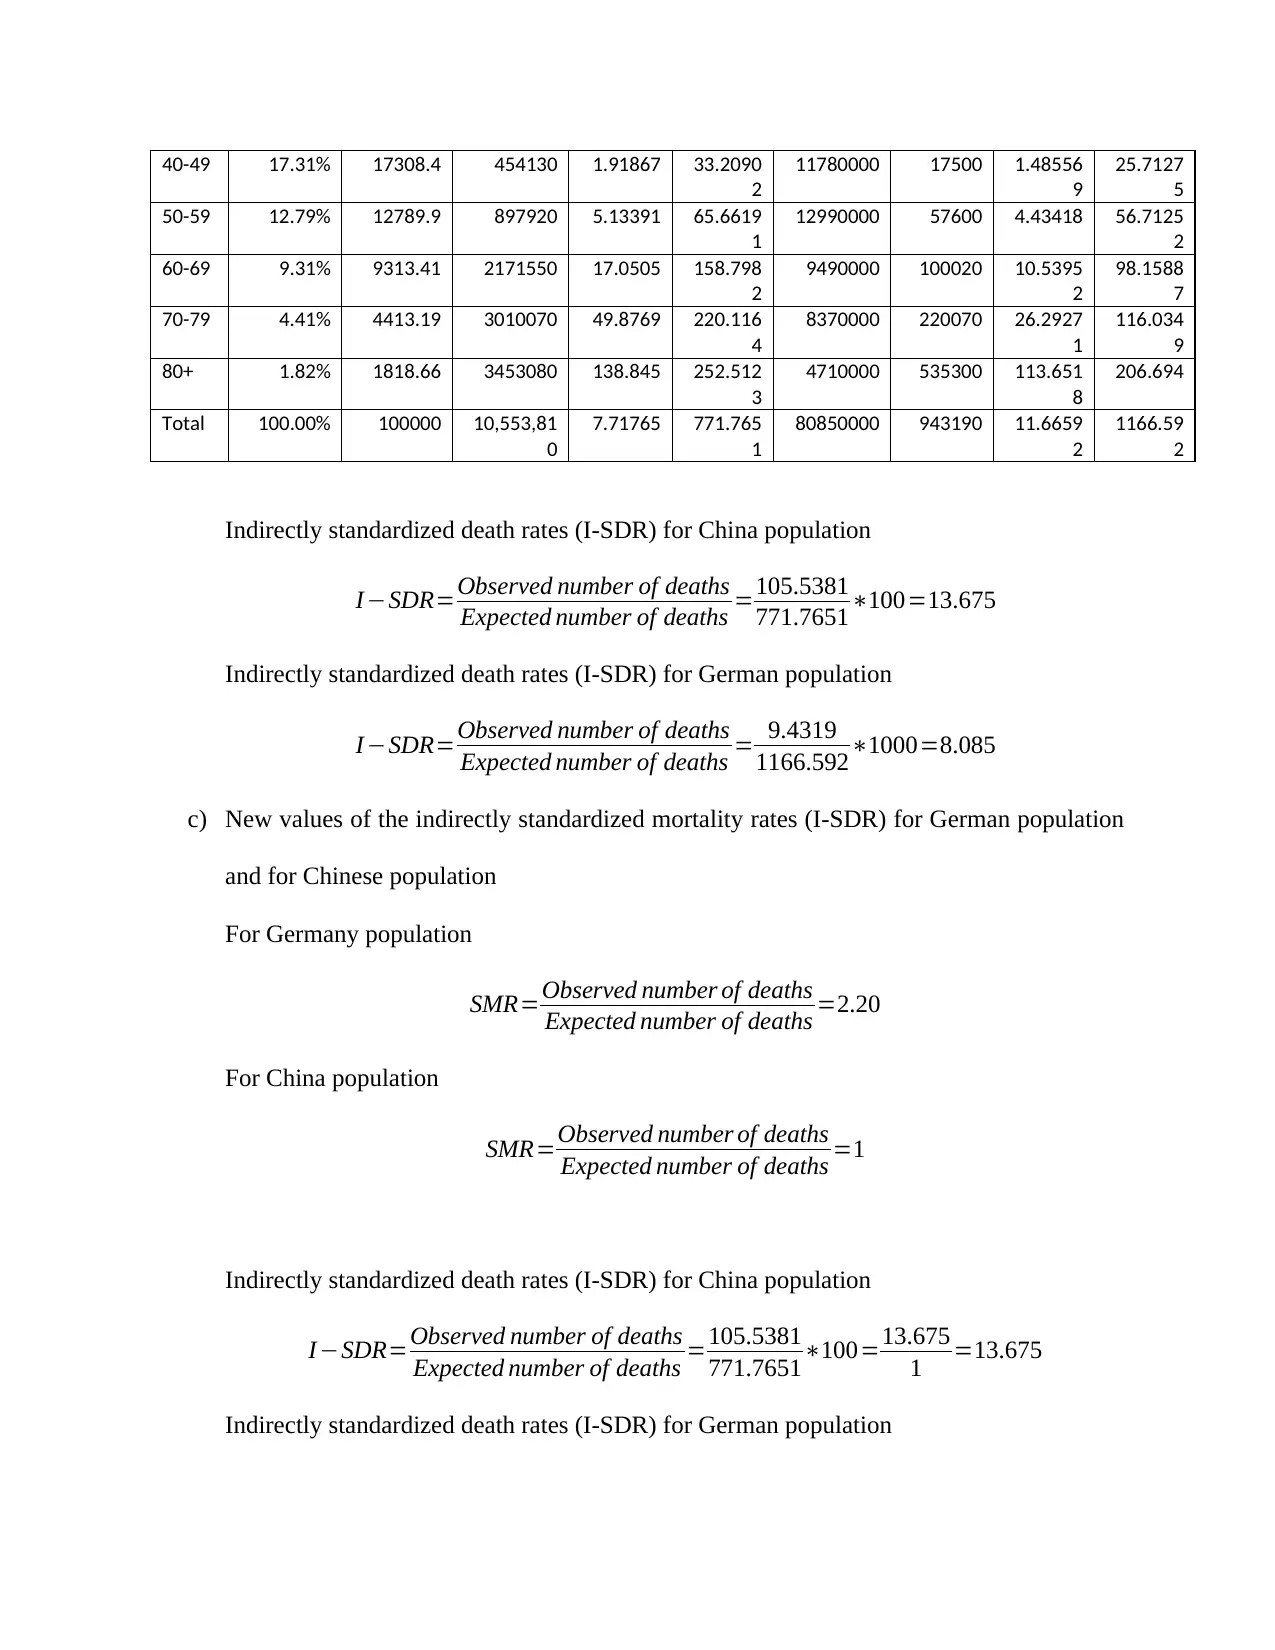
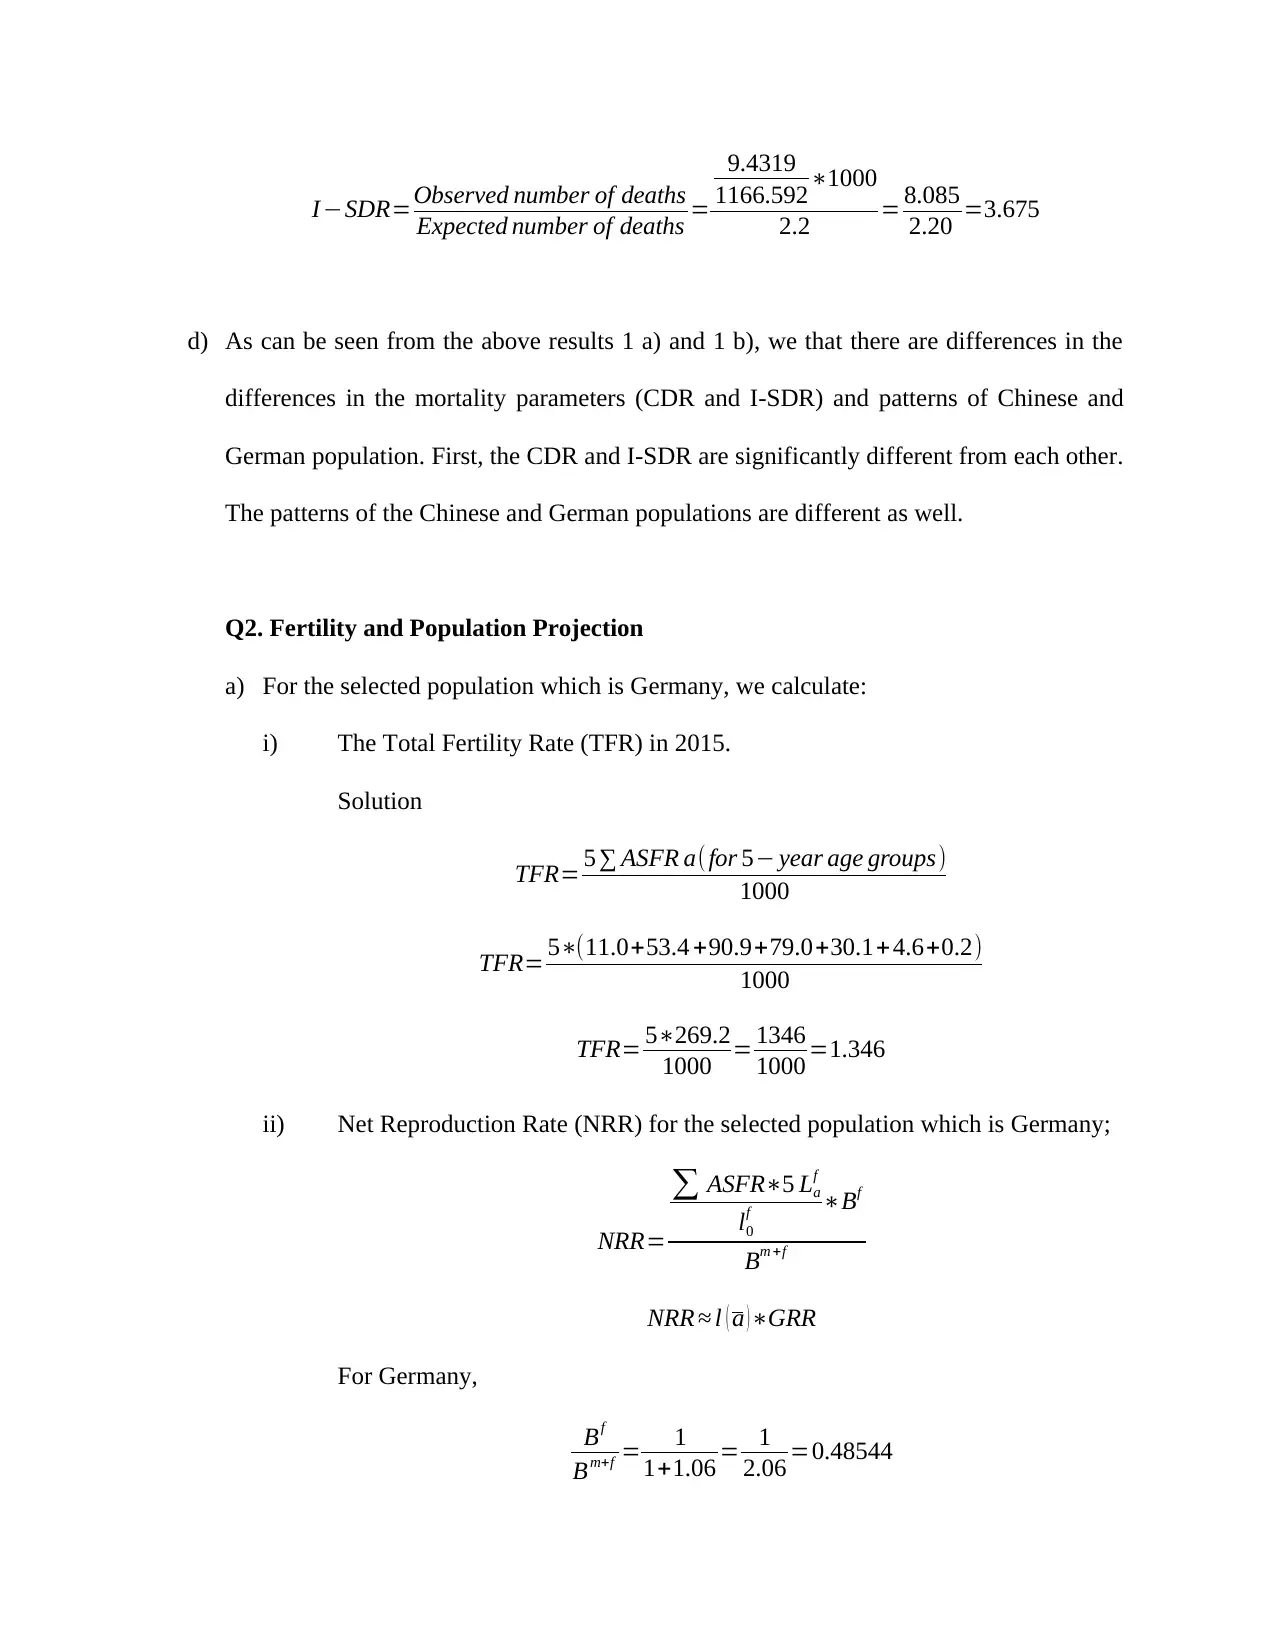
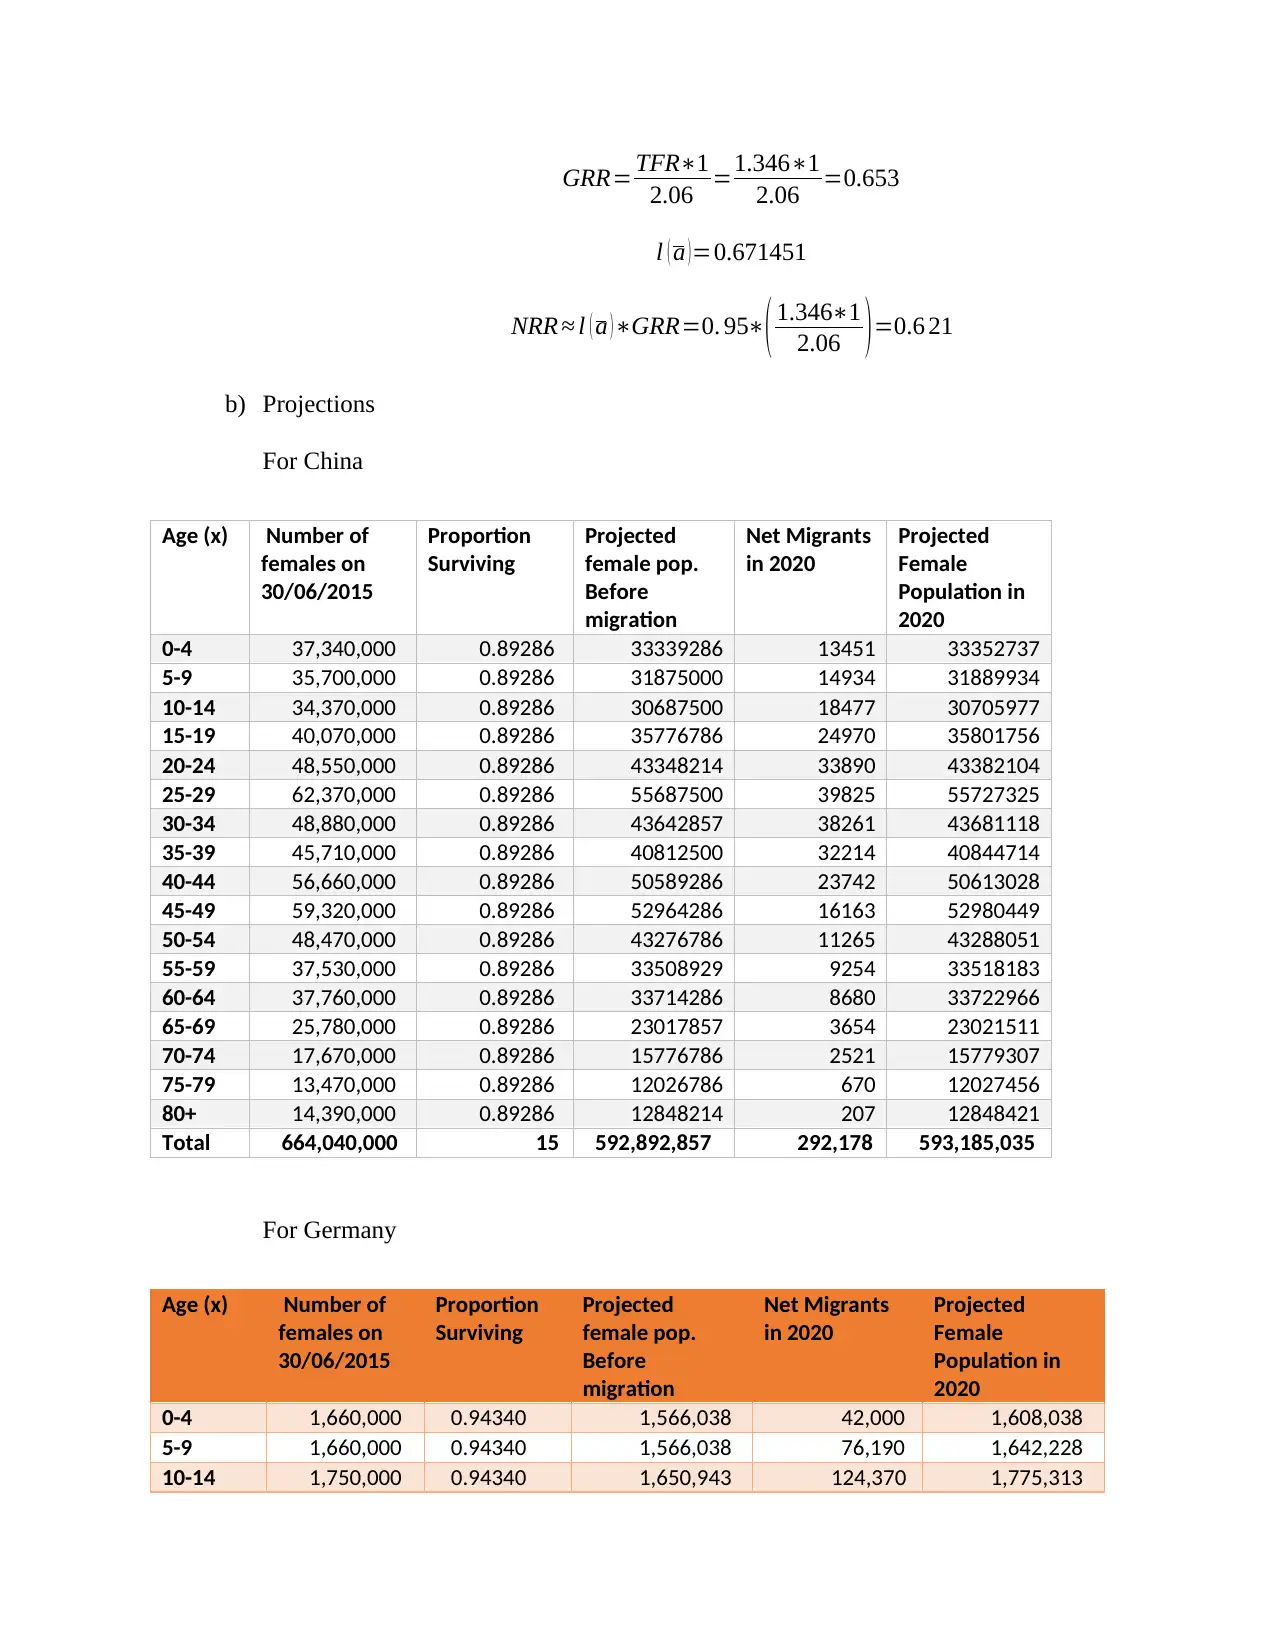
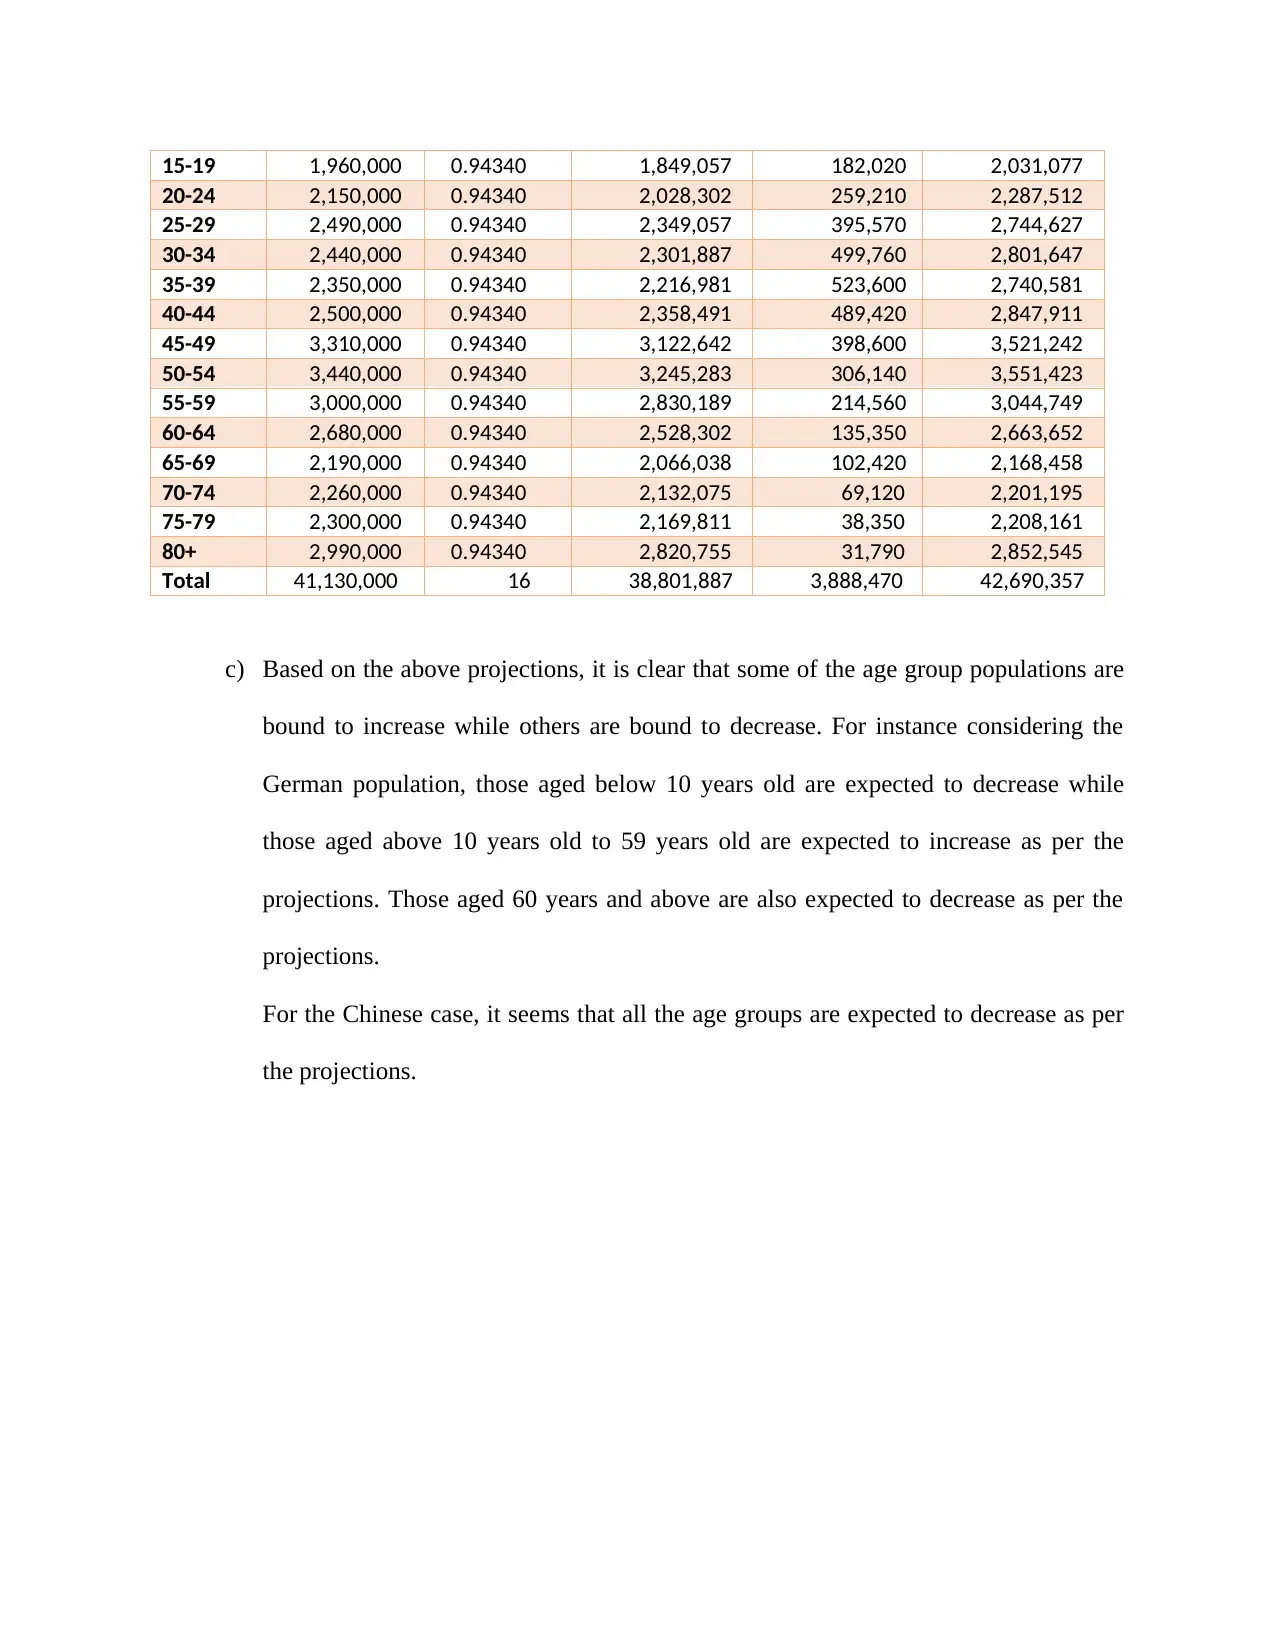
This project delves into a comparative demographic analysis of China and Germany, focusing on mortality and fertility rates. The assignment begins by calculating age-specific death rates (ASDR) and crude death rates (CDR) for both populations in 2015. Indirectly standardized death rates (I-SDR) are computed using the 2015 China population as the standard. The project then shifts to fertility analysis, calculating the Total Fertility Rate (TFR) and Net Reproduction Rate (NRR) for Germany. Finally, the project includes population projections for both countries, estimating the female population in 2020 based on survival rates and net migration, highlighting expected increases and decreases in different age groups. The analysis reveals differences in mortality patterns and future population trends between the two nations.
Document Page
Q1. Mortality and Standardization
a) Computation of age specific death rates (ASDR, per 1000 pop.) and crude death rates
(CDR, per 1000 pop.) for Chinese population and for German population in 2015.
For the Age specific death rates (ASDR) the formula is given as follows;
ASDR= Total Deaths∈Specified Age Group
Total Population∈the Same Specified Age Group∗1000
For the first case of China we have;
ASDR= 196390
158600000∗1000=1.238(3 d . p)
For the first case of Germany we have;
ASDR= 2830
6820000∗1000=0.415(3 d . p)
The same formula is repeated to obtain all the values. We used excel to generate the
remaining values as given in the table below;
For the Crude death rates (CDR) the formula is given as follows;
C DR= Total Resident Deaths
Total Population ∗1000
For the first case of China we have;
C DR= 10553810
1367490000∗1000=7.718(3 d . p)
For the first case of Germany we have;
tabler-icon-diamond-filled.svg

Paraphrase This Document

Need a fresh take? Get an instant paraphrase of this document with our AI Paraphraser
Document Page
C DR= 943190
80850000∗1000=11.666(3 d . p)
Age x China Germany
Population Death (N) Age specific
death rates
Population Death
(N)
Age specific
death rates
0-9
158,600,000 196,390 1.238 6,820,000 2,830 0.415
10-19
161,490,000 47,100 0.292 7,610,000 1,120 0.147
20-29
229,640,000 135,680 0.591 9,430,000 3,090 0.328
30-39
193,590,000 187,890 0.971 9,650,000 5,660 0.587
40-49
236,690,000 454,130 1.919 11,780,000 17,500 1.486
50-59
174,900,000 897,920 5.134 12,990,000 57,600 4.434
60-69
127,360,000 2,171,550 17.050 9,490,000 100,020 10.540
70-79
60,350,000 3,010,070 49.877 8,370,000 220,070 26.293
80+
24,870,000 3,453,080 138.845 4,710,000 535,300 113.652
Total
1,367,490,000 10,553,810 7.718 80,850,000 943,190 11.666
b) Computation of indirectly standardized death rates (I-SDR) for German population and for
Chinese population using the 2015 China population as the standard population.
I −SDR=Observed number of deaths
Expected number of deaths
Age x China Germany
Pop
proportio
n
In case of
100000
persons
Observed
Deaths
Mortality Expected
deaths
Population Observe
d Deaths
Mortalit
y
Expected
deaths
0-9 11.60% 11597.9 196390 1.23827 14.3613
5
6820000 2830 0.41495
6
4.81261
5
10-19 11.81% 11809.2 47100 0.29166 3.44426
7
7610000 1120 0.14717
5
1.73802
20-29 16.79% 16792.8 135680 0.59084 9.92182
8
9430000 3090 0.32767
8
5.50262
8
30-39 14.16% 14156.6 187890 0.97056 13.7397
7
9650000 5660 0.58652
8
8.30324
5
Document Page
40-49 17.31% 17308.4 454130 1.91867 33.2090
2
11780000 17500 1.48556
9
25.7127
5
50-59 12.79% 12789.9 897920 5.13391 65.6619
1
12990000 57600 4.43418 56.7125
2
60-69 9.31% 9313.41 2171550 17.0505 158.798
2
9490000 100020 10.5395
2
98.1588
7
70-79 4.41% 4413.19 3010070 49.8769 220.116
4
8370000 220070 26.2927
1
116.034
9
80+ 1.82% 1818.66 3453080 138.845 252.512
3
4710000 535300 113.651
8
206.694
Total 100.00% 100000 10,553,81
0
7.71765 771.765
1
80850000 943190 11.6659
2
1166.59
2
Indirectly standardized death rates (I-SDR) for China population
I −SDR=Observed number of deaths
Expected number of deaths =105.5381
771.7651∗100=13.675
Indirectly standardized death rates (I-SDR) for German population
I −SDR=Observed number of deaths
Expected number of deaths = 9.4319
1166.592∗1000=8.085
c) New values of the indirectly standardized mortality rates (I-SDR) for German population
and for Chinese population
For Germany population
SMR=Observed number of deaths
Expected number of deaths =2.20
For China population
SMR=Observed number of deaths
Expected number of deaths =1
Indirectly standardized death rates (I-SDR) for China population
I −SDR=Observed number of deaths
Expected number of deaths =105.5381
771.7651∗100=13.675
1 =13.675
Indirectly standardized death rates (I-SDR) for German population
Document Page
I −SDR=Observed number of deaths
Expected number of deaths =
9.4319
1166.592∗1000
2.2 = 8.085
2.20 =3.675
d) As can be seen from the above results 1 a) and 1 b), we that there are differences in the
differences in the mortality parameters (CDR and I-SDR) and patterns of Chinese and
German population. First, the CDR and I-SDR are significantly different from each other.
The patterns of the Chinese and German populations are different as well.
Q2. Fertility and Population Projection
a) For the selected population which is Germany, we calculate:
i) The Total Fertility Rate (TFR) in 2015.
Solution
TFR= 5 ∑ ASFR a(for 5− year age groups)
1000
TFR= 5∗(11.0+53.4 +90.9+79.0+30.1+4.6+0.2)
1000
TFR= 5∗269.2
1000 = 1346
1000 =1.346
ii) Net Reproduction Rate (NRR) for the selected population which is Germany;
NRR=
∑ ASFR∗5 La
f
l0
f ∗Bf
Bm +f
NRR ≈ l ( a )∗GRR
For Germany,
Bf
Bm+f = 1
1+1.06 = 1
2.06 =0.48544
tabler-icon-diamond-filled.svg

Paraphrase This Document

Need a fresh take? Get an instant paraphrase of this document with our AI Paraphraser
Document Page
GRR= TFR∗1
2.06 =1.346∗1
2.06 =0.653
l ( a ) =0.671451
NRR ≈ l ( a )∗GRR=0. 95∗( 1.346∗1
2.06 )=0.6 21
b) Projections
For China
Age (x) Number of
females on
30/06/2015
Proportion
Surviving
Projected
female pop.
Before
migration
Net Migrants
in 2020
Projected
Female
Population in
2020
0-4 37,340,000 0.89286 33339286 13451 33352737
5-9 35,700,000 0.89286 31875000 14934 31889934
10-14 34,370,000 0.89286 30687500 18477 30705977
15-19 40,070,000 0.89286 35776786 24970 35801756
20-24 48,550,000 0.89286 43348214 33890 43382104
25-29 62,370,000 0.89286 55687500 39825 55727325
30-34 48,880,000 0.89286 43642857 38261 43681118
35-39 45,710,000 0.89286 40812500 32214 40844714
40-44 56,660,000 0.89286 50589286 23742 50613028
45-49 59,320,000 0.89286 52964286 16163 52980449
50-54 48,470,000 0.89286 43276786 11265 43288051
55-59 37,530,000 0.89286 33508929 9254 33518183
60-64 37,760,000 0.89286 33714286 8680 33722966
65-69 25,780,000 0.89286 23017857 3654 23021511
70-74 17,670,000 0.89286 15776786 2521 15779307
75-79 13,470,000 0.89286 12026786 670 12027456
80+ 14,390,000 0.89286 12848214 207 12848421
Total 664,040,000 15 592,892,857 292,178 593,185,035
For Germany
Age (x) Number of
females on
30/06/2015
Proportion
Surviving
Projected
female pop.
Before
migration
Net Migrants
in 2020
Projected
Female
Population in
2020
0-4 1,660,000 0.94340 1,566,038 42,000 1,608,038
5-9 1,660,000 0.94340 1,566,038 76,190 1,642,228
10-14 1,750,000 0.94340 1,650,943 124,370 1,775,313
Document Page
15-19 1,960,000 0.94340 1,849,057 182,020 2,031,077
20-24 2,150,000 0.94340 2,028,302 259,210 2,287,512
25-29 2,490,000 0.94340 2,349,057 395,570 2,744,627
30-34 2,440,000 0.94340 2,301,887 499,760 2,801,647
35-39 2,350,000 0.94340 2,216,981 523,600 2,740,581
40-44 2,500,000 0.94340 2,358,491 489,420 2,847,911
45-49 3,310,000 0.94340 3,122,642 398,600 3,521,242
50-54 3,440,000 0.94340 3,245,283 306,140 3,551,423
55-59 3,000,000 0.94340 2,830,189 214,560 3,044,749
60-64 2,680,000 0.94340 2,528,302 135,350 2,663,652
65-69 2,190,000 0.94340 2,066,038 102,420 2,168,458
70-74 2,260,000 0.94340 2,132,075 69,120 2,201,195
75-79 2,300,000 0.94340 2,169,811 38,350 2,208,161
80+ 2,990,000 0.94340 2,820,755 31,790 2,852,545
Total 41,130,000 16 38,801,887 3,888,470 42,690,357
c) Based on the above projections, it is clear that some of the age group populations are
bound to increase while others are bound to decrease. For instance considering the
German population, those aged below 10 years old are expected to decrease while
those aged above 10 years old to 59 years old are expected to increase as per the
projections. Those aged 60 years and above are also expected to decrease as per the
projections.
For the Chinese case, it seems that all the age groups are expected to decrease as per
the projections.
chevron_up_icon
1 out of 6
circle_padding
hide_on_mobile
zoom_out_icon
[object Object]