Public Health Statistics Homework: Mortality and Survival Analysis

Verified

Added on  2022/08/25

|10
|1128
|38
Homework Assignment
AI Summary
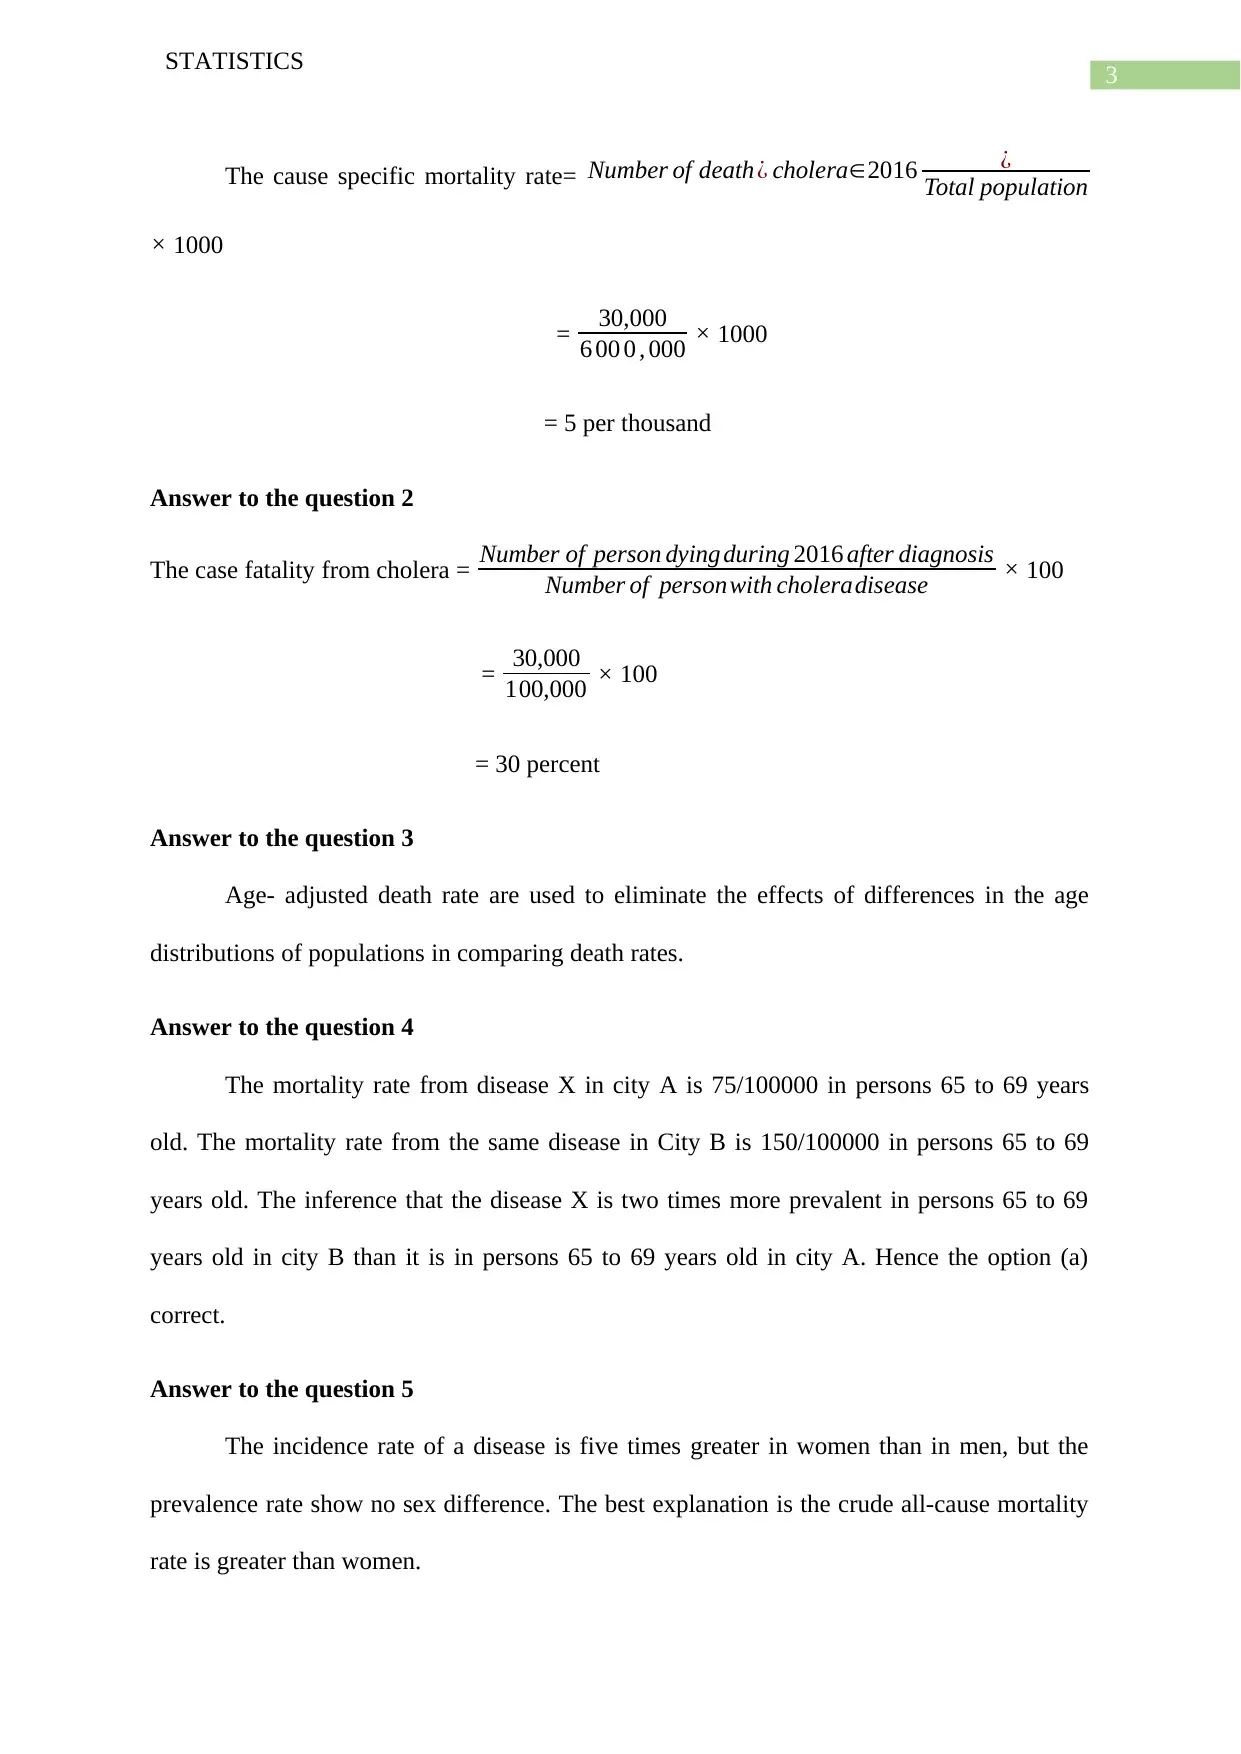
This document presents a comprehensive solution to a statistics homework assignment, likely for a public health or biostatistics course, covering key concepts in mortality and survival analysis. The assignment addresses various aspects of mortality, including calculating cause-specific mortality rates, case fatality, and age-adjusted death rates. It also delves into survival analysis, exploring methods like life tables and the Kaplan-Meier method to estimate survival probabilities. Furthermore, the solution examines the impact of factors such as disease prevalence, treatment effectiveness, and potential biases on survival outcomes. The assignment also demonstrates the application of statistical measures such as the standardized mortality ratio and relative survival rates, providing a detailed analysis of the natural history of diseases and how to quantify their impact on populations. The assignment covers questions from chapters 4 and 6, including calculations and interpretations related to survival probabilities and mortality rates.
Document Page
Running head: STATISTICS
Statistics
Name of the Student:
Name of the University:
Author note:
tabler-icon-diamond-filled.svg

Paraphrase This Document

Need a fresh take? Get an instant paraphrase of this document with our AI Paraphraser
Document Page
1
STATISTICS
Table of Contents
CHAPTER 4...............................................................................................................................2
Answer to the question 1........................................................................................................2
Answer to the question 2........................................................................................................2
Answer to the question 3........................................................................................................2
Answer to the question 4........................................................................................................2
Answer to the question 5........................................................................................................2
Answer to the question 6........................................................................................................3
Answer to the question 7........................................................................................................3
Answer to the question 8........................................................................................................3
Answer to the question 9........................................................................................................3
Answer to the question 10......................................................................................................3
Answer to the question 11......................................................................................................4
Answer to the question 12......................................................................................................4
CHAPTER 6...............................................................................................................................4
Answer to the question 1........................................................................................................4
Answer to the question 2........................................................................................................5
Answer to the question 3........................................................................................................5
Answer to the question 4........................................................................................................5
Answer to the question 5........................................................................................................5
Answer to the question 6........................................................................................................5
Answer to the question 7........................................................................................................5
Document Page
2
STATISTICS
Answer to the question 8........................................................................................................6
Bibliography...............................................................................................................................7
CHAPTER 4
Answer to the question 1
Document Page
3
STATISTICS
The cause specific mortality rate= Number of death¿ cholera2016 ¿
Total population
× 1000
= 30,000
6 00 0 , 000 × 1000
= 5 per thousand
Answer to the question 2
The case fatality from cholera = Number of person dying during 2016 after diagnosis
Number of personwith choleradisease × 100
= 30,000
100,000 × 100
= 30 percent
Answer to the question 3
Age- adjusted death rate are used to eliminate the effects of differences in the age
distributions of populations in comparing death rates.
Answer to the question 4
The mortality rate from disease X in city A is 75/100000 in persons 65 to 69 years
old. The mortality rate from the same disease in City B is 150/100000 in persons 65 to 69
years old. The inference that the disease X is two times more prevalent in persons 65 to 69
years old in city B than it is in persons 65 to 69 years old in city A. Hence the option (a)
correct.
Answer to the question 5
The incidence rate of a disease is five times greater in women than in men, but the
prevalence rate show no sex difference. The best explanation is the crude all-cause mortality
rate is greater than women.
tabler-icon-diamond-filled.svg

Paraphrase This Document

Need a fresh take? Get an instant paraphrase of this document with our AI Paraphraser
Document Page
4
STATISTICS
Answer to the question 6
For a disease such as pancreatic cancer, which is highly fatal and of short duration.
The option is none of the above. Because includes only those population who already have
disease. Which is not related to incidence rate.
Answer to the question 7
Given that
Observed number of death per year = 4500
Expected number of death per year = 1800
Standardized mortality ratio = Observed number of death per year
Expected number of death per year ×100
= 4500
1800 ×100
= 250
Answer to the question 8
It is concluded that the workers in industry B are at higher risk of death from
respiratory system cancer than workers in industry A. The conclusion is incorrect because the
proportionate mortality was used when cause specific mortality rates were needed.
Answer to the question 9
The purpose of this study is Disability-adjusted life-years.
Answer to the question 10
(d) The rate of death from lung cancer in carpenters in 1968-1979 was greater than
would have expected for a group of men of similar ages in all occupations.
Document Page
5
STATISTICS
Answer to the question 11
Hence the age adjusted death rate = 258.48886/ 27000
= 0.0095
Answer to the question 12
The proportionate mortality from disease Z for community Y is none of the above.
CHAPTER 6
Answer to the question 1
The probability of surviving for 1st year is P1= 152/180
= 0.84
= 84%
The probability of surviving for 2nd year is P2= 87/ (152-37)
= 87/ 115
= 0.756
=76%
The probability of surviving for 3rd year is P3= 48/ (87-31)
= 0.857
= 86%
Document Page
6
STATISTICS
Hence the probability of surviving for 3 years is P1* P2* P3
=0.84*0.756*0.857
= 0.547
= 54.7%
Answer to the question 2
An important assumption of this analysis is no change has occurred in the
effectiveness of the treatment during the period of the study.
Answer to the question 3
The case fatality is a good index of the severity of a short-term, acute disease.
Answer to the question 4
The following is most likely to happen to the disease is the apparent 5-year survival
will increase.
Answer to the question 5
The relative survival rate is it is generally closer to observed survival in young
populations.
Answer to the question 6
For those people who survived the second year, the probability of dying in the third
year is 0.982 that is 98.2%.
Answer to the question 7
The probability that a person enrolled in the study will survive to the end of the third
year is 0.006 that is 0.6%.
tabler-icon-diamond-filled.svg

Paraphrase This Document

Need a fresh take? Get an instant paraphrase of this document with our AI Paraphraser
Document Page
7
STATISTICS
Answer to the question 8
Before reporting the results of this survival analysis, the investigators compared the
baseline characteristics of the 42 persons who w1thdrew from the study before its end with
those of the participants who had complete follow-up is to check whether those who
remained in the study represent the total study population.
Document Page
8
STATISTICS
Bibliography
De Schutter, A., Lavie, C. J., & Milani, R. V. (2014). The impact of obesity on risk factors
and prevalence and prognosis of coronary heart disease—the obesity paradox.
Progress in cardiovascular diseases, 56(4), 401-408.
Hay, R. J., Johns, N. E., Williams, H. C., Bolliger, I. W., Dellavalle, R. P., Margolis, D. J., ...
& Michaud, C. (2014). The global burden of skin disease in 2010: an analysis of the
prevalence and impact of skin conditions. Journal of Investigative Dermatology,
134(6), 1527-1534.
Herbst, R. S., Soria, J. C., Kowanetz, M., Fine, G. D., Hamid, O., Gordon, M. S., ... & Kohrt,
H. E. (2014). Predictive correlates of response to the anti-PD-L1 antibody
MPDL3280A in cancer patients. Nature, 515(7528), 563-567.
McConkey, D. J., Choi, W., Shen, Y., Lee, I. L., Porten, S., Matin, S. F., ... & Czerniak, B.
(2016). A prognostic gene expression signature in the molecular classification of
chemotherapy-naive urothelial cancer is predictive of clinical outcomes from
neoadjuvant chemotherapy: a phase 2 trial of dose-dense methotrexate, vinblastine,
doxorubicin, and cisplatin with bevacizumab in urothelial cancer. European urology,
69(5), 855-862.
Document Page
9
STATISTICS
chevron_up_icon
1 out of 10
circle_padding
hide_on_mobile
zoom_out_icon
[object Object]