Decision Modelling for Business Analytics: Mortgage Loan (MIS775)
VerifiedAdded on 2023/06/14
|17
|1474
|255
Report
AI Summary
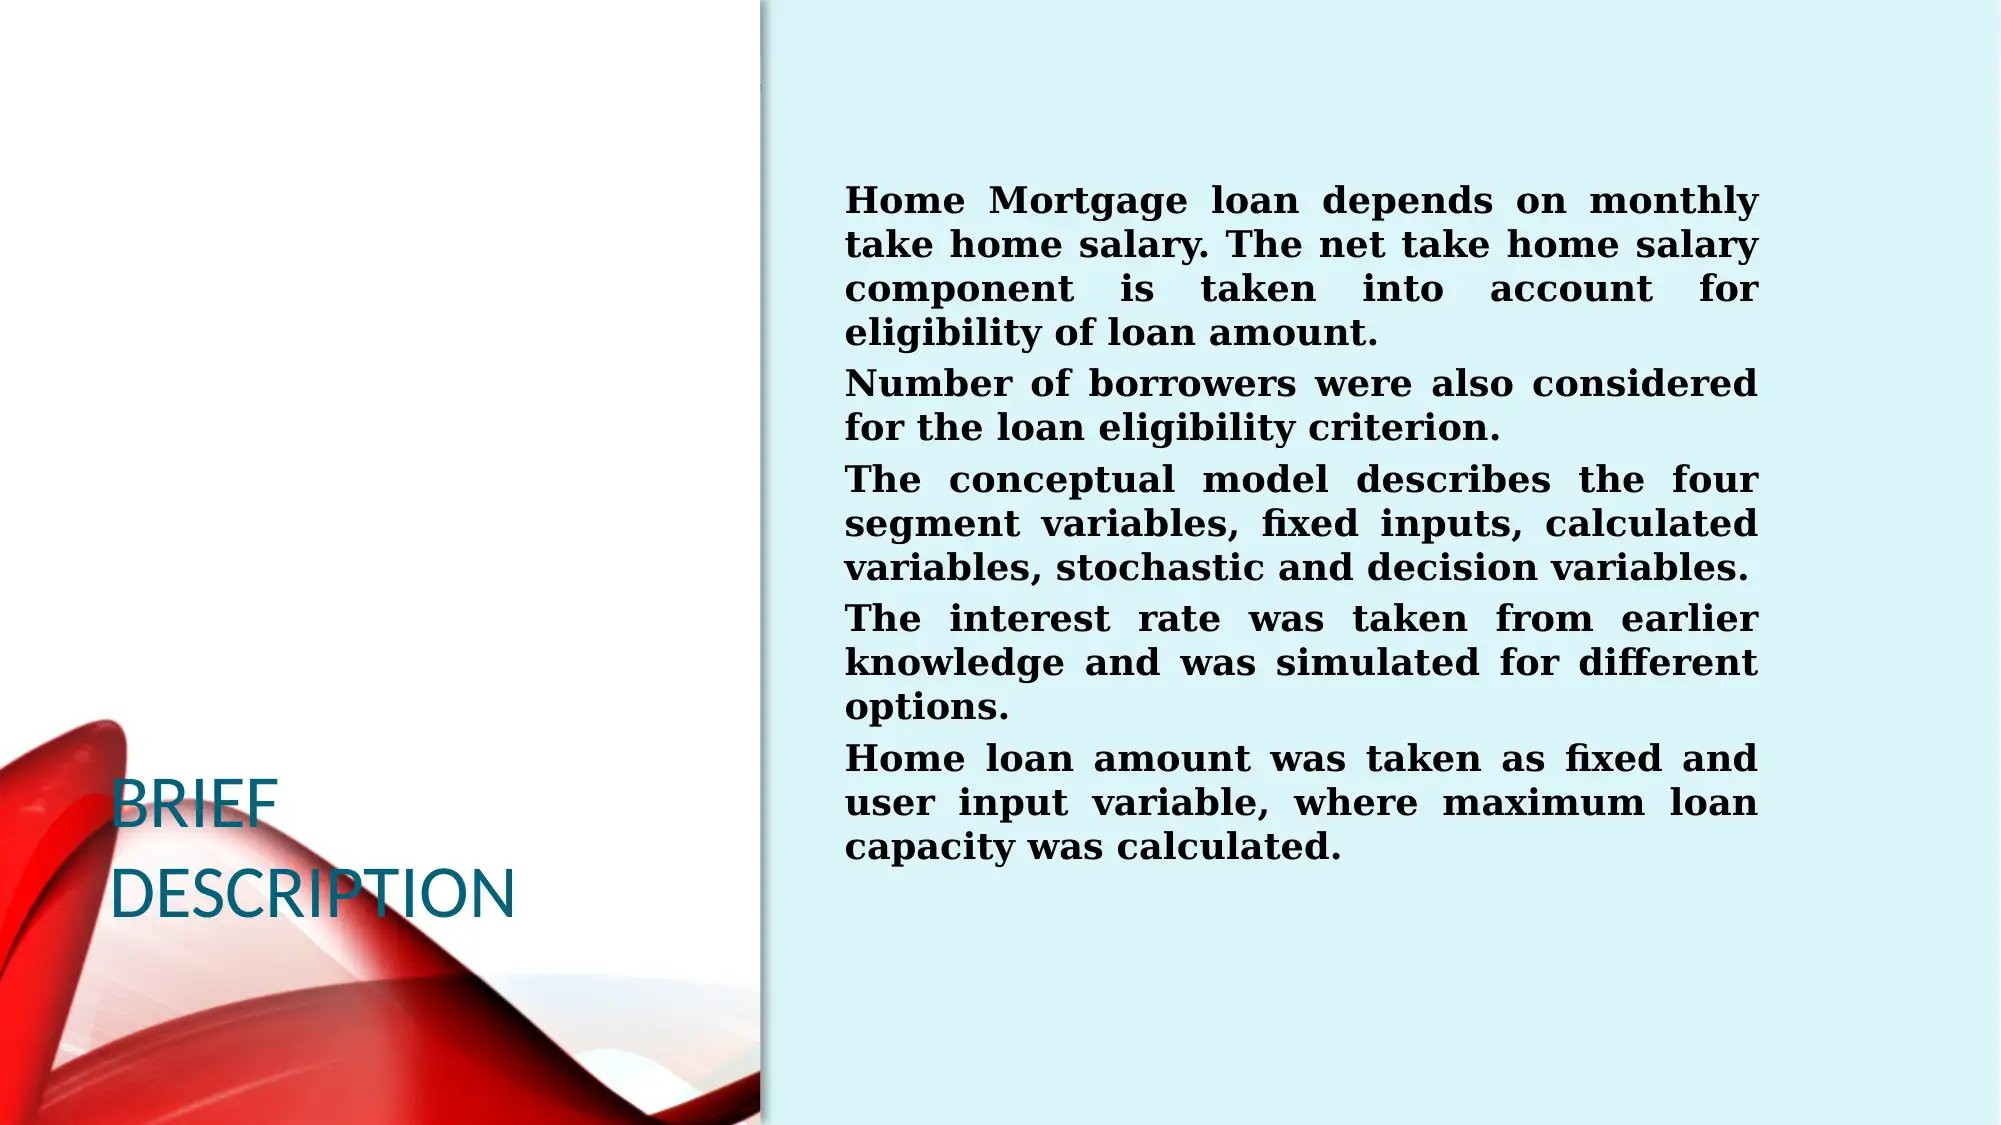
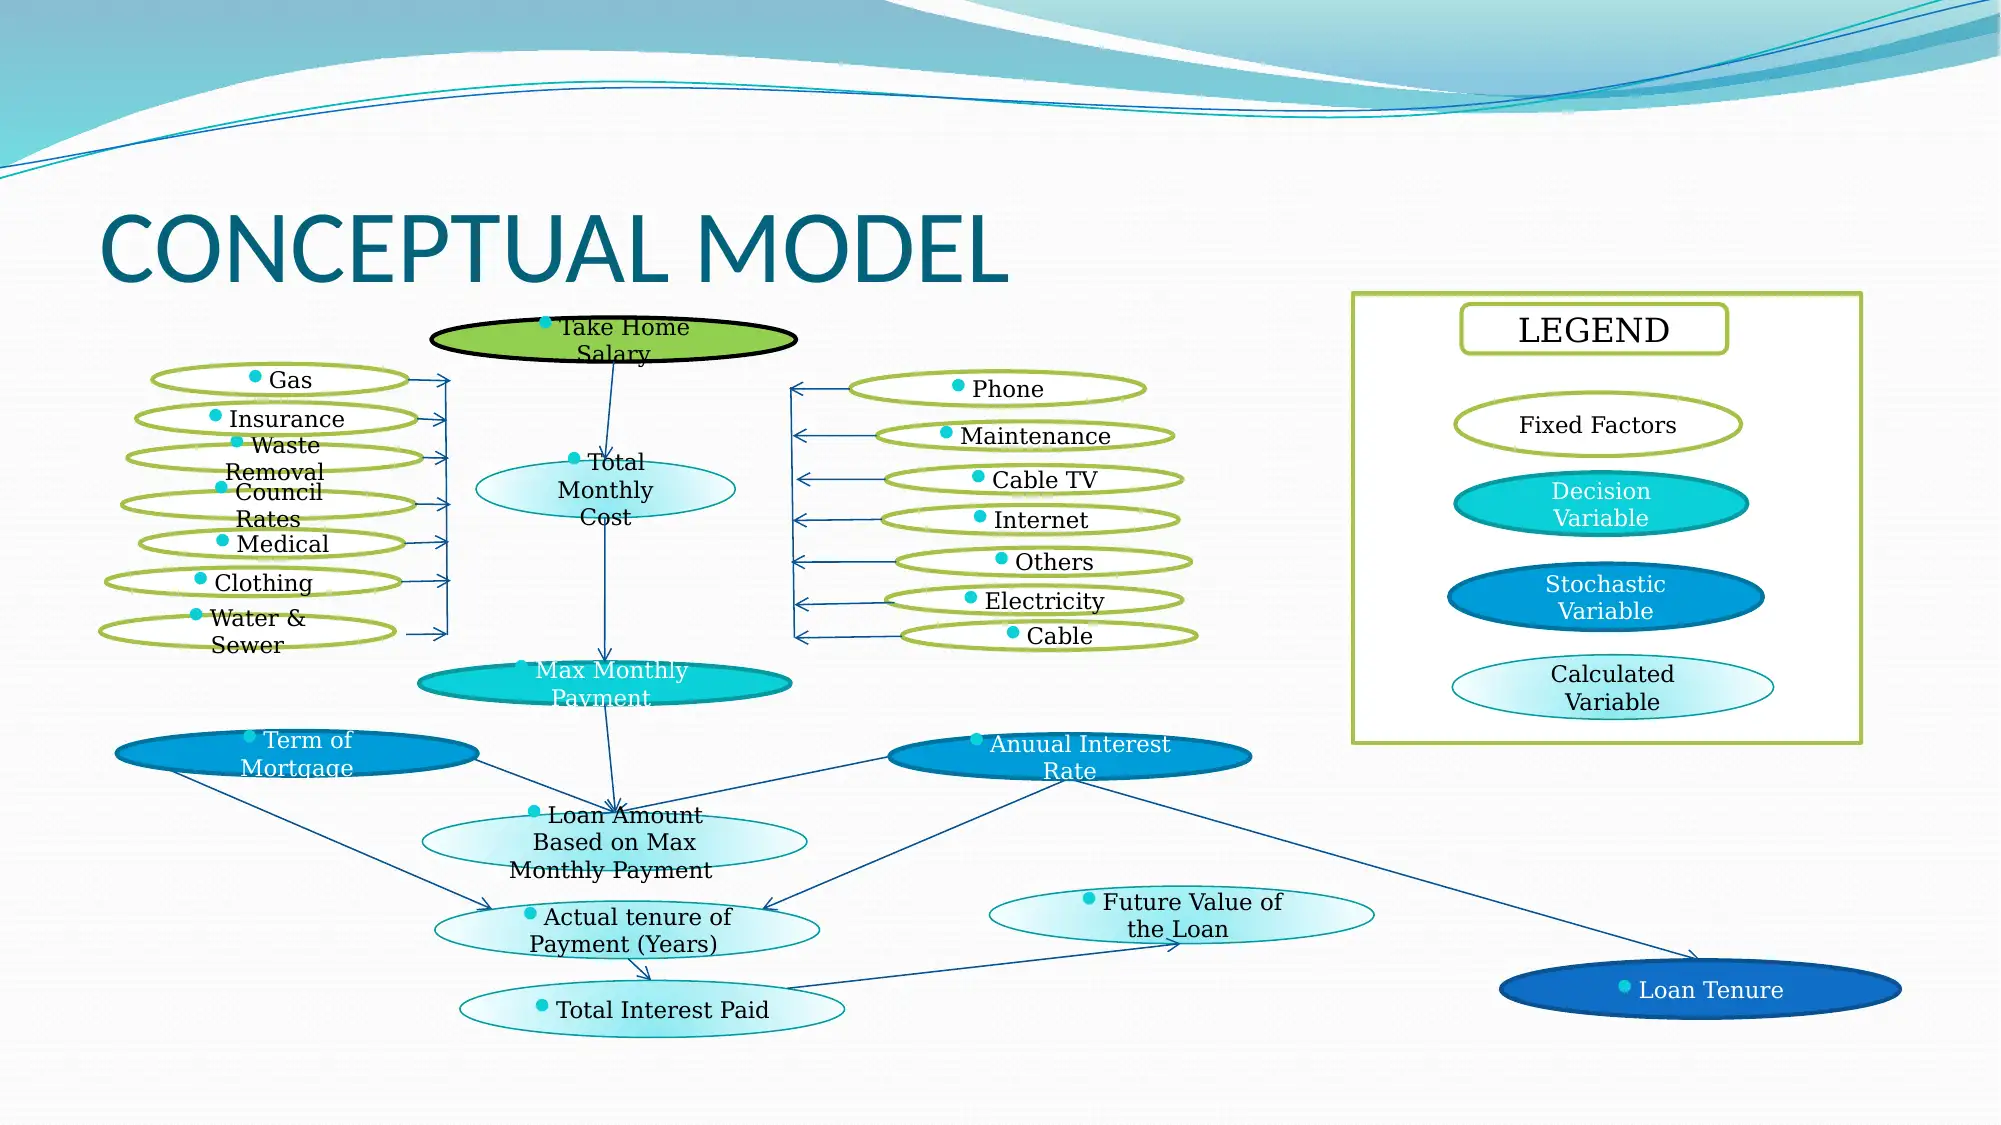
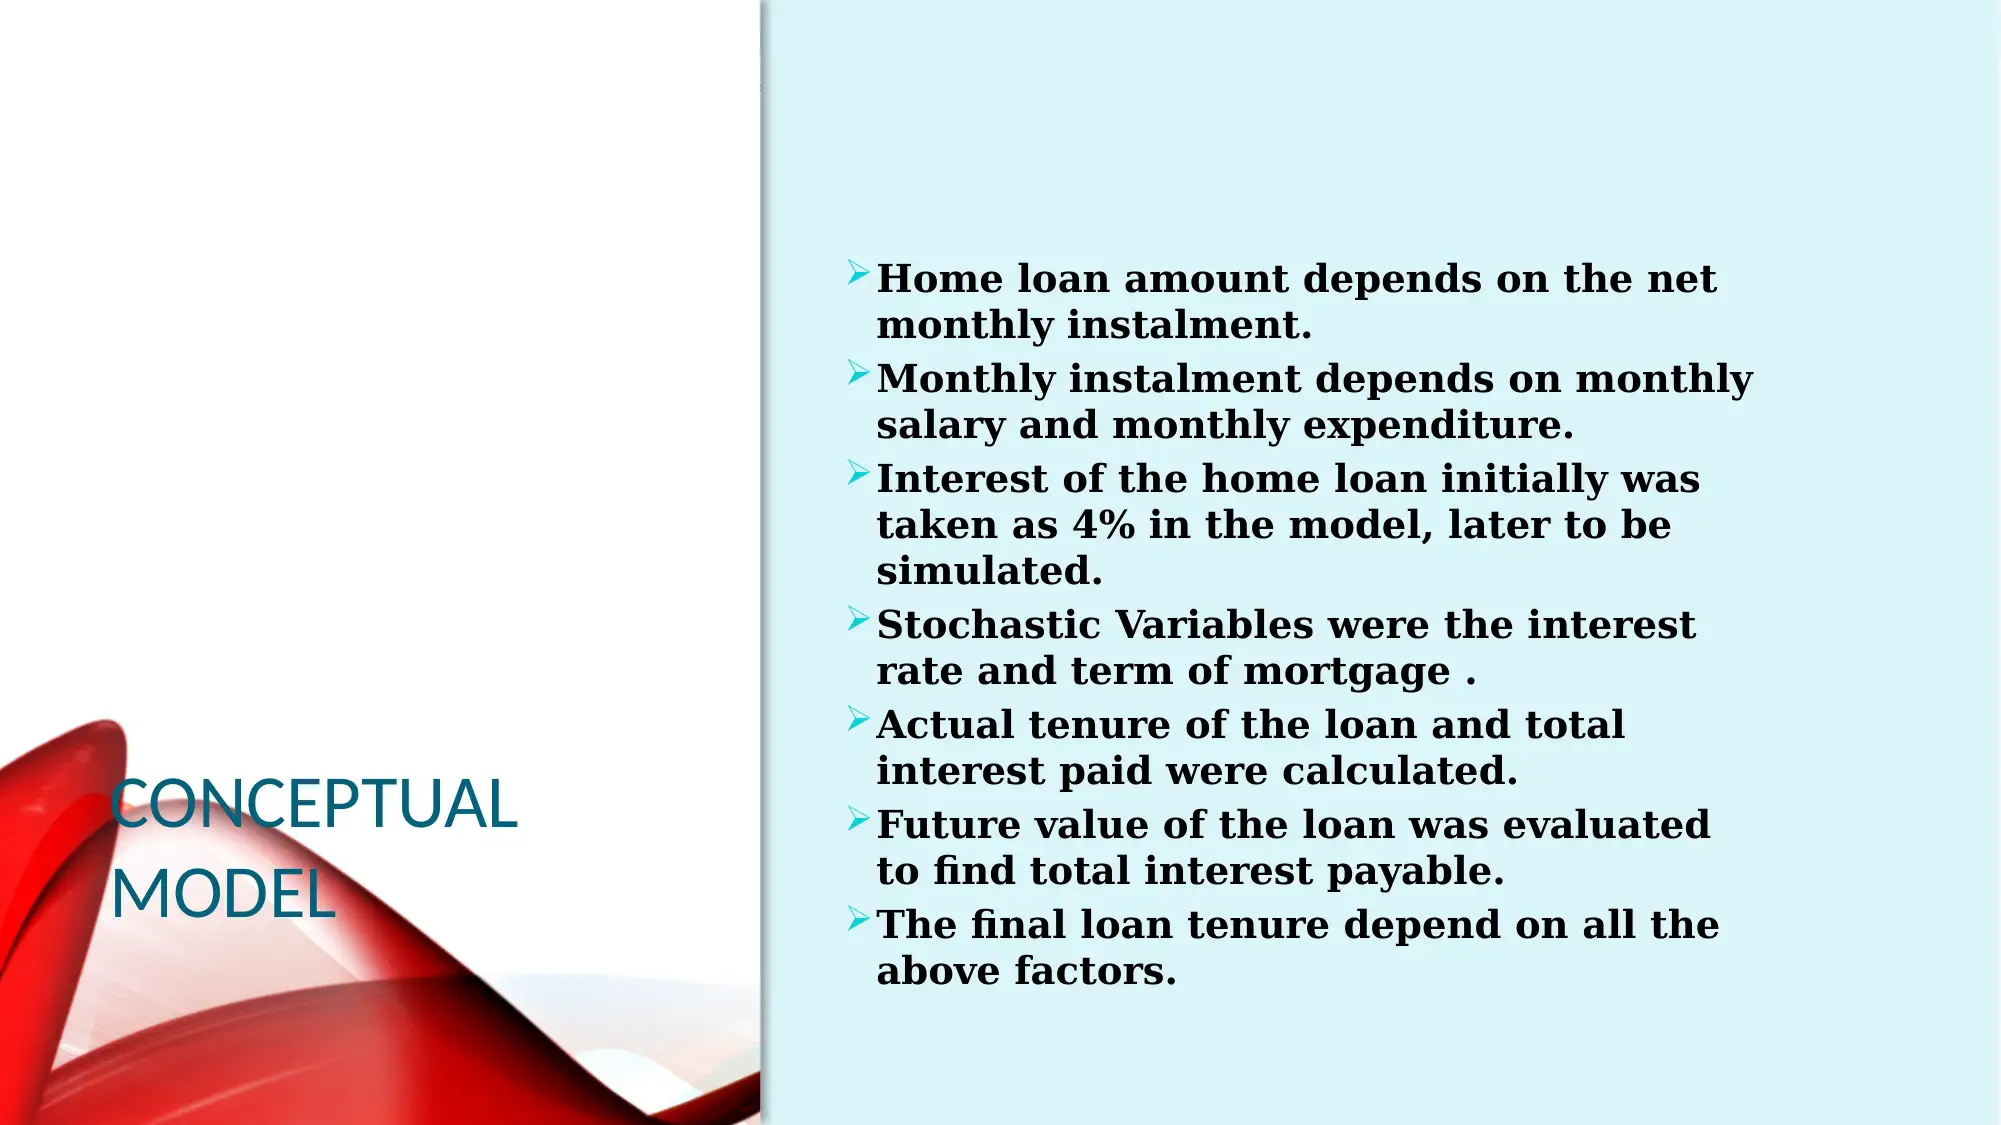
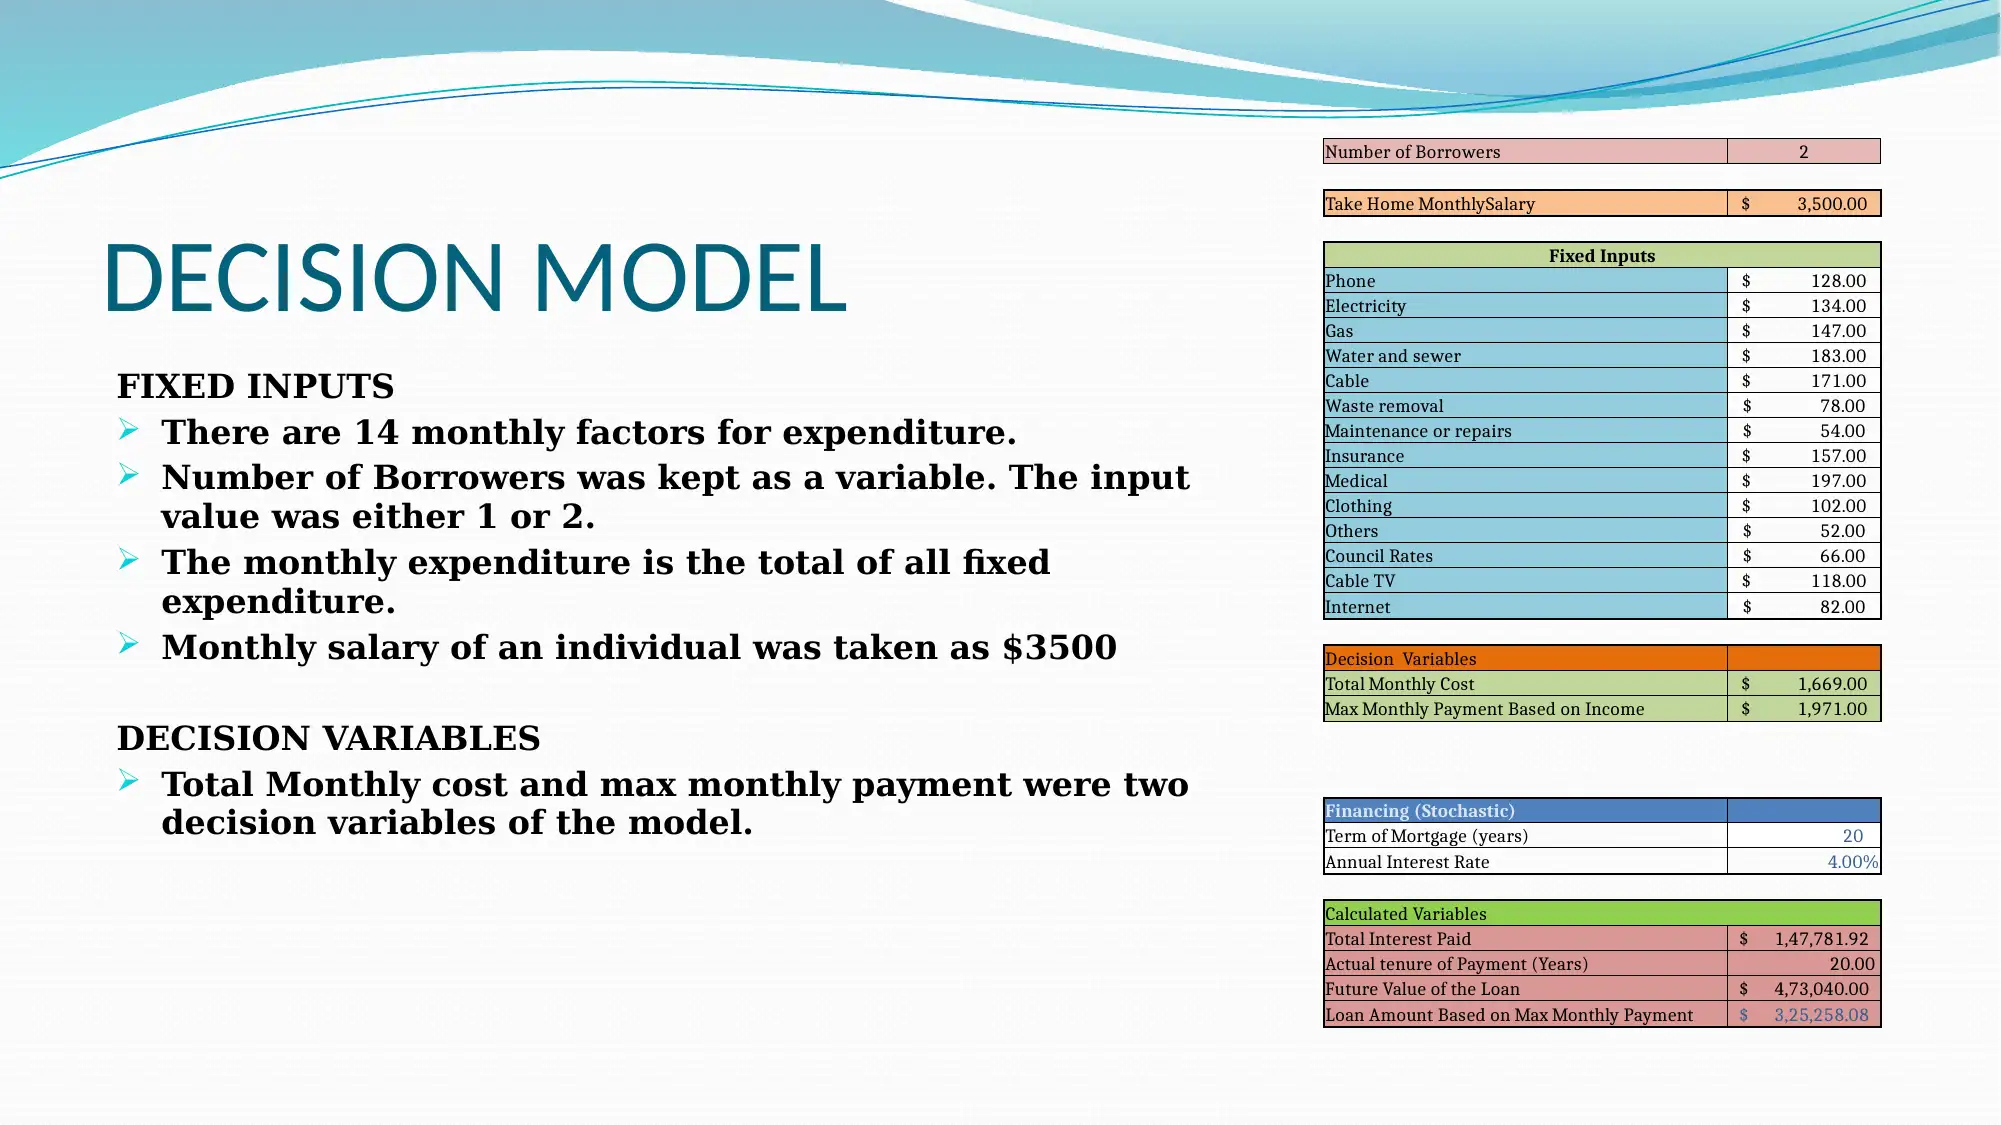
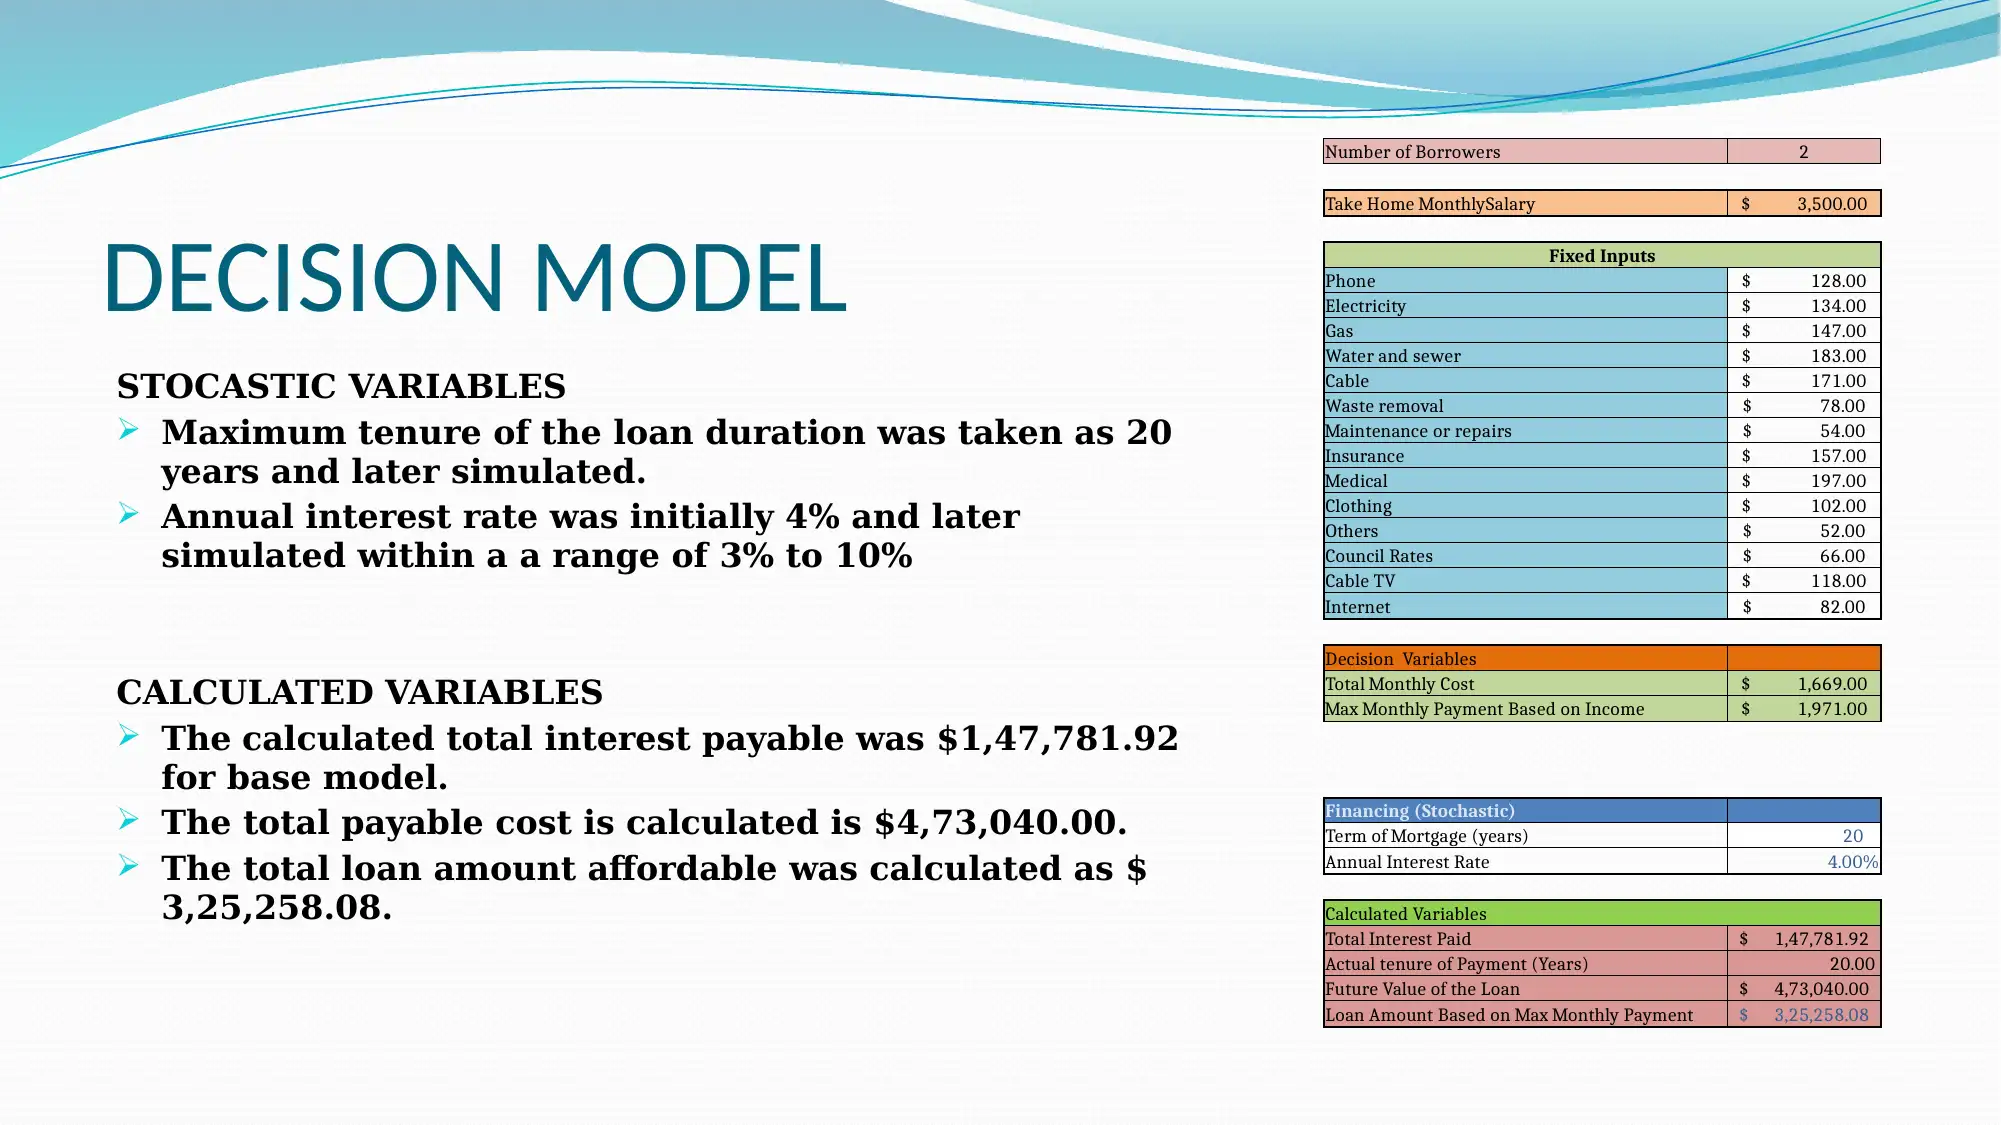
This report presents a decision model for analyzing mortgage loan decisions within a business analytics context. The model incorporates fixed inputs like monthly expenses, stochastic variables such as interest rates and loan terms, and decision variables including total monthly cost and maximum monthly payment. Scenario analysis explores the impact of changes in salary, monthly costs, and interest rates on loan affordability and tenure. Sensitivity analysis identifies key risk factors, primarily monthly costs and interest rates, affecting loan eligibility and monthly payments. The report concludes with recommendations such as increasing the number of borrowers, reducing monthly costs, and taking advantage of lower interest rates to improve loan terms. This assignment is available on Desklib, a platform offering study tools for students.

DECISION MODELLING FOR
BUSINESS ANALYTICS
DECISION MODELS FOR BUSINESS ANALYTICS
MIS775 (TRIMESTER 1, 2018)
PREPARED BY-(GROUP )
BUSINESS ANALYTICS
DECISION MODELS FOR BUSINESS ANALYTICS
MIS775 (TRIMESTER 1, 2018)
PREPARED BY-(GROUP )
Paraphrase This Document
Need a fresh take? Get an instant paraphrase of this document with our AI Paraphraser

TABLE OF CONTENTS
Description of the base model
Bubble diagram and assumptions of the base model
Decision Model
Scenario Analysis
Sensitivity Analysis
Risk Analysis
Output summary
Recommendations
Description of the base model
Bubble diagram and assumptions of the base model
Decision Model
Scenario Analysis
Sensitivity Analysis
Risk Analysis
Output summary
Recommendations

BRIEF
DESCRIPTION
Home Mortgage loan depends on monthly
take home salary. The net take home salary
component is taken into account for
eligibility of loan amount.
Number of borrowers were also considered
for the loan eligibility criterion.
The conceptual model describes the four
segment variables, fixed inputs, calculated
variables, stochastic and decision variables.
The interest rate was taken from earlier
knowledge and was simulated for different
options.
Home loan amount was taken as fixed and
user input variable, where maximum loan
capacity was calculated.
⊘ This is a preview!⊘
Do you want full access?
Subscribe today to unlock all pages.

Trusted by 1+ million students worldwide

CONCEPTUAL MODEL
Gas
MaintenanceWaste
Removal
Cable
Phone
Electricity
Insurance
Council
Rates
Medical
Clothing
Cable TV
Internet
Others
Max Monthly
Payment
Loan Tenure
Total Interest Paid
Actual tenure of
Payment (Years)
Loan Amount
Based on Max
Monthly Payment
Future Value of
the Loan
Take Home
Salary
Total
Monthly
Cost
Anuual Interest
Rate
Term of
Mortgage
Water &
Sewer
Fixed Factors
Decision
Variable
Stochastic
Variable
Calculated
Variable
LEGEND
Paraphrase This Document
Need a fresh take? Get an instant paraphrase of this document with our AI Paraphraser

CONCEPTUAL
MODEL
Home loan amount depends on the net
monthly instalment.
Monthly instalment depends on monthly
salary and monthly expenditure.
Interest of the home loan initially was
taken as 4% in the model, later to be
simulated.
Stochastic Variables were the interest
rate and term of mortgage .
Actual tenure of the loan and total
interest paid were calculated.
Future value of the loan was evaluated
to find total interest payable.
The final loan tenure depend on all the
above factors.

DECISION MODEL
FIXED INPUTS
There are 14 monthly factors for expenditure.
Number of Borrowers was kept as a variable. The input
value was either 1 or 2.
The monthly expenditure is the total of all fixed
expenditure.
Monthly salary of an individual was taken as $3500
DECISION VARIABLES
Total Monthly cost and max monthly payment were two
decision variables of the model.
Number of Borrowers 2
Take Home MonthlySalary $ 3,500.00
Fixed Inputs
Phone $ 128.00
Electricity $ 134.00
Gas $ 147.00
Water and sewer $ 183.00
Cable $ 171.00
Waste removal $ 78.00
Maintenance or repairs $ 54.00
Insurance $ 157.00
Medical $ 197.00
Clothing $ 102.00
Others $ 52.00
Council Rates $ 66.00
Cable TV $ 118.00
Internet $ 82.00
Decision Variables
Total Monthly Cost $ 1,669.00
Max Monthly Payment Based on Income $ 1,971.00
Financing (Stochastic)
Term of Mortgage (years) 20
Annual Interest Rate 4.00%
Calculated Variables
Total Interest Paid $ 1,47,781.92
Actual tenure of Payment (Years) 20.00
Future Value of the Loan $ 4,73,040.00
Loan Amount Based on Max Monthly Payment $ 3,25,258.08
⊘ This is a preview!⊘
Do you want full access?
Subscribe today to unlock all pages.

Trusted by 1+ million students worldwide

DECISION MODEL
STOCASTIC VARIABLES
Maximum tenure of the loan duration was taken as 20
years and later simulated.
Annual interest rate was initially 4% and later
simulated within a a range of 3% to 10%
CALCULATED VARIABLES
The calculated total interest payable was $1,47,781.92
for base model.
The total payable cost is calculated is $4,73,040.00.
The total loan amount affordable was calculated as $
3,25,258.08.
Number of Borrowers 2
Take Home MonthlySalary $ 3,500.00
Fixed Inputs
Phone $ 128.00
Electricity $ 134.00
Gas $ 147.00
Water and sewer $ 183.00
Cable $ 171.00
Waste removal $ 78.00
Maintenance or repairs $ 54.00
Insurance $ 157.00
Medical $ 197.00
Clothing $ 102.00
Others $ 52.00
Council Rates $ 66.00
Cable TV $ 118.00
Internet $ 82.00
Decision Variables
Total Monthly Cost $ 1,669.00
Max Monthly Payment Based on Income $ 1,971.00
Financing (Stochastic)
Term of Mortgage (years) 20
Annual Interest Rate 4.00%
Calculated Variables
Total Interest Paid $ 1,47,781.92
Actual tenure of Payment (Years) 20.00
Future Value of the Loan $ 4,73,040.00
Loan Amount Based on Max Monthly Payment $ 3,25,258.08
Paraphrase This Document
Need a fresh take? Get an instant paraphrase of this document with our AI Paraphraser

FREQUENCY
DISTRIBUTION
MEAN : 7.36%
MODE : 8.00%
MINIMUM : 4.0%
MAXIMUM : 10.0%
1.00%
1.50%
2.00%
2.50%
3.00%
3.50%
4.00%
4.50%
5.00%
5.50%
6.00%
6.50%
7.00%
7.50%
8.00%
8.50%
9.00%
9.50%
10.00%
0
2
4
6
8
10
12
14
Frequency Distribution of Interest Rate
Freq
DISTRIBUTION
MEAN : 7.36%
MODE : 8.00%
MINIMUM : 4.0%
MAXIMUM : 10.0%
1.00%
1.50%
2.00%
2.50%
3.00%
3.50%
4.00%
4.50%
5.00%
5.50%
6.00%
6.50%
7.00%
7.50%
8.00%
8.50%
9.00%
9.50%
10.00%
0
2
4
6
8
10
12
14
Frequency Distribution of Interest Rate
Freq

FREQUENCY
DISTRIBUTION
Normal distribution was chosen as the probability
distribution model.
The expected frequency numbers were calculated for
interest loan rate distribution, and the chi test value is
calculated.
Interest is a continuous data and hence normal
distribution is used for the frequency distribution.
The results pointed out some outlier values for interest
movement.
Market volatility was the probable reason for this.
By observing the above frequency distribution graph, it
is concluded that interest movement rate was almost
normal with some outlier values.
1.00%
1.50%
2.00%
2.50%
3.00%
3.50%
4.00%
4.50%
5.00%
5.50%
6.00%
6.50%
7.00%
7.50%
8.00%
8.50%
9.00%
9.50%
10.00%
10.50%
11.00%
0
2
4
6
8
10
12
14
Observed and Expected Interest Rate
Freq Expected Freq
⊘ This is a preview!⊘
Do you want full access?
Subscribe today to unlock all pages.

Trusted by 1+ million students worldwide

BEST AND WORST
CASE SCENARIO
Scenario Summary
Current Values: Scenario 4
Changing Cells:
$B$29 4.00% 5.00%
Result Cells:
$B$33 13.76 15.07
Notes: Current Values column represents values of changing cells at
time Scenario Summary Report was created. Changing cells for each
scenario are highlighted in gray.
Scenario Summary
Current Values: Scenario 1 Scenario 2 Scenario 3
Changing Cells:
$B$3 7506 7506 7506 7506
$B$23 $ 6,191.00 $ 3,500.00 $ 6,191.00 $ 6,191.00
$B$22 $ 1,647.00 $ 1,647.00 $ 2,000.00 $ 1,647.00
$B$29 0.04 0.04 0.04 0.05
Result Cells:
$B$33 20.00 20.00 20.00 20.00
Notes: Current Values column represents values of changing cells at
time Scenario Summary Report was created. Changing cells for each
scenario are highlighted in gray.
Paraphrase This Document
Need a fresh take? Get an instant paraphrase of this document with our AI Paraphraser

Case Scenario
Scenarios
In scenario 1 increase in take home
salary increased the loan affordability
without change in loan tenure.
In scenario 2 increase in monthly cost
is assessed.
In scenario 3 increase in interest rate
without keeping loan amount fixed is
assessed.
The change in interest rate yielded
increased loan tenure. Loan amount
was kept fixed at $2,50,000. For 4%
interest rate the loan tenure was
13.76 years whereas 5% interest
tenure increased to 15.06 years.

SENSITIVITY ANALYSIS
The above sensitivity analysis conducted, shows that if costs of staffing and
the room tariff at the partner hotel are raised, we would experience a drastic
drop in the profits.
The above sensitivity analysis conducted, shows that if costs of staffing and
the room tariff at the partner hotel are raised, we would experience a drastic
drop in the profits.
⊘ This is a preview!⊘
Do you want full access?
Subscribe today to unlock all pages.

Trusted by 1+ million students worldwide
1 out of 17
Related Documents

Your All-in-One AI-Powered Toolkit for Academic Success.
+13062052269
info@desklib.com
Available 24*7 on WhatsApp / Email
Unlock your academic potential
Copyright © 2020–2025 A2Z Services. All Rights Reserved. Developed and managed by ZUCOL.