MPF753 Finance - IPO Market: Initial Returns and Long-Term Performance

Verified

Added on  2023/06/12

|19
|3876
|265
Report
AI Summary
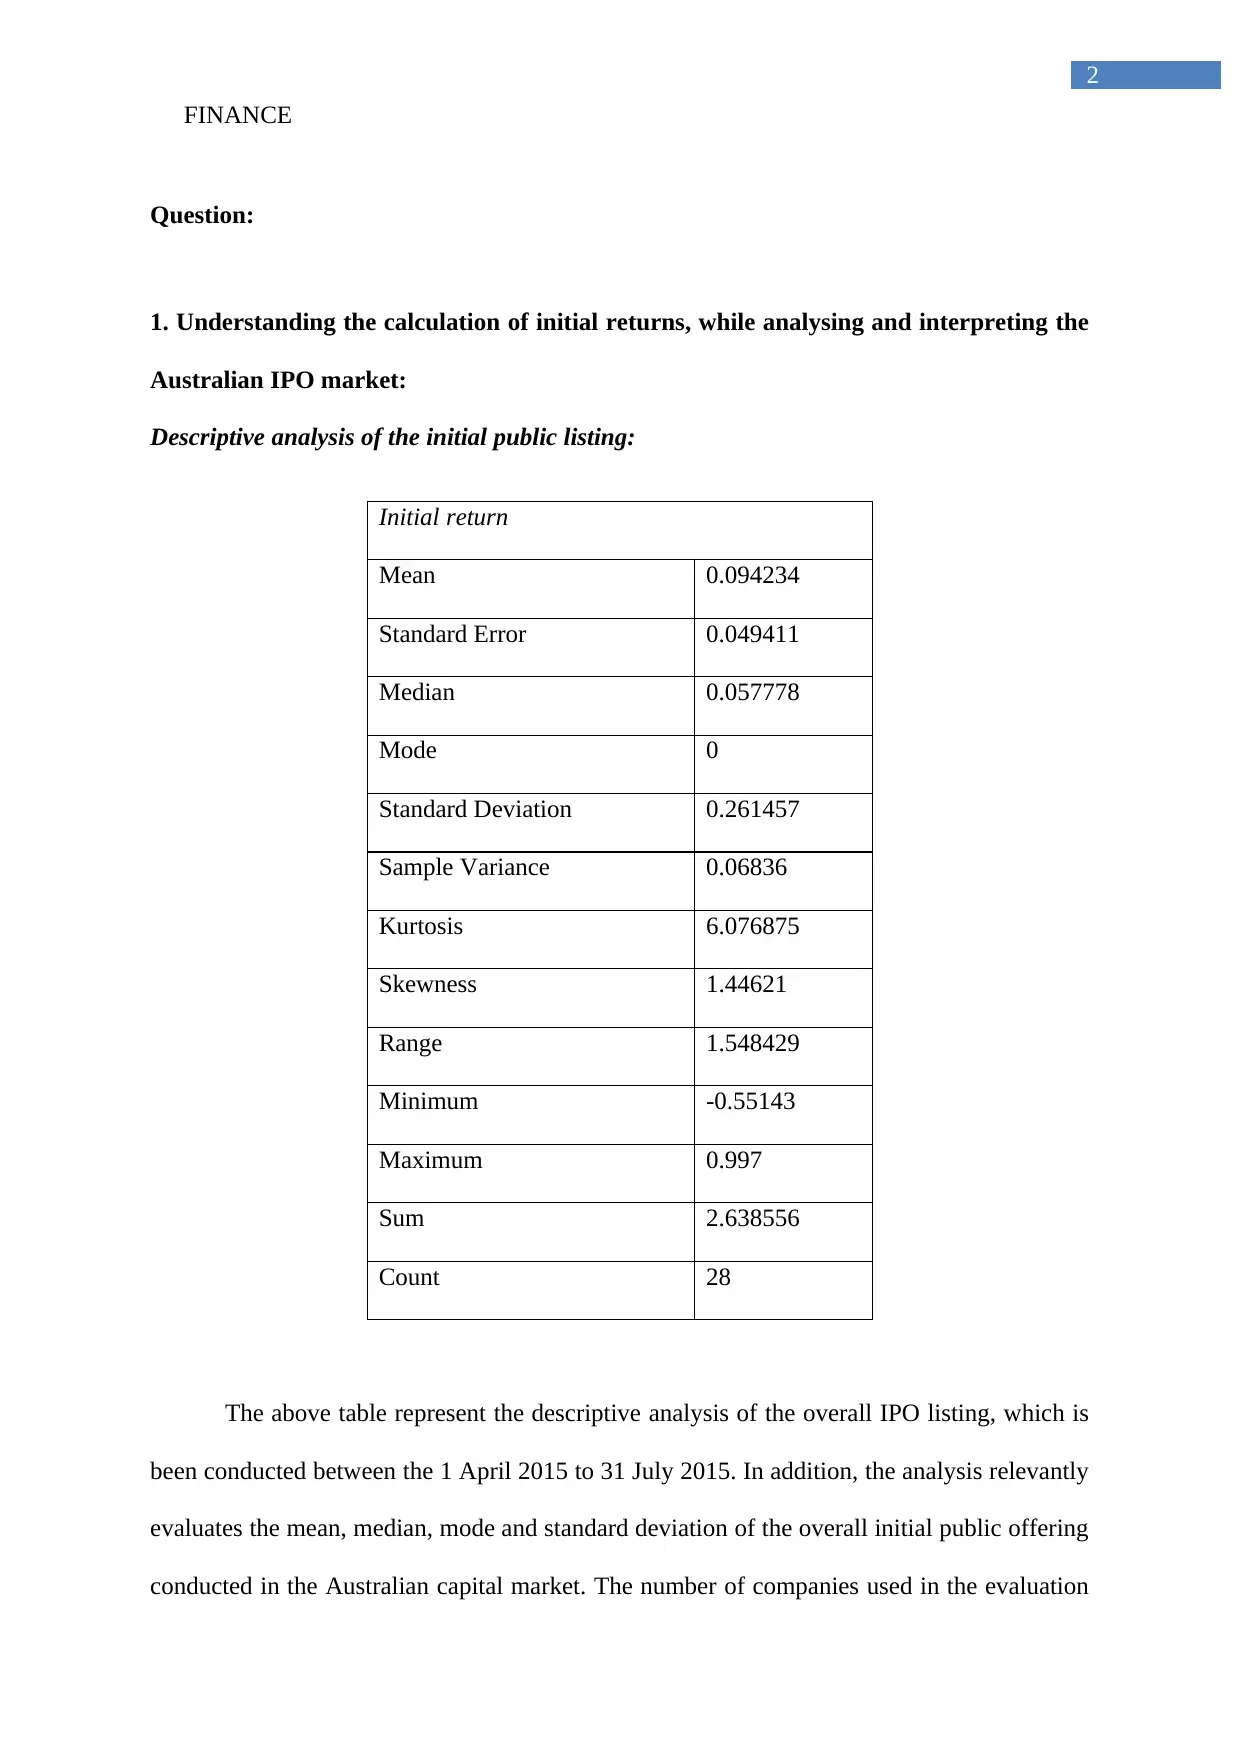
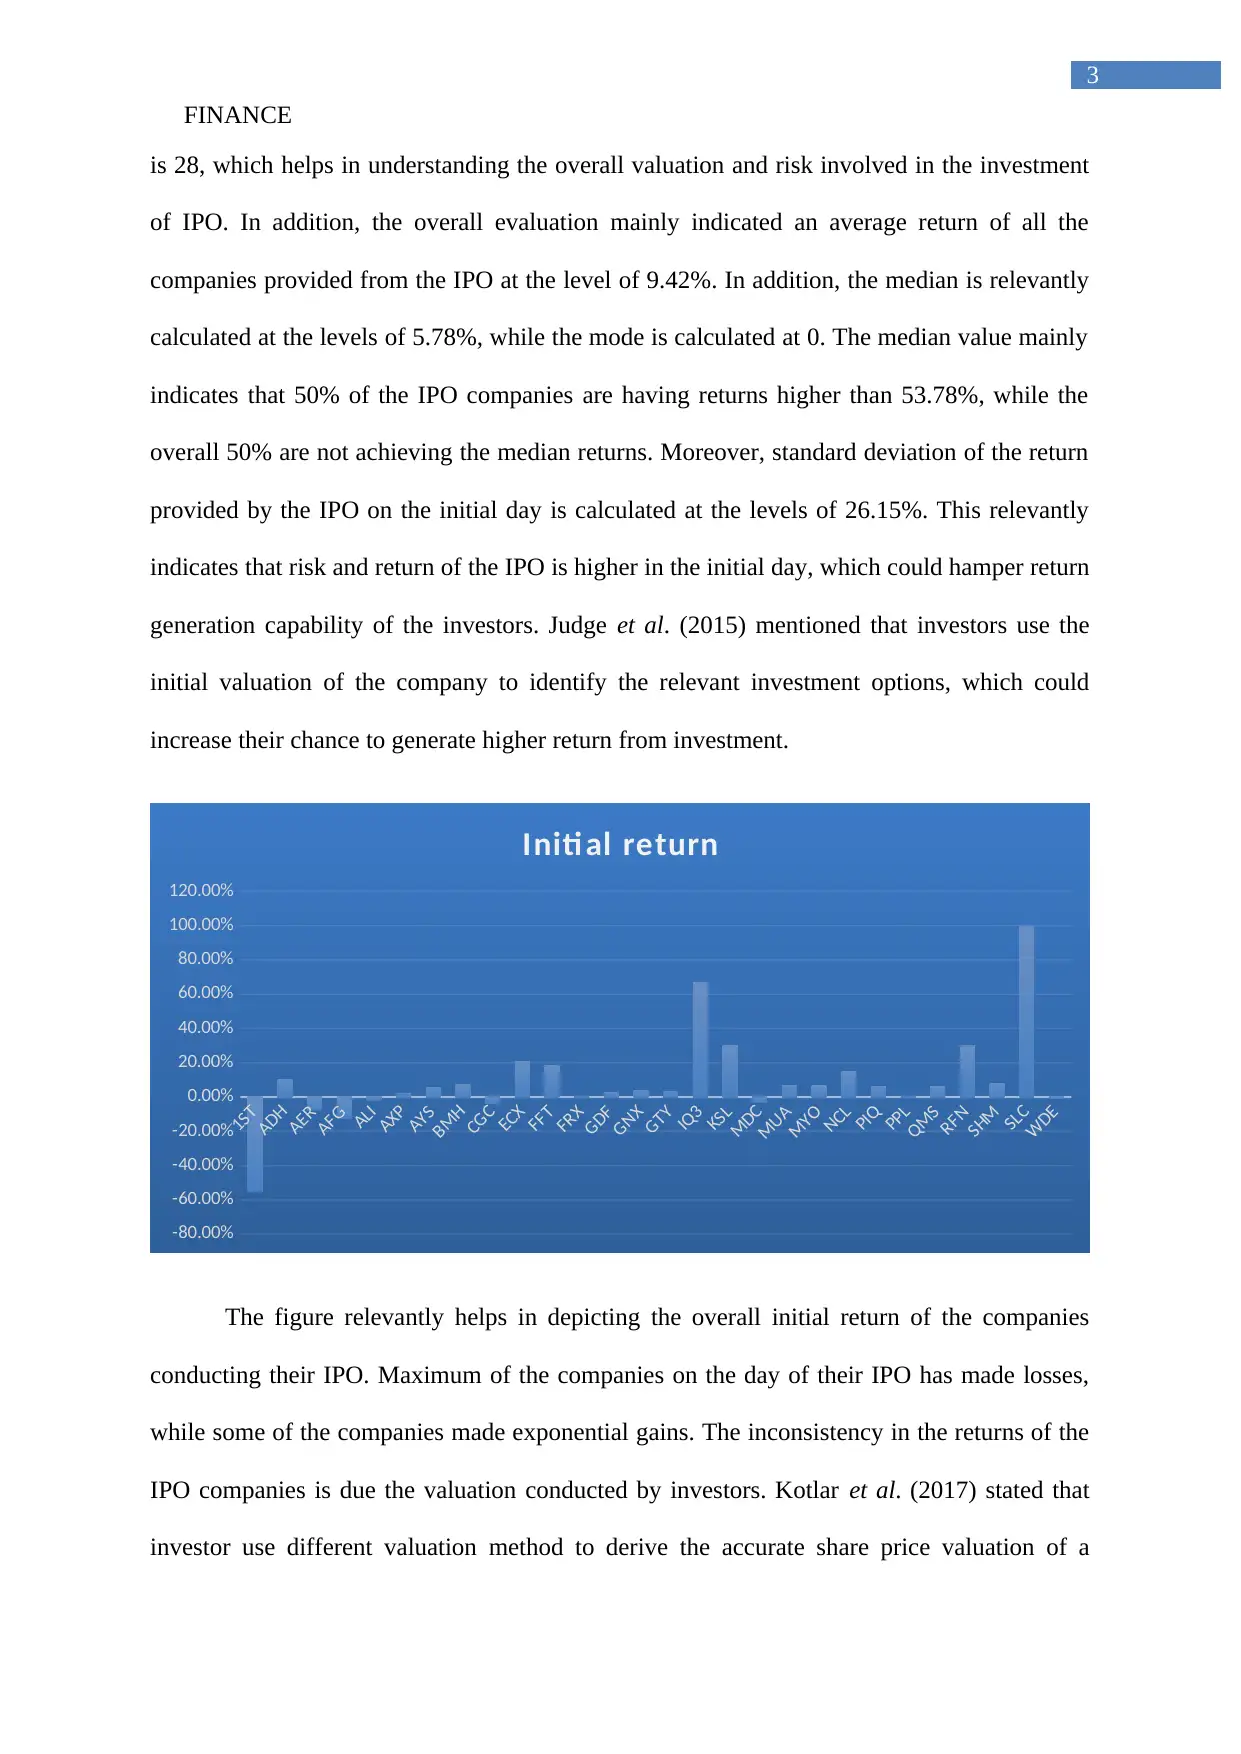
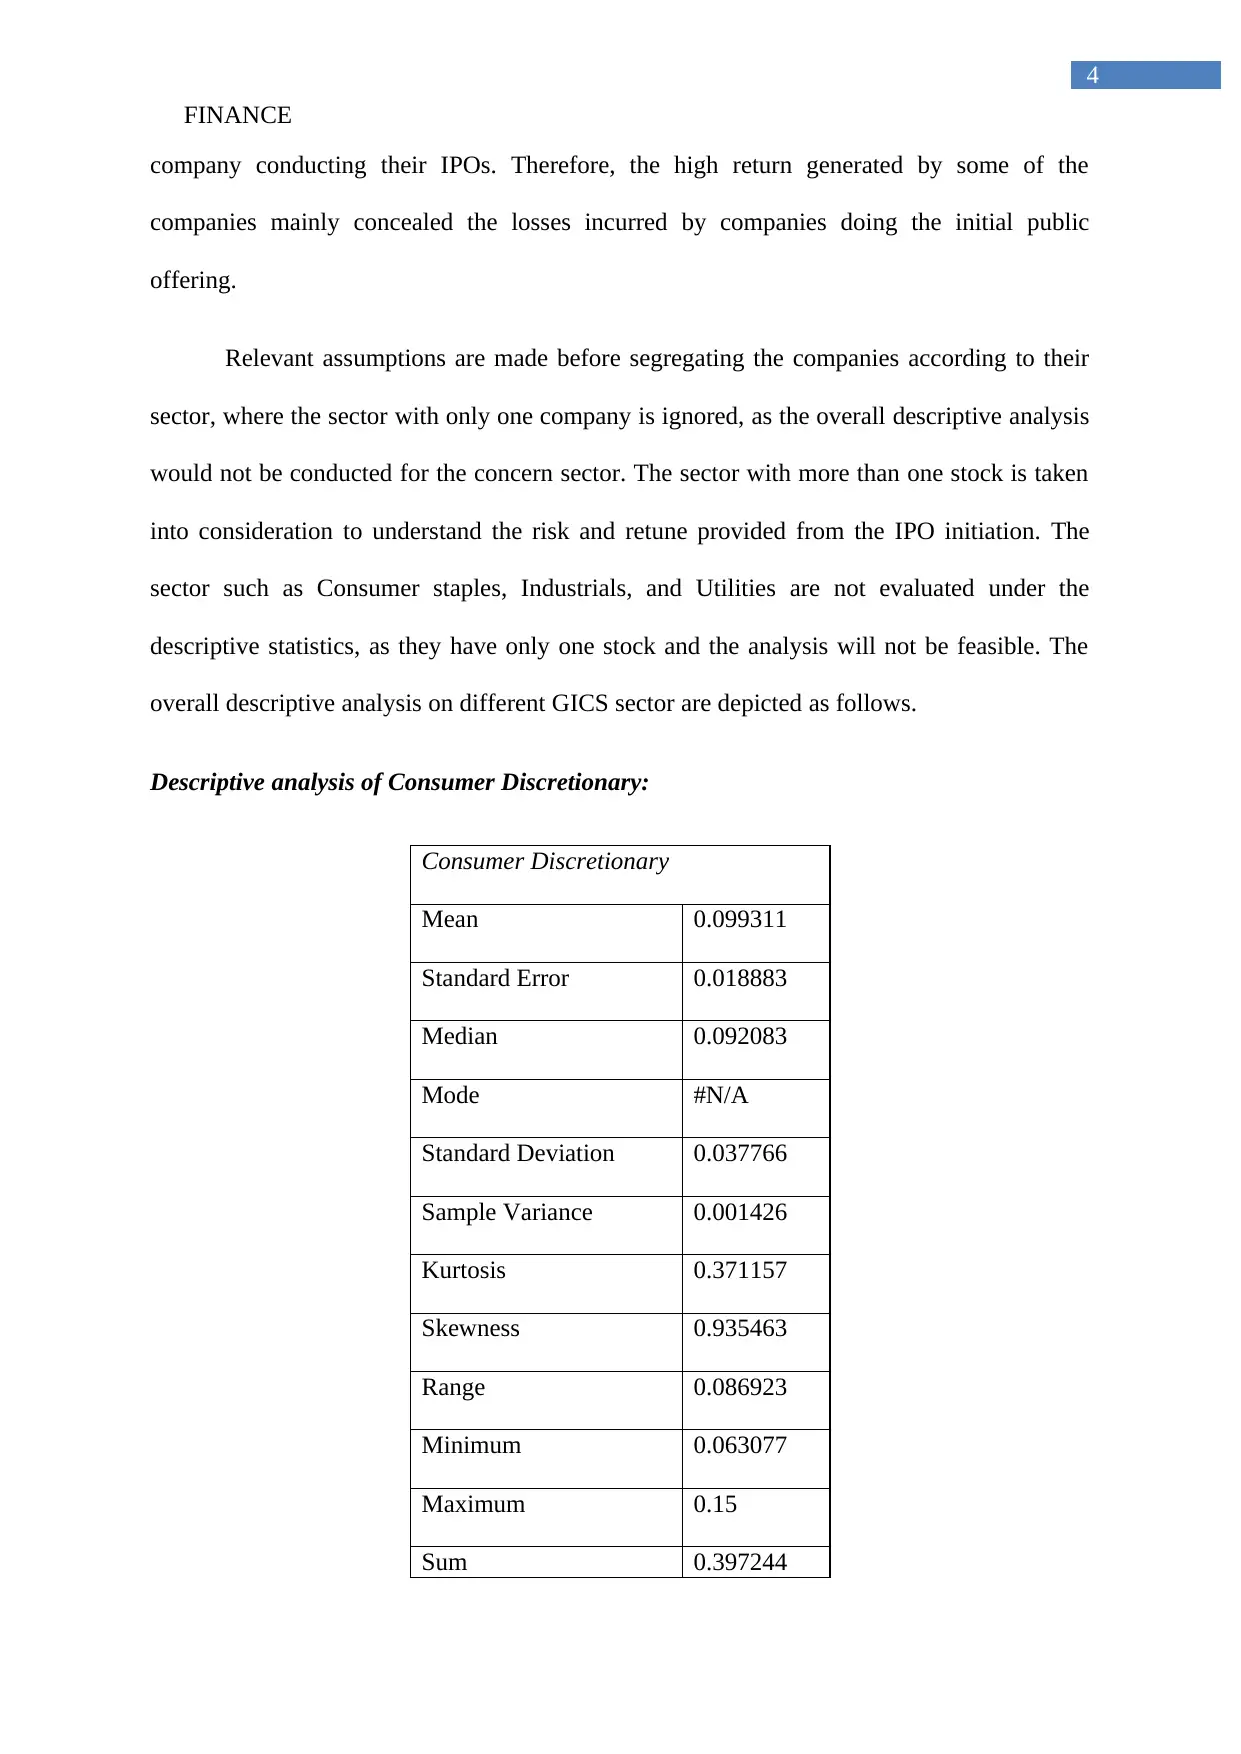
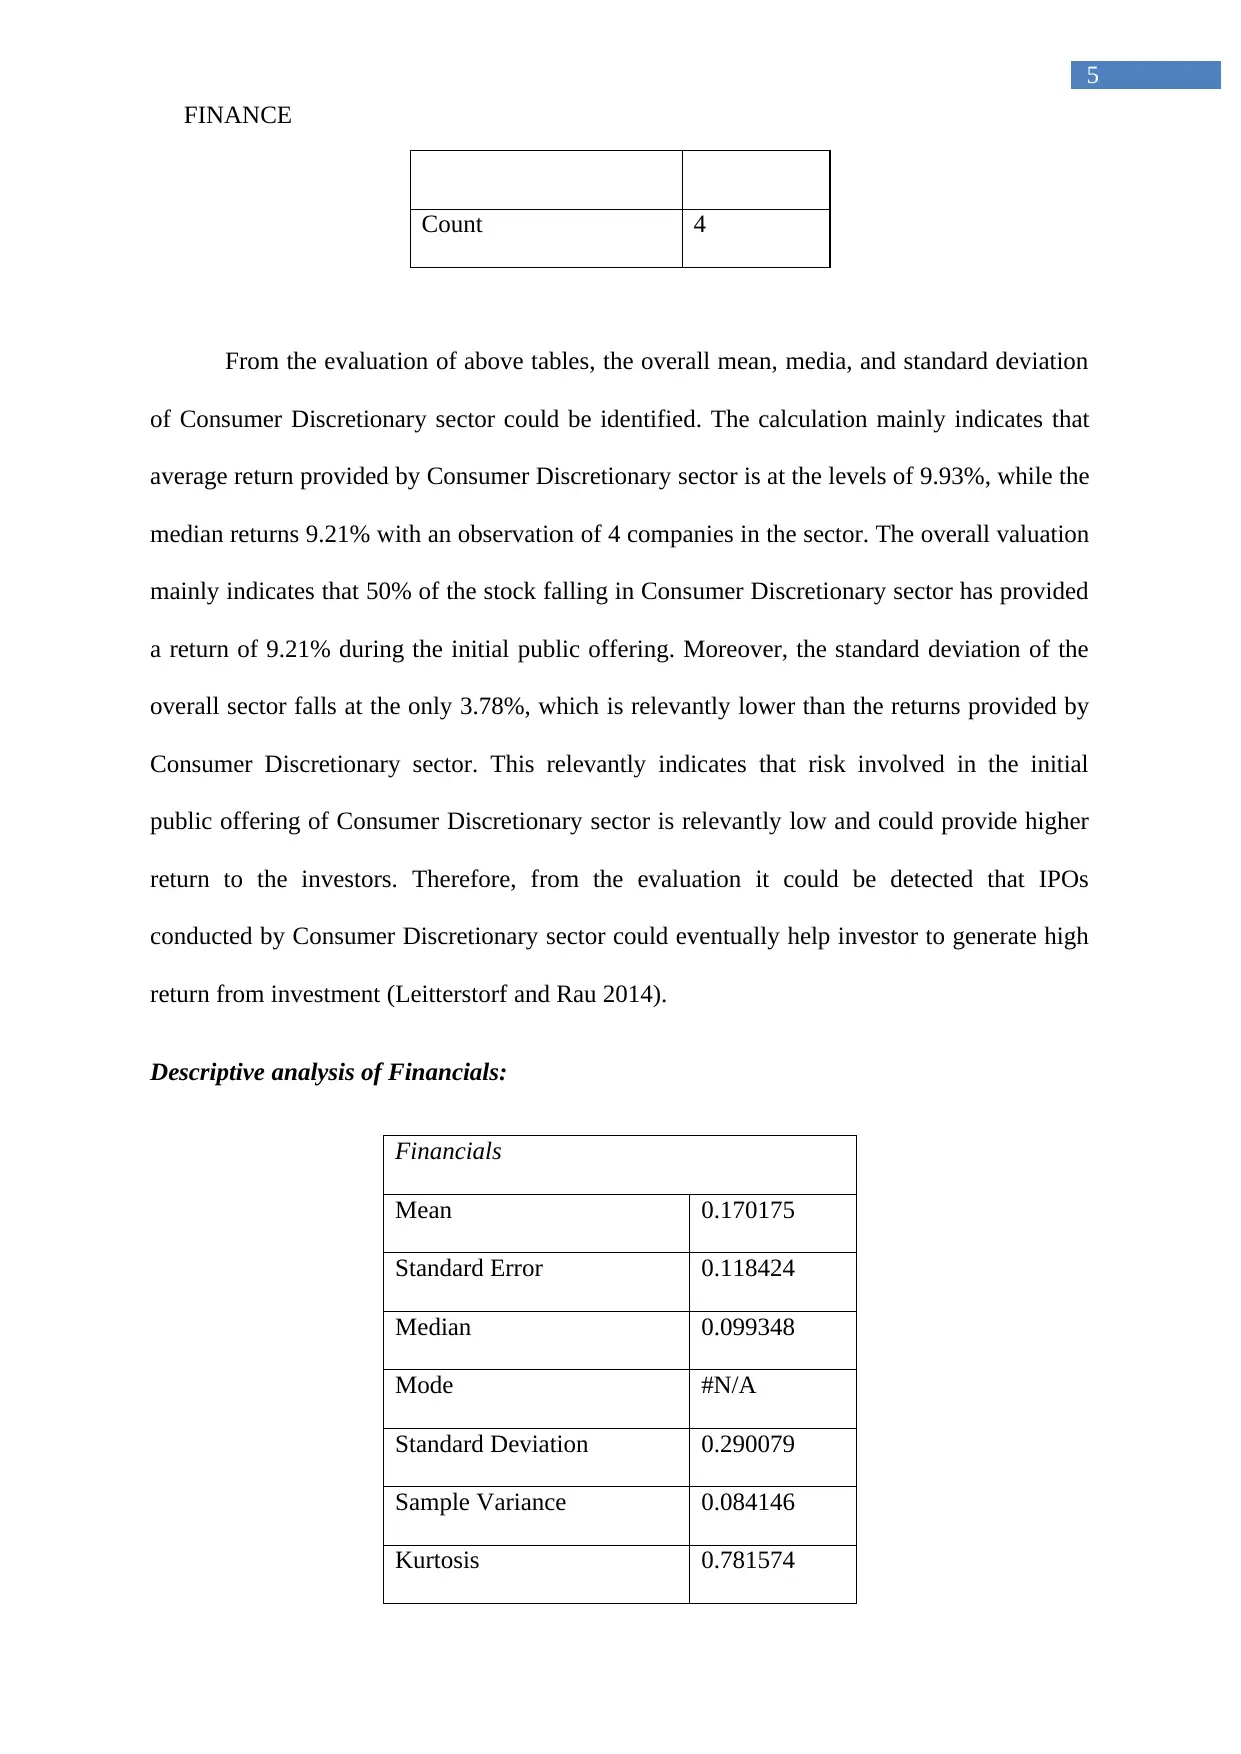
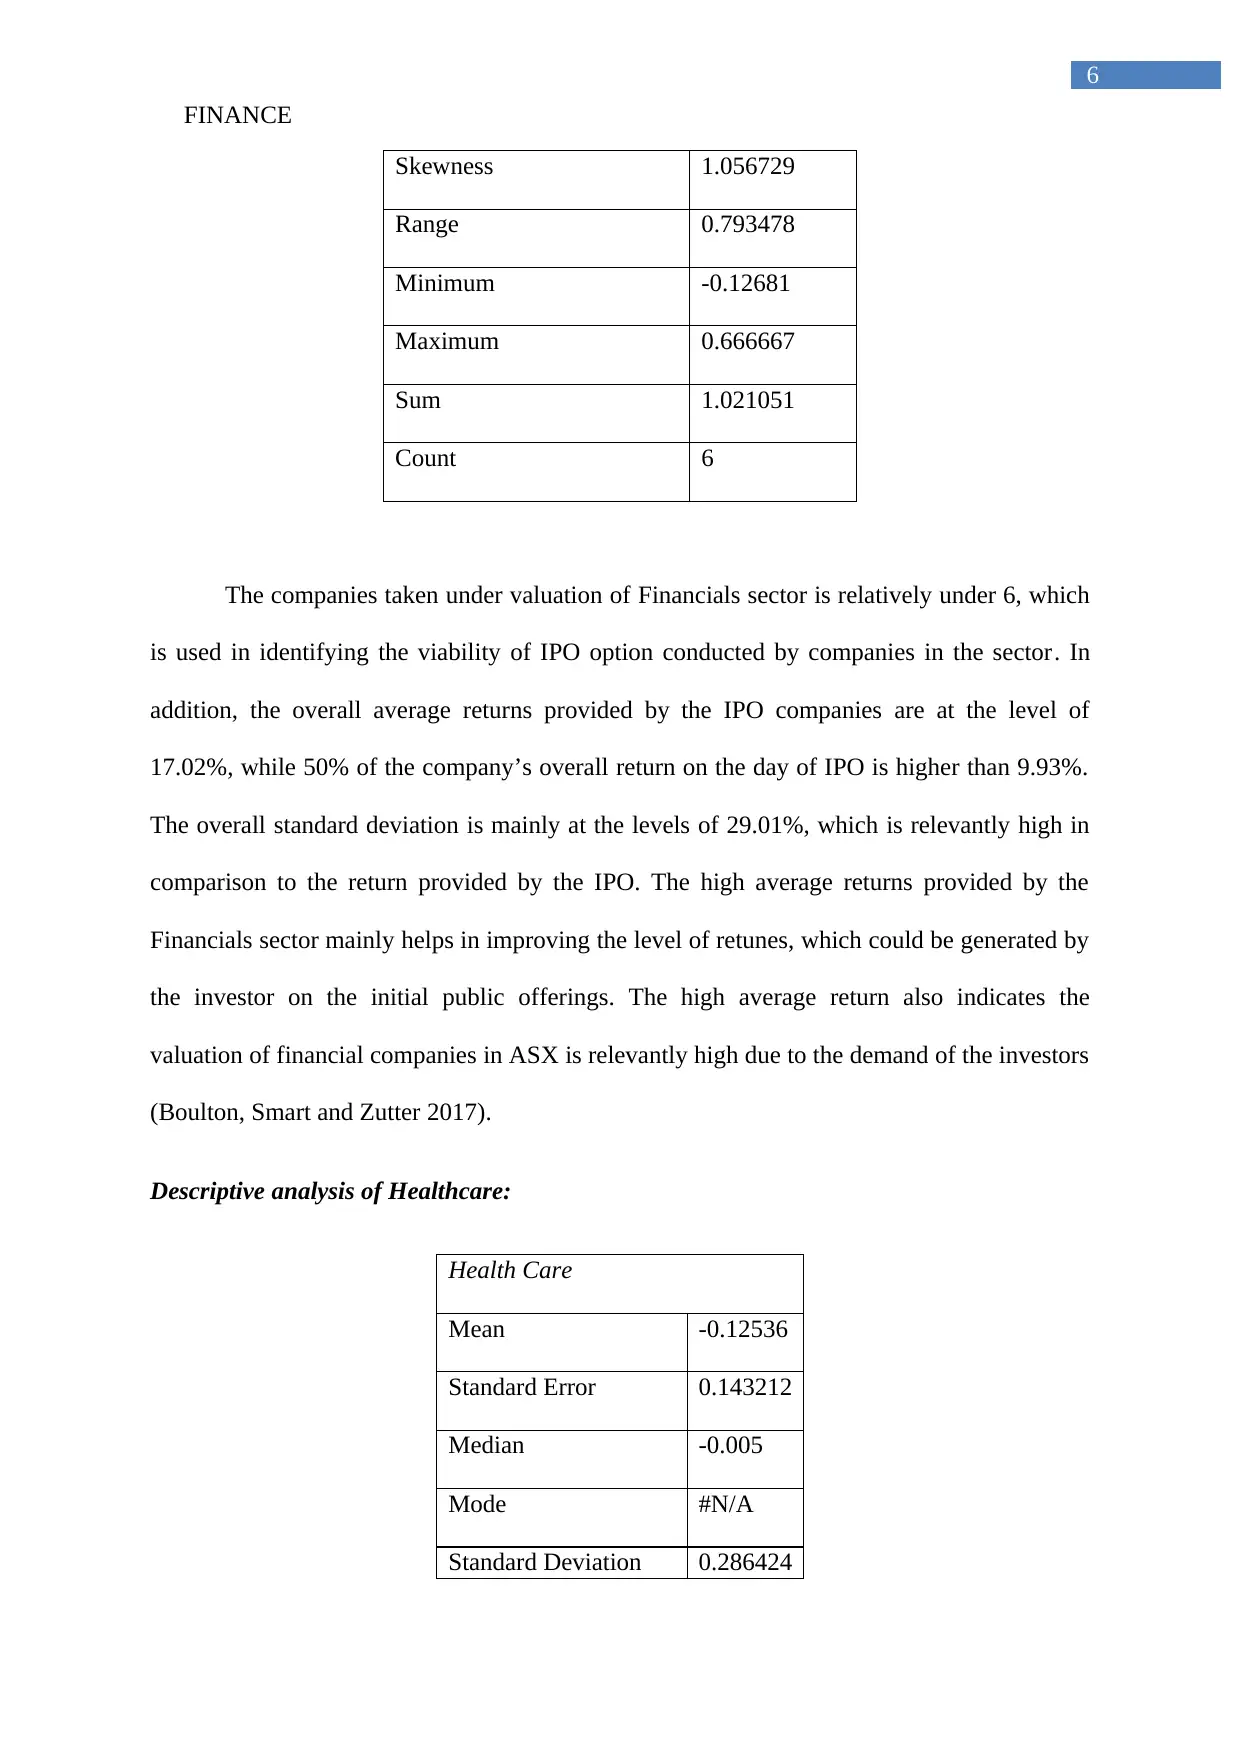
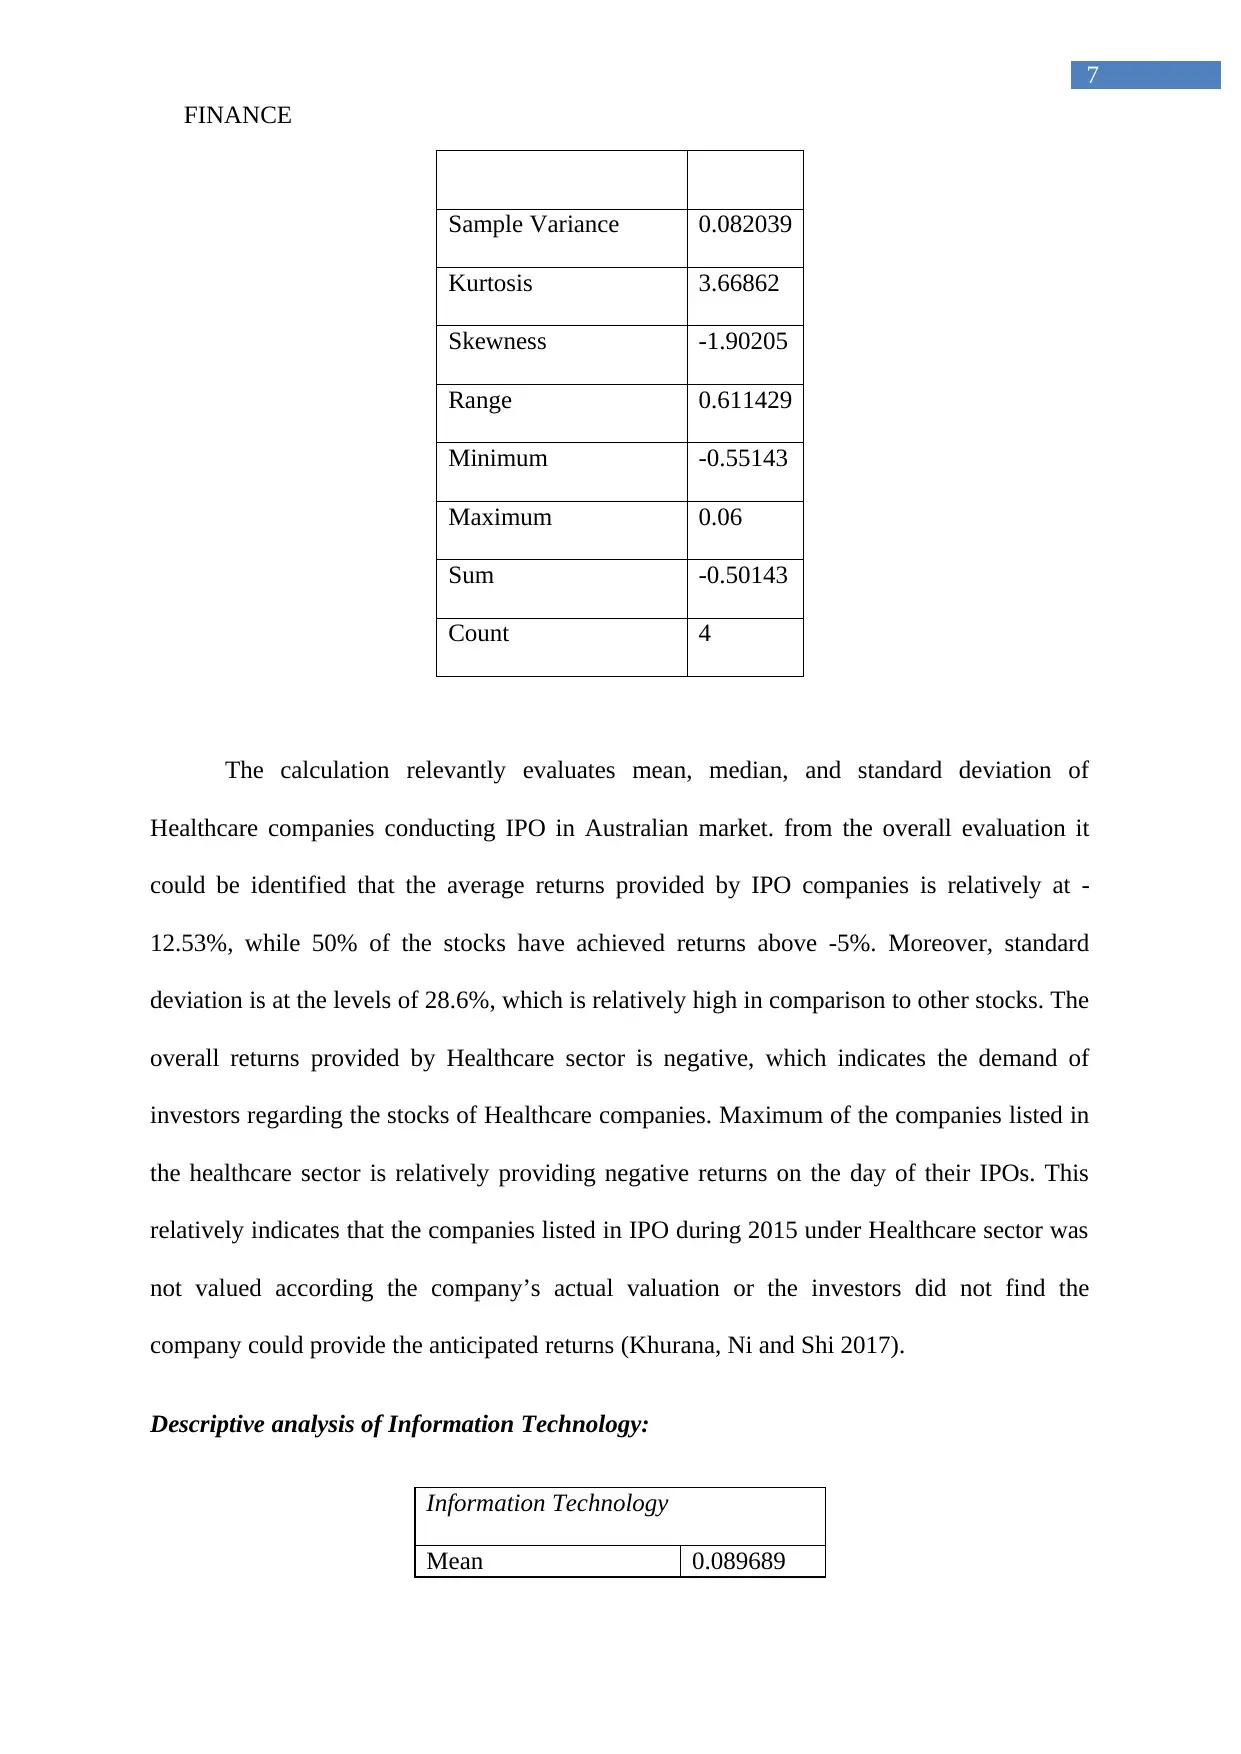
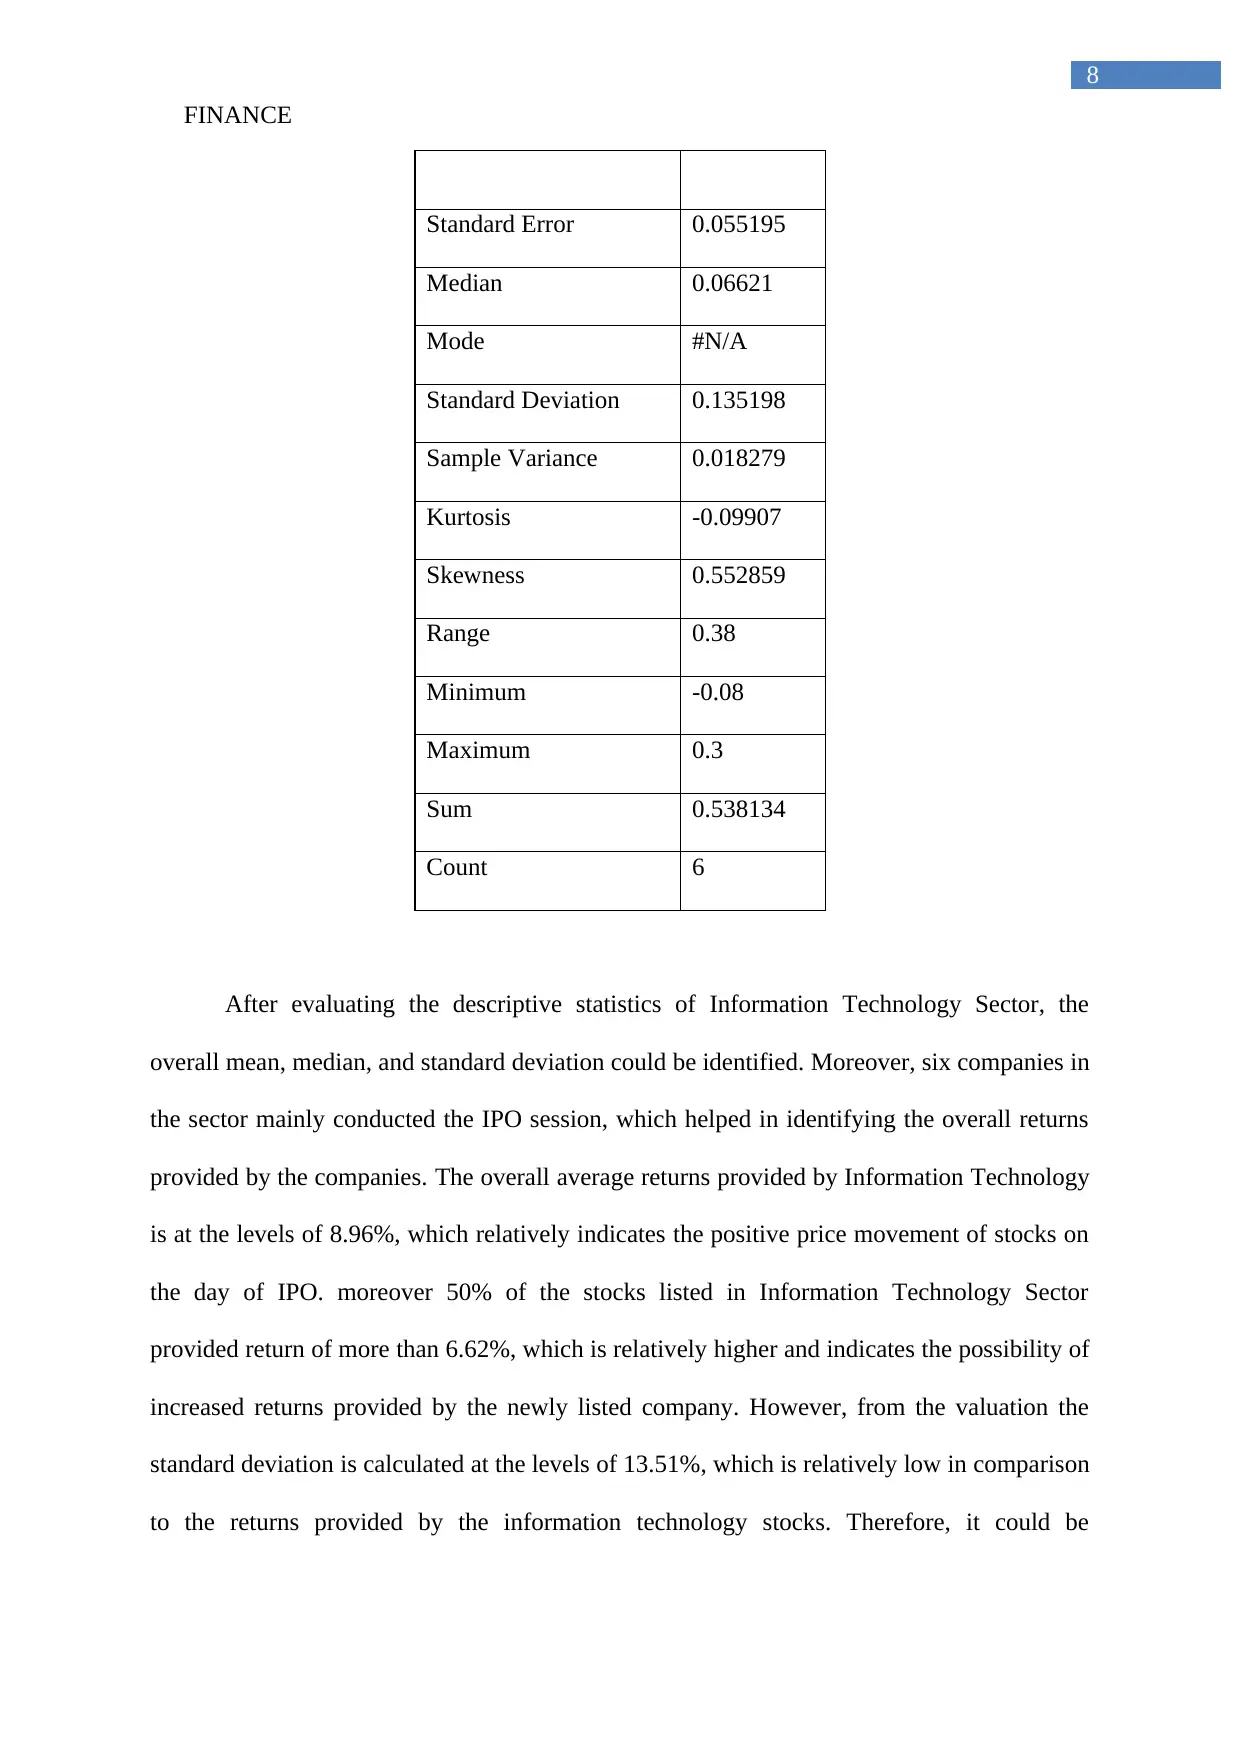
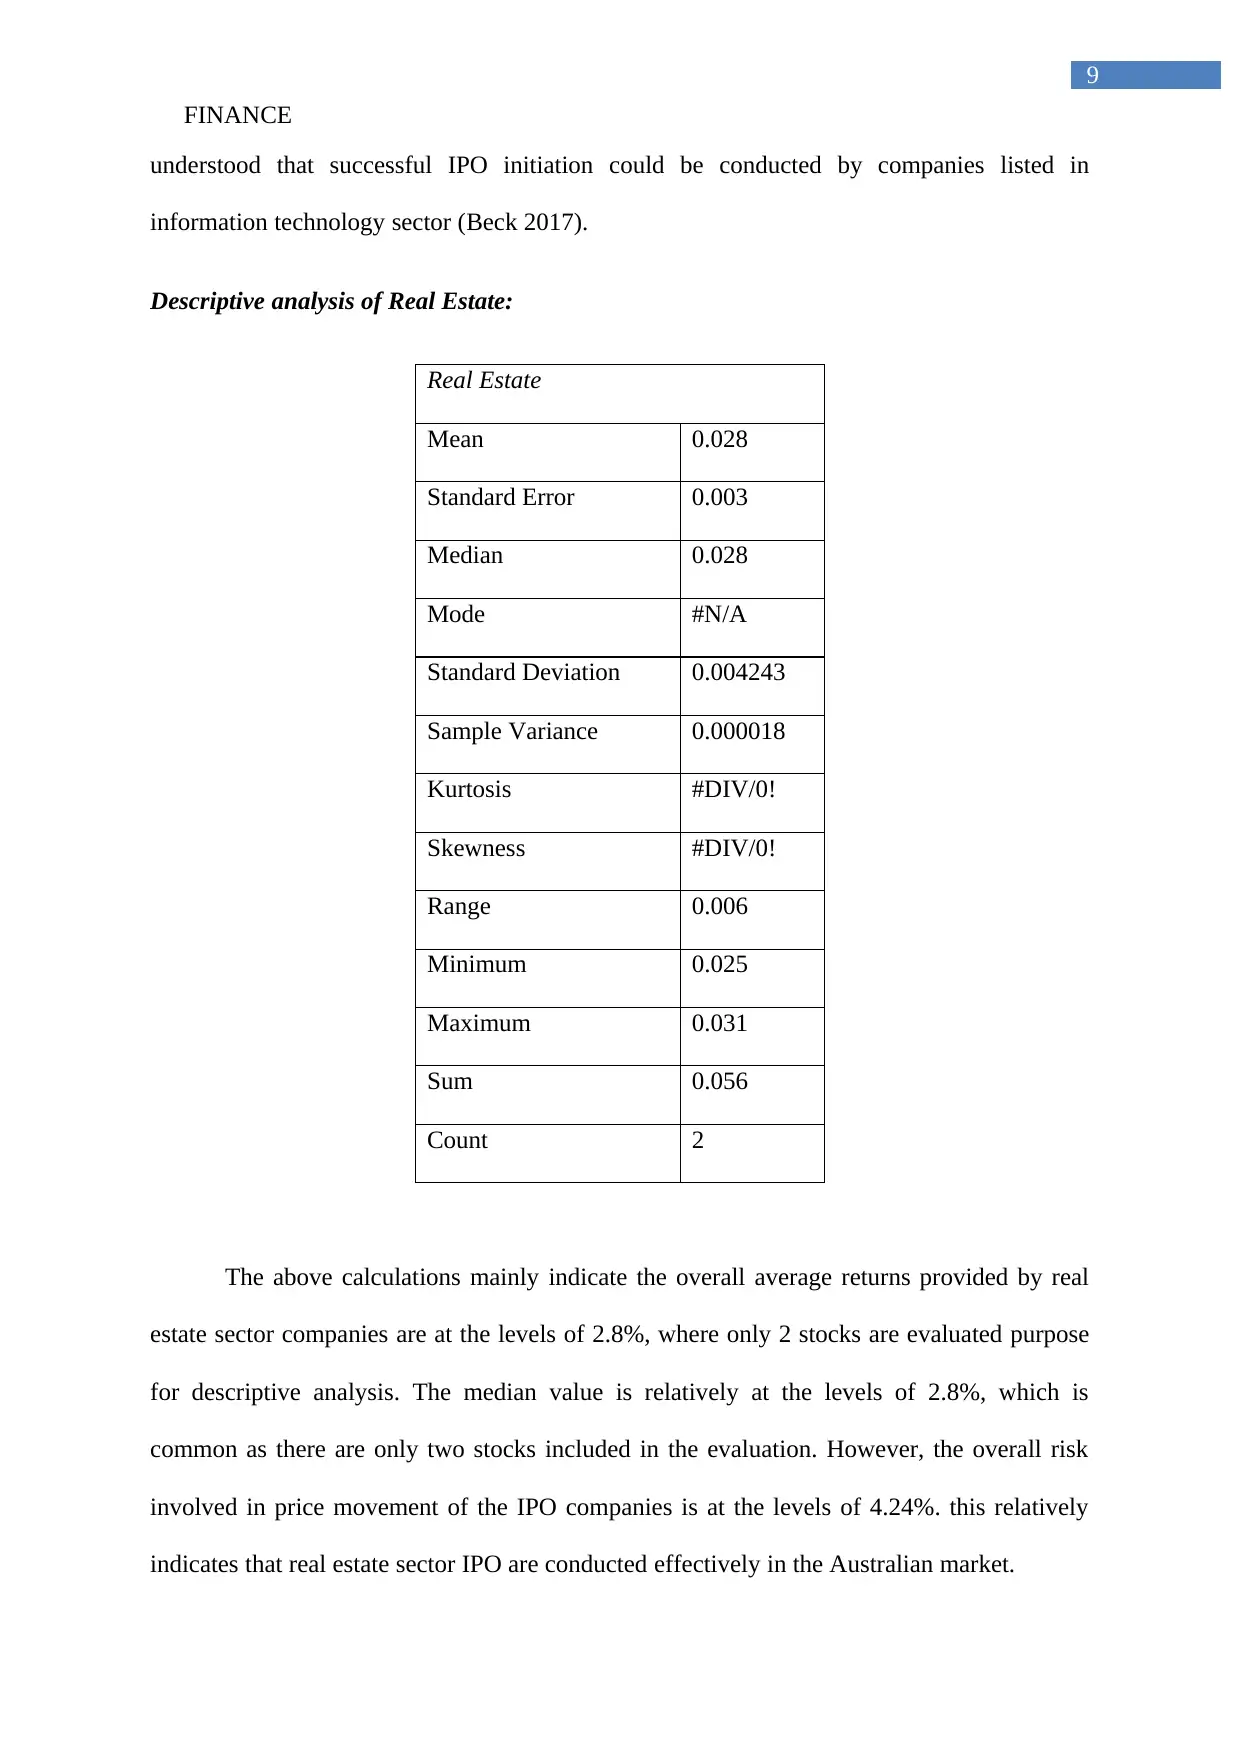
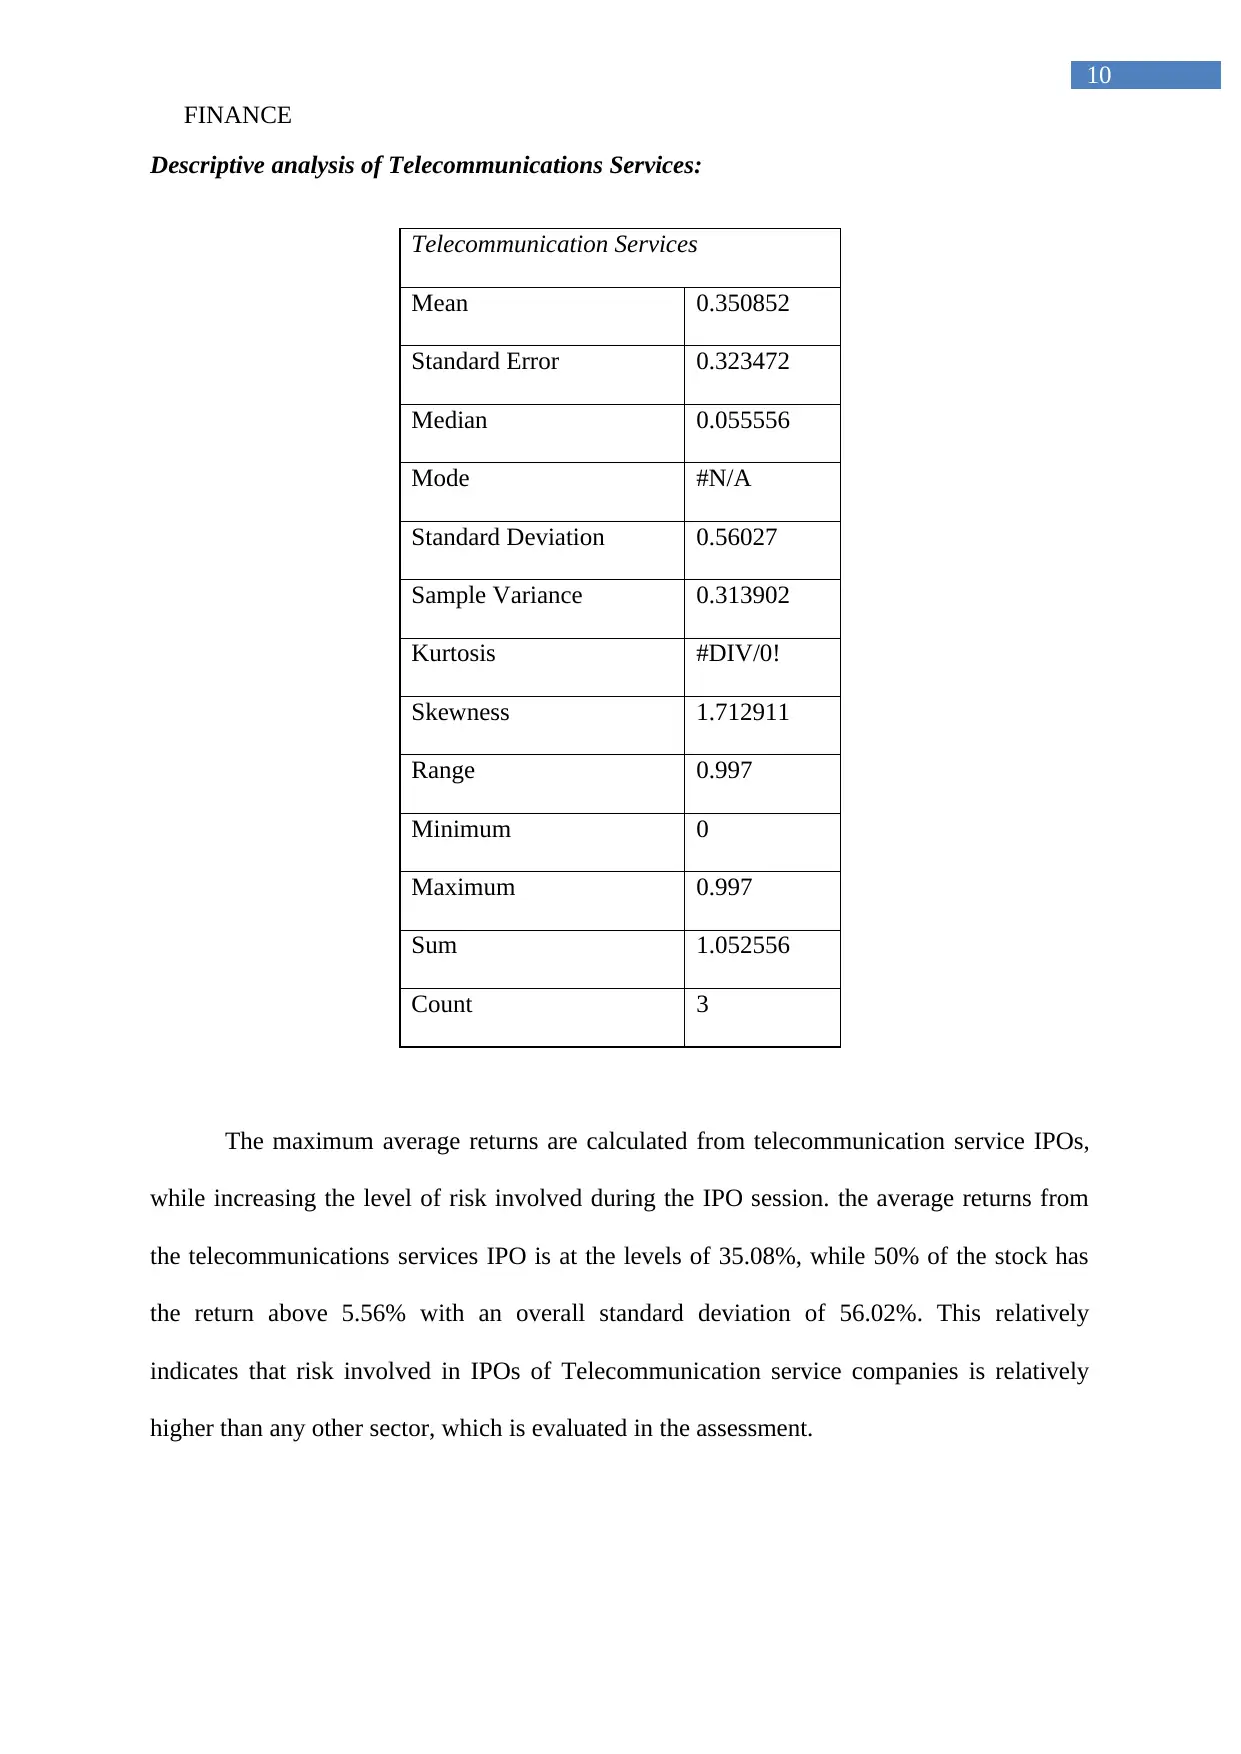
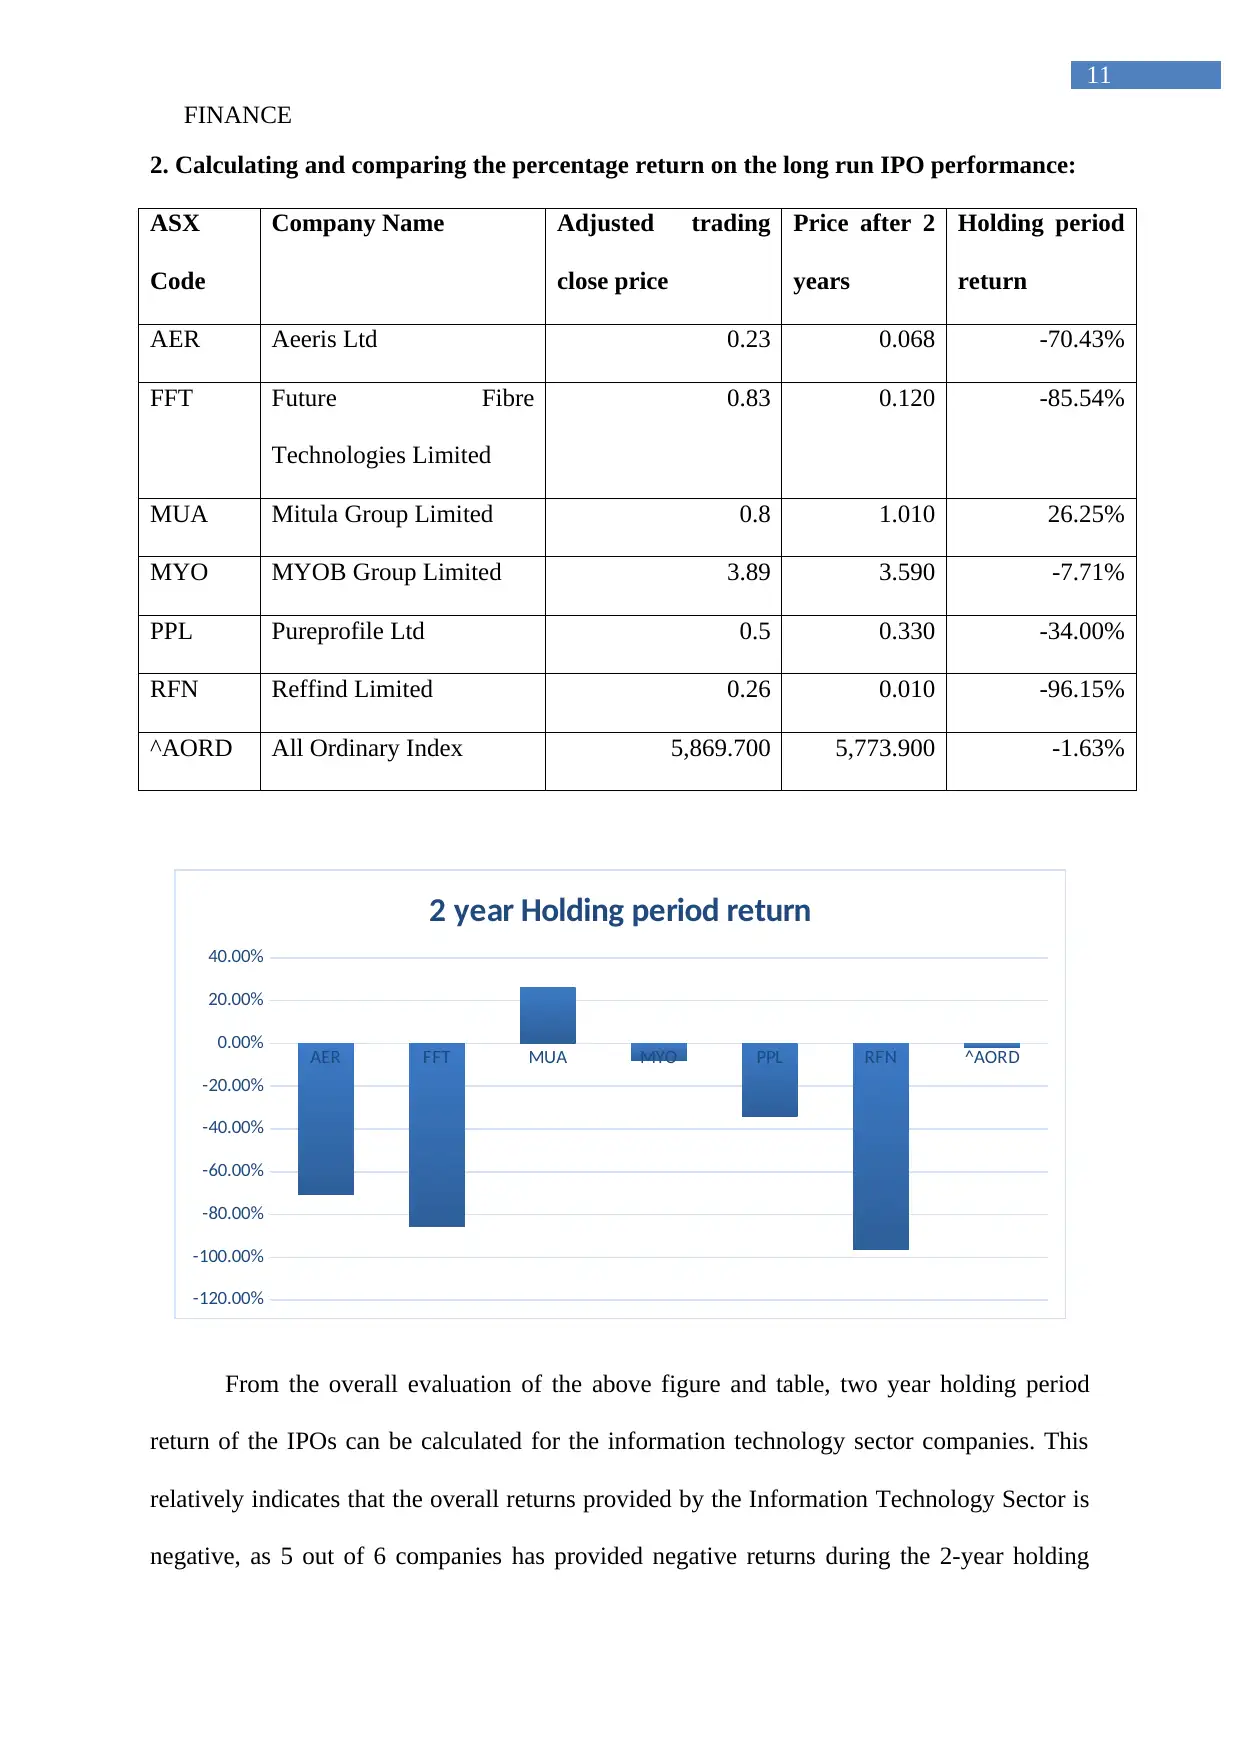
This report provides an analysis of the Australian IPO market, focusing on initial returns and long-term performance of companies listed between April and July 2015. It includes a descriptive analysis of initial returns, examining mean, median, mode, and standard deviation for the overall market and various GICS sectors like Consumer Discretionary, Financials, Healthcare, Information Technology, Real Estate, and Telecommunications Services. The report also calculates and compares percentage returns over a two-year holding period, revealing that many IPOs resulted in negative returns compared to the All Ordinaries Index. Furthermore, it explores the reasons for short-run IPO underpricing, referencing empirical studies to understand the factors influencing initial stock valuations. The analysis suggests that investing in IPOs at initiation can be risky due to high volatility and that investors should conduct thorough research before investing. Desklib provides access to similar solved assignments and resources for students.
Document Page
Running head: FINANCE
Finance
Name of the Student:
Name of the University:
Authors Note:
tabler-icon-diamond-filled.svg

Paraphrase This Document

Need a fresh take? Get an instant paraphrase of this document with our AI Paraphraser
Document Page
FINANCE
1
Table of Contents
Question:....................................................................................................................................2
1. Understanding the calculation of initial returns, while analysing and interpreting the
Australian IPO market:..............................................................................................................2
2. Calculating and comparing the percentage return on the long run IPO performance:.........11
3. Understanding the reason for the occurrence of short run IPO under-pricing and contrasting
the results with empirical study:..............................................................................................12
Reference and Bibliography:....................................................................................................16
Document Page
FINANCE
2
Question:
1. Understanding the calculation of initial returns, while analysing and interpreting the
Australian IPO market:
Descriptive analysis of the initial public listing:
Initial return
Mean 0.094234
Standard Error 0.049411
Median 0.057778
Mode 0
Standard Deviation 0.261457
Sample Variance 0.06836
Kurtosis 6.076875
Skewness 1.44621
Range 1.548429
Minimum -0.55143
Maximum 0.997
Sum 2.638556
Count 28
The above table represent the descriptive analysis of the overall IPO listing, which is
been conducted between the 1 April 2015 to 31 July 2015. In addition, the analysis relevantly
evaluates the mean, median, mode and standard deviation of the overall initial public offering
conducted in the Australian capital market. The number of companies used in the evaluation
Document Page
FINANCE
3
is 28, which helps in understanding the overall valuation and risk involved in the investment
of IPO. In addition, the overall evaluation mainly indicated an average return of all the
companies provided from the IPO at the level of 9.42%. In addition, the median is relevantly
calculated at the levels of 5.78%, while the mode is calculated at 0. The median value mainly
indicates that 50% of the IPO companies are having returns higher than 53.78%, while the
overall 50% are not achieving the median returns. Moreover, standard deviation of the return
provided by the IPO on the initial day is calculated at the levels of 26.15%. This relevantly
indicates that risk and return of the IPO is higher in the initial day, which could hamper return
generation capability of the investors. Judge et al. (2015) mentioned that investors use the
initial valuation of the company to identify the relevant investment options, which could
increase their chance to generate higher return from investment.
1ST
ADH
AER
AFG
ALI
AXP
AYS
BMH
CGC
ECX
FFT
FRX
GDF
GNX
GTY
IQ3
KSL
MDC
MUA
MYO
NCL
PIQ
PPL
QMS
RFN
SHM
SLC
WDE
-80.00%
-60.00%
-40.00%
-20.00%
0.00%
20.00%
40.00%
60.00%
80.00%
100.00%
120.00%
Initi al return
The figure relevantly helps in depicting the overall initial return of the companies
conducting their IPO. Maximum of the companies on the day of their IPO has made losses,
while some of the companies made exponential gains. The inconsistency in the returns of the
IPO companies is due the valuation conducted by investors. Kotlar et al. (2017) stated that
investor use different valuation method to derive the accurate share price valuation of a
tabler-icon-diamond-filled.svg

Paraphrase This Document

Need a fresh take? Get an instant paraphrase of this document with our AI Paraphraser
Document Page
FINANCE
4
company conducting their IPOs. Therefore, the high return generated by some of the
companies mainly concealed the losses incurred by companies doing the initial public
offering.
Relevant assumptions are made before segregating the companies according to their
sector, where the sector with only one company is ignored, as the overall descriptive analysis
would not be conducted for the concern sector. The sector with more than one stock is taken
into consideration to understand the risk and retune provided from the IPO initiation. The
sector such as Consumer staples, Industrials, and Utilities are not evaluated under the
descriptive statistics, as they have only one stock and the analysis will not be feasible. The
overall descriptive analysis on different GICS sector are depicted as follows.
Descriptive analysis of Consumer Discretionary:
Consumer Discretionary
Mean 0.099311
Standard Error 0.018883
Median 0.092083
Mode #N/A
Standard Deviation 0.037766
Sample Variance 0.001426
Kurtosis 0.371157
Skewness 0.935463
Range 0.086923
Minimum 0.063077
Maximum 0.15
Sum 0.397244
Document Page
FINANCE
5
Count 4
From the evaluation of above tables, the overall mean, media, and standard deviation
of Consumer Discretionary sector could be identified. The calculation mainly indicates that
average return provided by Consumer Discretionary sector is at the levels of 9.93%, while the
median returns 9.21% with an observation of 4 companies in the sector. The overall valuation
mainly indicates that 50% of the stock falling in Consumer Discretionary sector has provided
a return of 9.21% during the initial public offering. Moreover, the standard deviation of the
overall sector falls at the only 3.78%, which is relevantly lower than the returns provided by
Consumer Discretionary sector. This relevantly indicates that risk involved in the initial
public offering of Consumer Discretionary sector is relevantly low and could provide higher
return to the investors. Therefore, from the evaluation it could be detected that IPOs
conducted by Consumer Discretionary sector could eventually help investor to generate high
return from investment (Leitterstorf and Rau 2014).
Descriptive analysis of Financials:
Financials
Mean 0.170175
Standard Error 0.118424
Median 0.099348
Mode #N/A
Standard Deviation 0.290079
Sample Variance 0.084146
Kurtosis 0.781574
Document Page
FINANCE
6
Skewness 1.056729
Range 0.793478
Minimum -0.12681
Maximum 0.666667
Sum 1.021051
Count 6
The companies taken under valuation of Financials sector is relatively under 6, which
is used in identifying the viability of IPO option conducted by companies in the sector. In
addition, the overall average returns provided by the IPO companies are at the level of
17.02%, while 50% of the company’s overall return on the day of IPO is higher than 9.93%.
The overall standard deviation is mainly at the levels of 29.01%, which is relevantly high in
comparison to the return provided by the IPO. The high average returns provided by the
Financials sector mainly helps in improving the level of retunes, which could be generated by
the investor on the initial public offerings. The high average return also indicates the
valuation of financial companies in ASX is relevantly high due to the demand of the investors
(Boulton, Smart and Zutter 2017).
Descriptive analysis of Healthcare:
Health Care
Mean -0.12536
Standard Error 0.143212
Median -0.005
Mode #N/A
Standard Deviation 0.286424
tabler-icon-diamond-filled.svg

Paraphrase This Document

Need a fresh take? Get an instant paraphrase of this document with our AI Paraphraser
Document Page
FINANCE
7
Sample Variance 0.082039
Kurtosis 3.66862
Skewness -1.90205
Range 0.611429
Minimum -0.55143
Maximum 0.06
Sum -0.50143
Count 4
The calculation relevantly evaluates mean, median, and standard deviation of
Healthcare companies conducting IPO in Australian market. from the overall evaluation it
could be identified that the average returns provided by IPO companies is relatively at -
12.53%, while 50% of the stocks have achieved returns above -5%. Moreover, standard
deviation is at the levels of 28.6%, which is relatively high in comparison to other stocks. The
overall returns provided by Healthcare sector is negative, which indicates the demand of
investors regarding the stocks of Healthcare companies. Maximum of the companies listed in
the healthcare sector is relatively providing negative returns on the day of their IPOs. This
relatively indicates that the companies listed in IPO during 2015 under Healthcare sector was
not valued according the company’s actual valuation or the investors did not find the
company could provide the anticipated returns (Khurana, Ni and Shi 2017).
Descriptive analysis of Information Technology:
Information Technology
Mean 0.089689
Document Page
FINANCE
8
Standard Error 0.055195
Median 0.06621
Mode #N/A
Standard Deviation 0.135198
Sample Variance 0.018279
Kurtosis -0.09907
Skewness 0.552859
Range 0.38
Minimum -0.08
Maximum 0.3
Sum 0.538134
Count 6
After evaluating the descriptive statistics of Information Technology Sector, the
overall mean, median, and standard deviation could be identified. Moreover, six companies in
the sector mainly conducted the IPO session, which helped in identifying the overall returns
provided by the companies. The overall average returns provided by Information Technology
is at the levels of 8.96%, which relatively indicates the positive price movement of stocks on
the day of IPO. moreover 50% of the stocks listed in Information Technology Sector
provided return of more than 6.62%, which is relatively higher and indicates the possibility of
increased returns provided by the newly listed company. However, from the valuation the
standard deviation is calculated at the levels of 13.51%, which is relatively low in comparison
to the returns provided by the information technology stocks. Therefore, it could be
Document Page
FINANCE
9
understood that successful IPO initiation could be conducted by companies listed in
information technology sector (Beck 2017).
Descriptive analysis of Real Estate:
Real Estate
Mean 0.028
Standard Error 0.003
Median 0.028
Mode #N/A
Standard Deviation 0.004243
Sample Variance 0.000018
Kurtosis #DIV/0!
Skewness #DIV/0!
Range 0.006
Minimum 0.025
Maximum 0.031
Sum 0.056
Count 2
The above calculations mainly indicate the overall average returns provided by real
estate sector companies are at the levels of 2.8%, where only 2 stocks are evaluated purpose
for descriptive analysis. The median value is relatively at the levels of 2.8%, which is
common as there are only two stocks included in the evaluation. However, the overall risk
involved in price movement of the IPO companies is at the levels of 4.24%. this relatively
indicates that real estate sector IPO are conducted effectively in the Australian market.
tabler-icon-diamond-filled.svg

Paraphrase This Document

Need a fresh take? Get an instant paraphrase of this document with our AI Paraphraser
Document Page
FINANCE
10
Descriptive analysis of Telecommunications Services:
Telecommunication Services
Mean 0.350852
Standard Error 0.323472
Median 0.055556
Mode #N/A
Standard Deviation 0.56027
Sample Variance 0.313902
Kurtosis #DIV/0!
Skewness 1.712911
Range 0.997
Minimum 0
Maximum 0.997
Sum 1.052556
Count 3
The maximum average returns are calculated from telecommunication service IPOs,
while increasing the level of risk involved during the IPO session. the average returns from
the telecommunications services IPO is at the levels of 35.08%, while 50% of the stock has
the return above 5.56% with an overall standard deviation of 56.02%. This relatively
indicates that risk involved in IPOs of Telecommunication service companies is relatively
higher than any other sector, which is evaluated in the assessment.
Document Page
FINANCE
11
2. Calculating and comparing the percentage return on the long run IPO performance:
ASX
Code
Company Name Adjusted trading
close price
Price after 2
years
Holding period
return
AER Aeeris Ltd 0.23 0.068 -70.43%
FFT Future Fibre
Technologies Limited
0.83 0.120 -85.54%
MUA Mitula Group Limited 0.8 1.010 26.25%
MYO MYOB Group Limited 3.89 3.590 -7.71%
PPL Pureprofile Ltd 0.5 0.330 -34.00%
RFN Reffind Limited 0.26 0.010 -96.15%
^AORD All Ordinary Index 5,869.700 5,773.900 -1.63%
AER FFT MUA MYO PPL RFN ^AORD
-120.00%
-100.00%
-80.00%
-60.00%
-40.00%
-20.00%
0.00%
20.00%
40.00%
2 year Holding period return
From the overall evaluation of the above figure and table, two year holding period
return of the IPOs can be calculated for the information technology sector companies. This
relatively indicates that the overall returns provided by the Information Technology Sector is
negative, as 5 out of 6 companies has provided negative returns during the 2-year holding
chevron_up_icon
1 out of 19
circle_padding
hide_on_mobile
zoom_out_icon
[object Object]