MRK455 Assignment: Data Analysis, Surveys and Focus Groups
VerifiedAdded on 2022/09/23
|7
|1952
|23
Homework Assignment
AI Summary
This assignment provides a comprehensive analysis of marketing concepts through various data analysis techniques. The first question involves an independent sample t-test to determine the impact of package color on sales, comparing red and blue packages. The second question utilizes a chi-square test to analyze the relationship between gender and rate plan upgrades. Question three involves regression analysis to predict ice-cream sales based on temperature, rain, and wind. The assignment also includes a detailed examination of survey design, contrasting internal and general population surveys, and analyzing consumer responses regarding vehicle preferences and future mobility trends. Finally, the assignment explores focus group methodologies, outlining participant characteristics, group organization, and discussion topics to gain consumer insights on a new car model.
Q1:
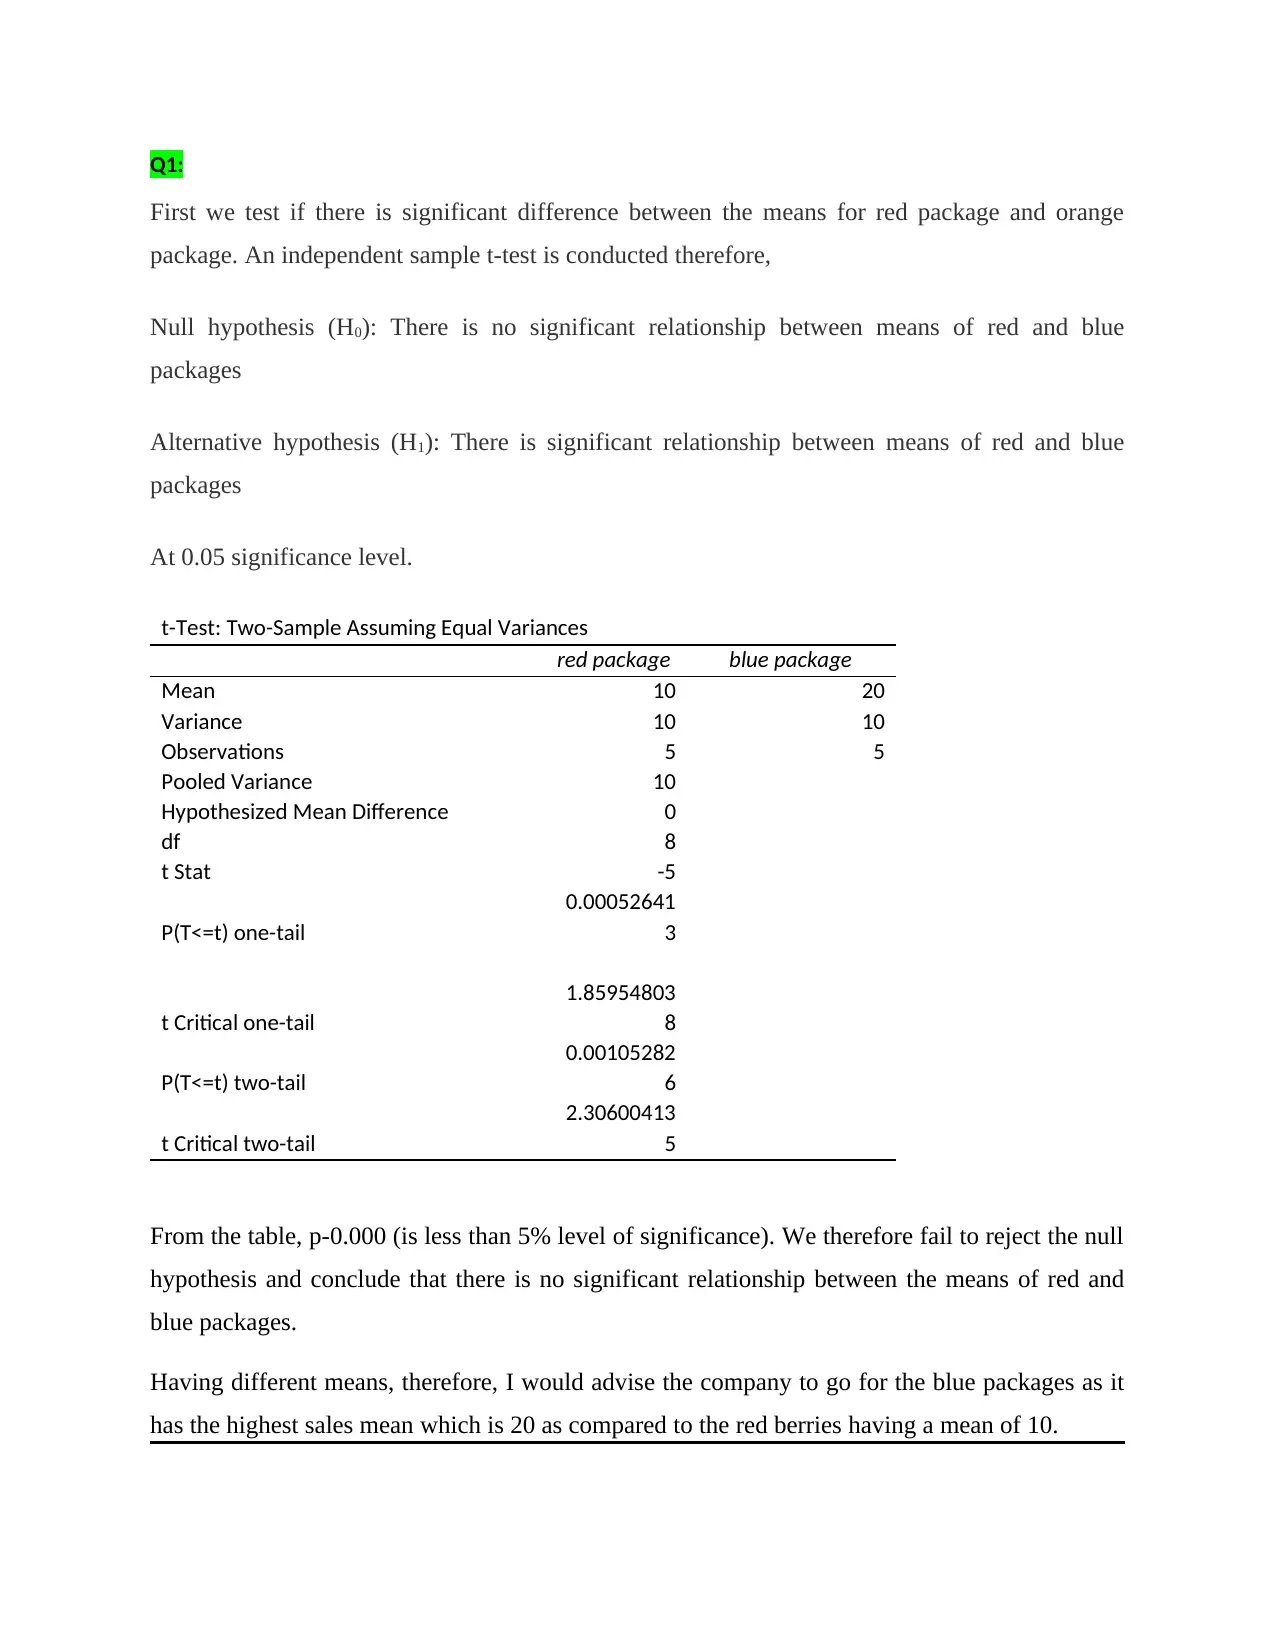
First we test if there is significant difference between the means for red package and orange
package. An independent sample t-test is conducted therefore,
Null hypothesis (H0): There is no significant relationship between means of red and blue
packages
Alternative hypothesis (H1): There is significant relationship between means of red and blue
packages
At 0.05 significance level.
t-Test: Two-Sample Assuming Equal Variances
red package blue package
Mean 10 20
Variance 10 10
Observations 5 5
Pooled Variance 10
Hypothesized Mean Difference 0
df 8
t Stat -5
P(T<=t) one-tail
0.00052641
3
t Critical one-tail
1.85954803
8
P(T<=t) two-tail
0.00105282
6
t Critical two-tail
2.30600413
5
From the table, p-0.000 (is less than 5% level of significance). We therefore fail to reject the null
hypothesis and conclude that there is no significant relationship between the means of red and
blue packages.
Having different means, therefore, I would advise the company to go for the blue packages as it
has the highest sales mean which is 20 as compared to the red berries having a mean of 10.
Paraphrase This Document
Need a fresh take? Get an instant paraphrase of this document with our AI Paraphraser
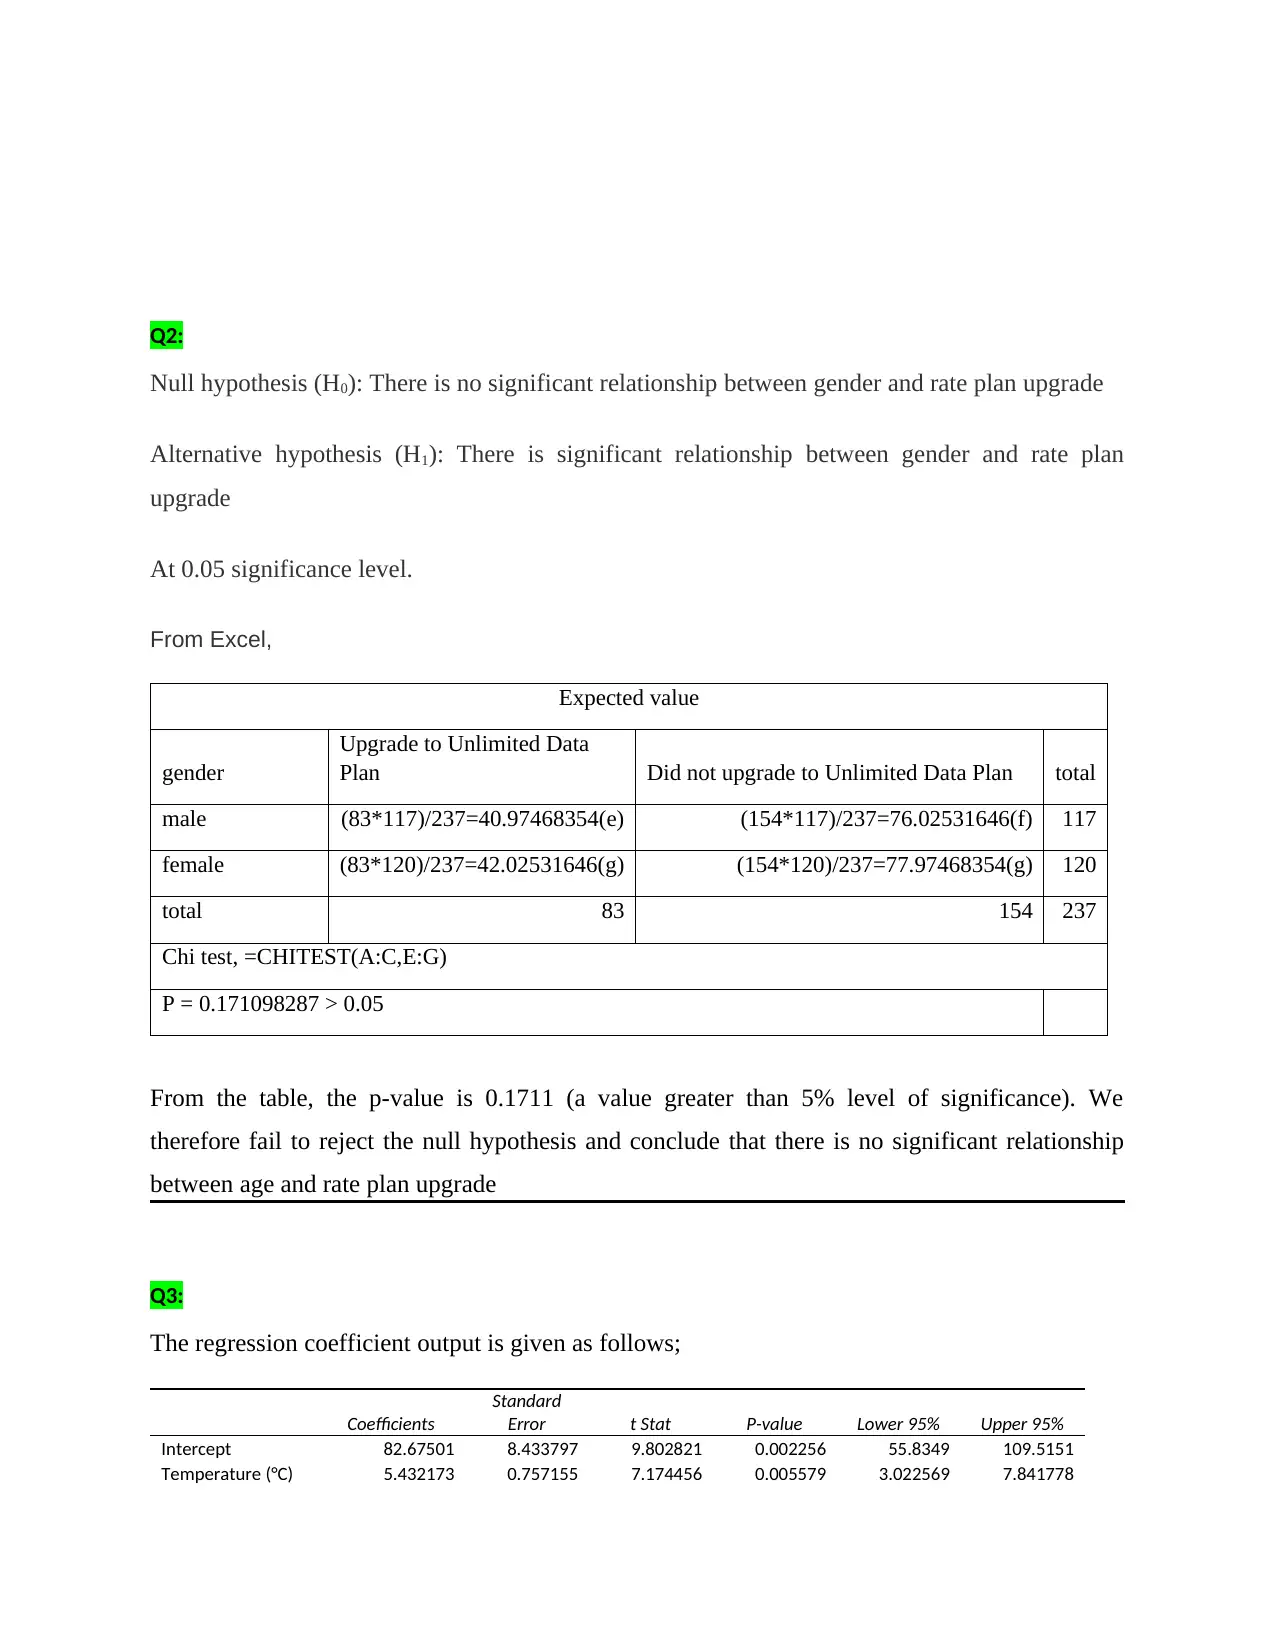
Q2:
Null hypothesis (H0): There is no significant relationship between gender and rate plan upgrade
Alternative hypothesis (H1): There is significant relationship between gender and rate plan
upgrade
At 0.05 significance level.
From Excel,
Expected value
gender
Upgrade to Unlimited Data
Plan Did not upgrade to Unlimited Data Plan total
male (83*117)/237=40.97468354(e) (154*117)/237=76.02531646(f) 117
female (83*120)/237=42.02531646(g) (154*120)/237=77.97468354(g) 120
total 83 154 237
Chi test, =CHITEST(A:C,E:G)
P = 0.171098287 > 0.05
From the table, the p-value is 0.1711 (a value greater than 5% level of significance). We
therefore fail to reject the null hypothesis and conclude that there is no significant relationship
between age and rate plan upgrade
Q3:
The regression coefficient output is given as follows;
Coefficients
Standard
Error t Stat P-value Lower 95% Upper 95%
Intercept 82.67501 8.433797 9.802821 0.002256 55.8349 109.5151
Temperature (°C) 5.432173 0.757155 7.174456 0.005579 3.022569 7.841778
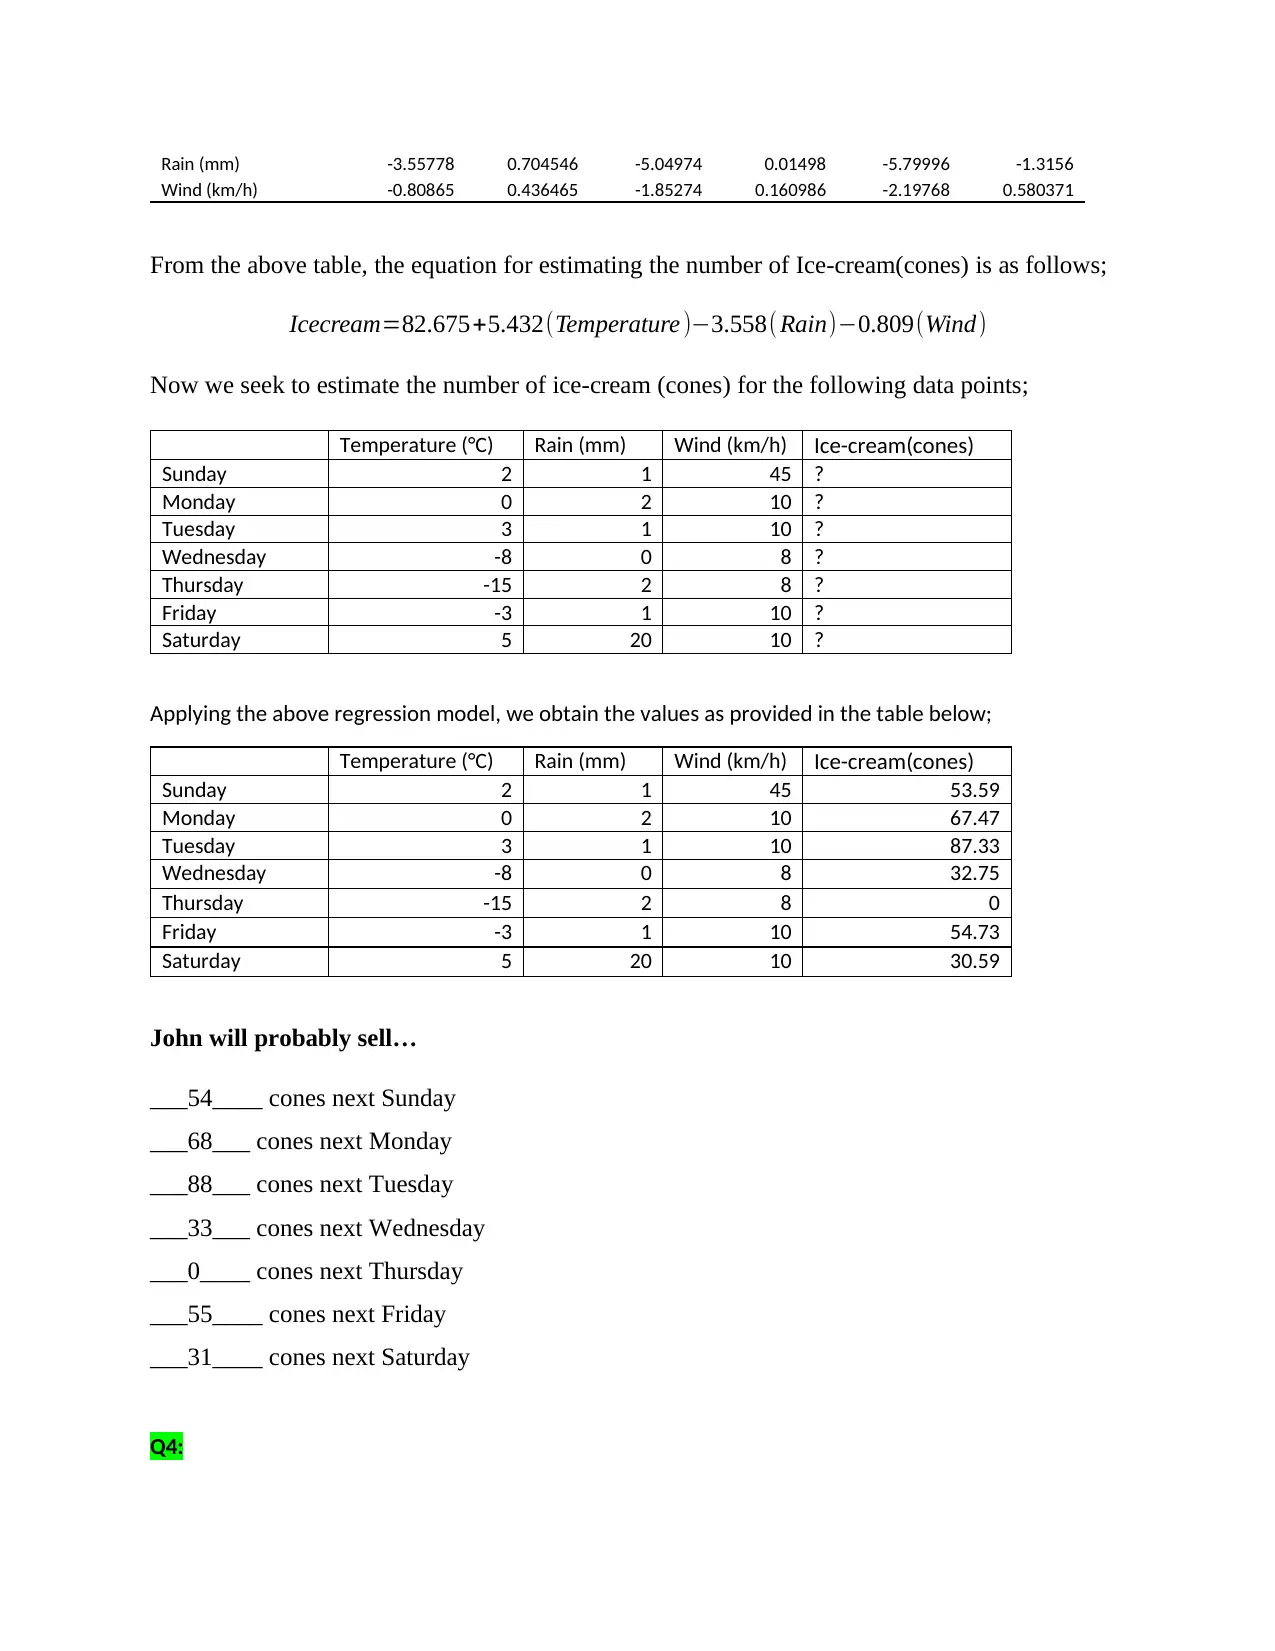
Rain (mm) -3.55778 0.704546 -5.04974 0.01498 -5.79996 -1.3156
Wind (km/h) -0.80865 0.436465 -1.85274 0.160986 -2.19768 0.580371
From the above table, the equation for estimating the number of Ice-cream(cones) is as follows;
Icecream=82.675+5.432(Temperature )−3.558( Rain)−0.809(Wind)
Now we seek to estimate the number of ice-cream (cones) for the following data points;
Temperature (°C) Rain (mm) Wind (km/h) Ice-cream(cones)
Sunday 2 1 45 ?
Monday 0 2 10 ?
Tuesday 3 1 10 ?
Wednesday -8 0 8 ?
Thursday -15 2 8 ?
Friday -3 1 10 ?
Saturday 5 20 10 ?
Applying the above regression model, we obtain the values as provided in the table below;
Temperature (°C) Rain (mm) Wind (km/h) Ice-cream(cones)
Sunday 2 1 45 53.59
Monday 0 2 10 67.47
Tuesday 3 1 10 87.33
Wednesday -8 0 8 32.75
Thursday -15 2 8 0
Friday -3 1 10 54.73
Saturday 5 20 10 30.59
John will probably sell…
___54____ cones next Sunday
___68___ cones next Monday
___88___ cones next Tuesday
___33___ cones next Wednesday
___0____ cones next Thursday
___55____ cones next Friday
___31____ cones next Saturday
Q4:
⊘ This is a preview!⊘
Do you want full access?
Subscribe today to unlock all pages.
Trusted by 1+ million students worldwide
Answer each question below. Tip: Remember to refer to the objectives identified in the
brief.
Part 1 Internal Database Survey: AMAZE455 Owners
1/ Sample Frame and Selection: Describe the target market you decided to work with from
your database. Did you use any quotas (e.g. demographic / car model / length of ownership)?
How did the CRM team suggest you select the sample? Was there any particular design?
I decided to work with the Canadian target market for the AMAZE455 owners. Moreover, I
applied different quotas in my survey: demographic characteristics of individuals from these
markets (areas, age, and social status of the owners among others), the models of the cars they
own in the company and the length of car ownership. The CRM helped me come with list of
owners from our database, their level of car ownership, and the demographic statistics of
individual owners.
2/ Identify at least two (2) reasons you wanted to survey AMAZE455 owners.
a. In order to know the experience they have gained from the AMAZE455
b. In order to know their current interest for the AMAZE455 cars.
3/ Give two (2) examples of questions you asked AMAZE455 owners that you didn’t ask in
the general population survey.
i. What can you say is your best/ worst experience since you became one of the
AMAZE455 owners?
ii. What are some of the challenges you have experienced as an AMAZE455 owner?
Part 2 General Population Survey: Car Owners
1/ Sample Frame and Selection: Describe the target market you requested the Research
House to use for this survey in the general population. Did you ask them to consider any
special characteristics? Tip: Refer to the brief and identify the characteristics that are most
relevant to your objectives.
My target population was the AMAZE455 brand car owners in the Canadian cities of Montreal,
Toronto, Calgary and Vancouver. I asked the team to consider the purchase trends of individuals,
Paraphrase This Document
Need a fresh take? Get an instant paraphrase of this document with our AI Paraphraser
people of different company brands, individual lifestyles, demographic characteristics of
customers and specific customer behaviors.
2/ Identify at least two (2) advantages the external sample has over your company’s
internal database that are critical to your objectives.
i. External sample gives me room to get additional information that couldn’t be
provided in the company’s internal data base.
ii. External sample gives me chance of determining individual customer moods and
lifestyles that couldn’t be provided by the internal sample.
iii. External sample gives me a data that I have full control over, unlike the internal
sample.
3/ Give two (2) examples of questions you asked the car owners among the general
population that you didn’t ask in the survey with the AMAZE455 owners.
a. As our model owner, what improvements would you wish from the car you own?
b. Do you appreciate the existence of AMAZE455 in Canada considering the products they
give to the market?
Q5:
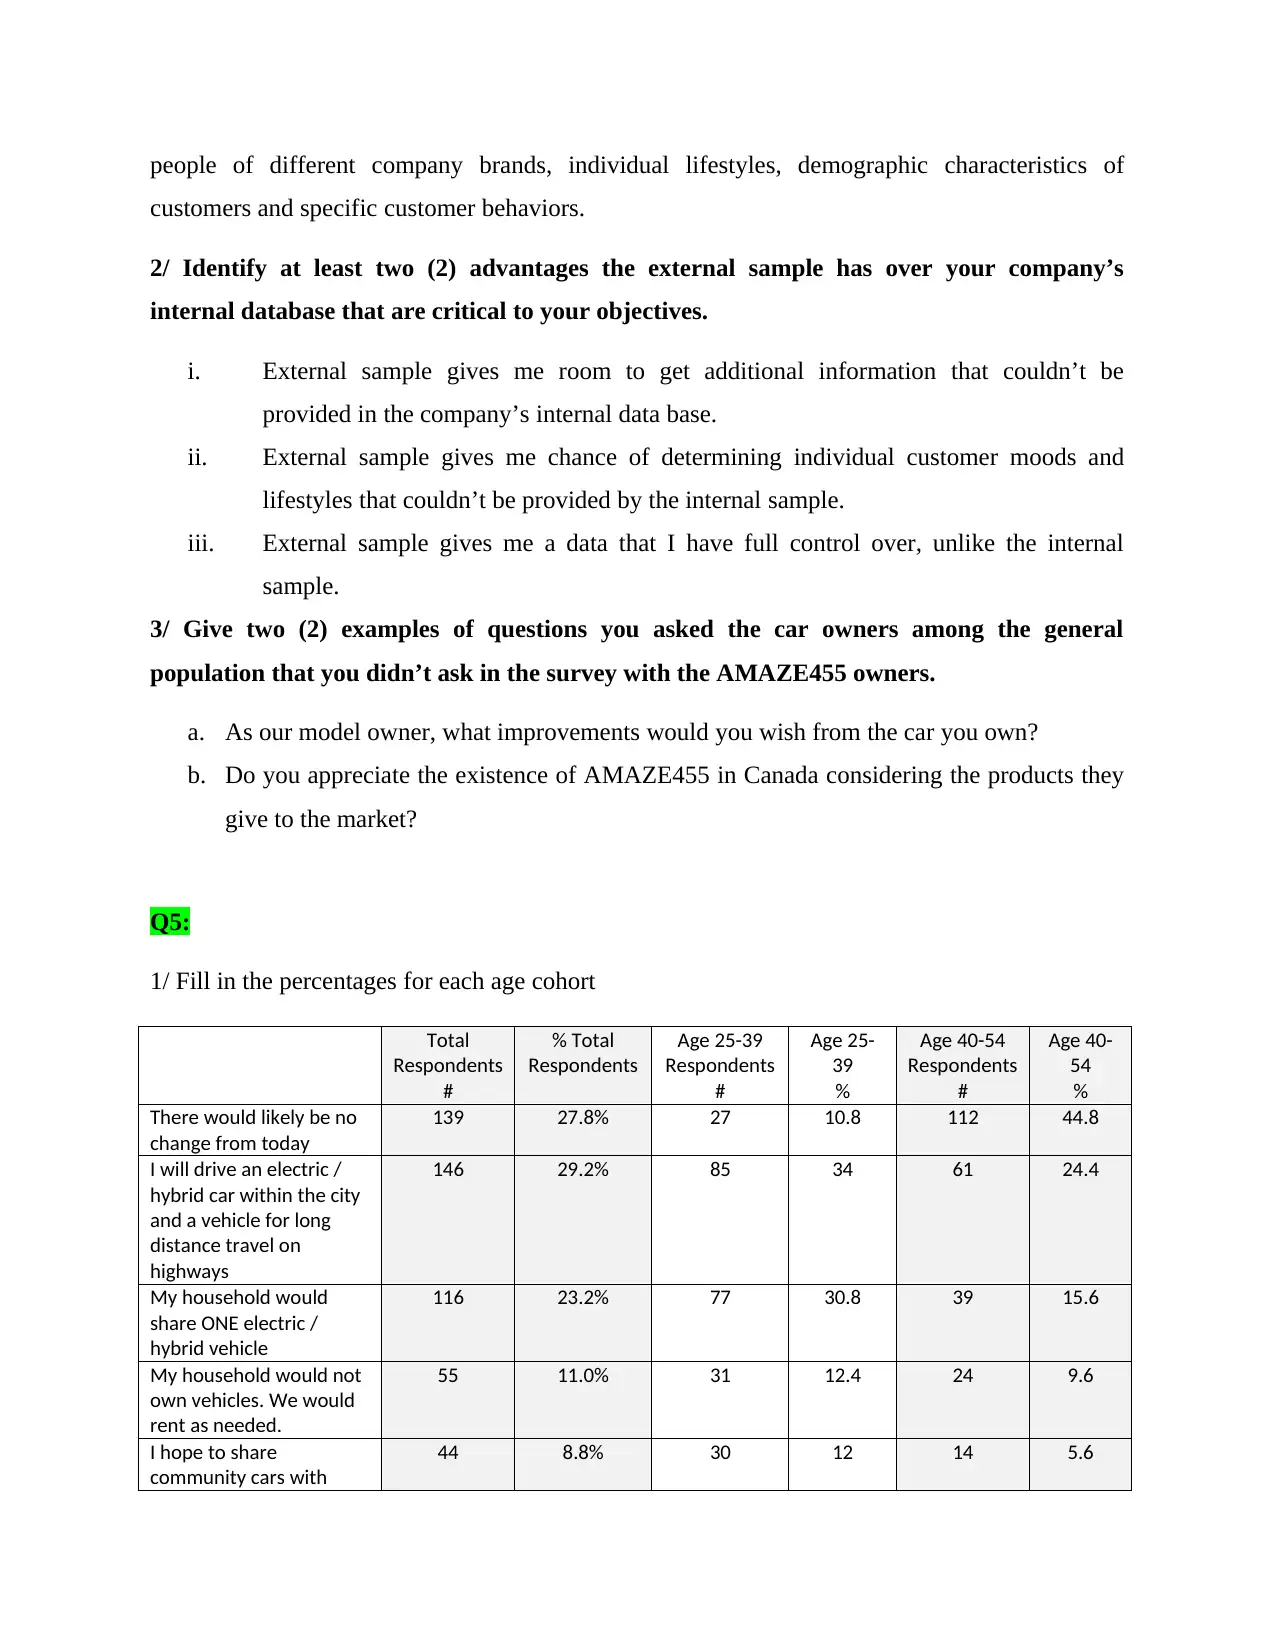
1/ Fill in the percentages for each age cohort
Total
Respondents
#
% Total
Respondents
Age 25-39
Respondents
#
Age 25-
39
%
Age 40-54
Respondents
#
Age 40-
54
%
There would likely be no
change from today
139 27.8% 27 10.8 112 44.8
I will drive an electric /
hybrid car within the city
and a vehicle for long
distance travel on
highways
146 29.2% 85 34 61 24.4
My household would
share ONE electric /
hybrid vehicle
116 23.2% 77 30.8 39 15.6
My household would not
own vehicles. We would
rent as needed.
55 11.0% 31 12.4 24 9.6
I hope to share
community cars with
44 8.8% 30 12 14 5.6
customers and specific customer behaviors.
2/ Identify at least two (2) advantages the external sample has over your company’s
internal database that are critical to your objectives.
i. External sample gives me room to get additional information that couldn’t be
provided in the company’s internal data base.
ii. External sample gives me chance of determining individual customer moods and
lifestyles that couldn’t be provided by the internal sample.
iii. External sample gives me a data that I have full control over, unlike the internal
sample.
3/ Give two (2) examples of questions you asked the car owners among the general
population that you didn’t ask in the survey with the AMAZE455 owners.
a. As our model owner, what improvements would you wish from the car you own?
b. Do you appreciate the existence of AMAZE455 in Canada considering the products they
give to the market?
Q5:
1/ Fill in the percentages for each age cohort
Total
Respondents
#
% Total
Respondents
Age 25-39
Respondents
#
Age 25-
39
%
Age 40-54
Respondents
#
Age 40-
54
%
There would likely be no
change from today
139 27.8% 27 10.8 112 44.8
I will drive an electric /
hybrid car within the city
and a vehicle for long
distance travel on
highways
146 29.2% 85 34 61 24.4
My household would
share ONE electric /
hybrid vehicle
116 23.2% 77 30.8 39 15.6
My household would not
own vehicles. We would
rent as needed.
55 11.0% 31 12.4 24 9.6
I hope to share
community cars with
44 8.8% 30 12 14 5.6
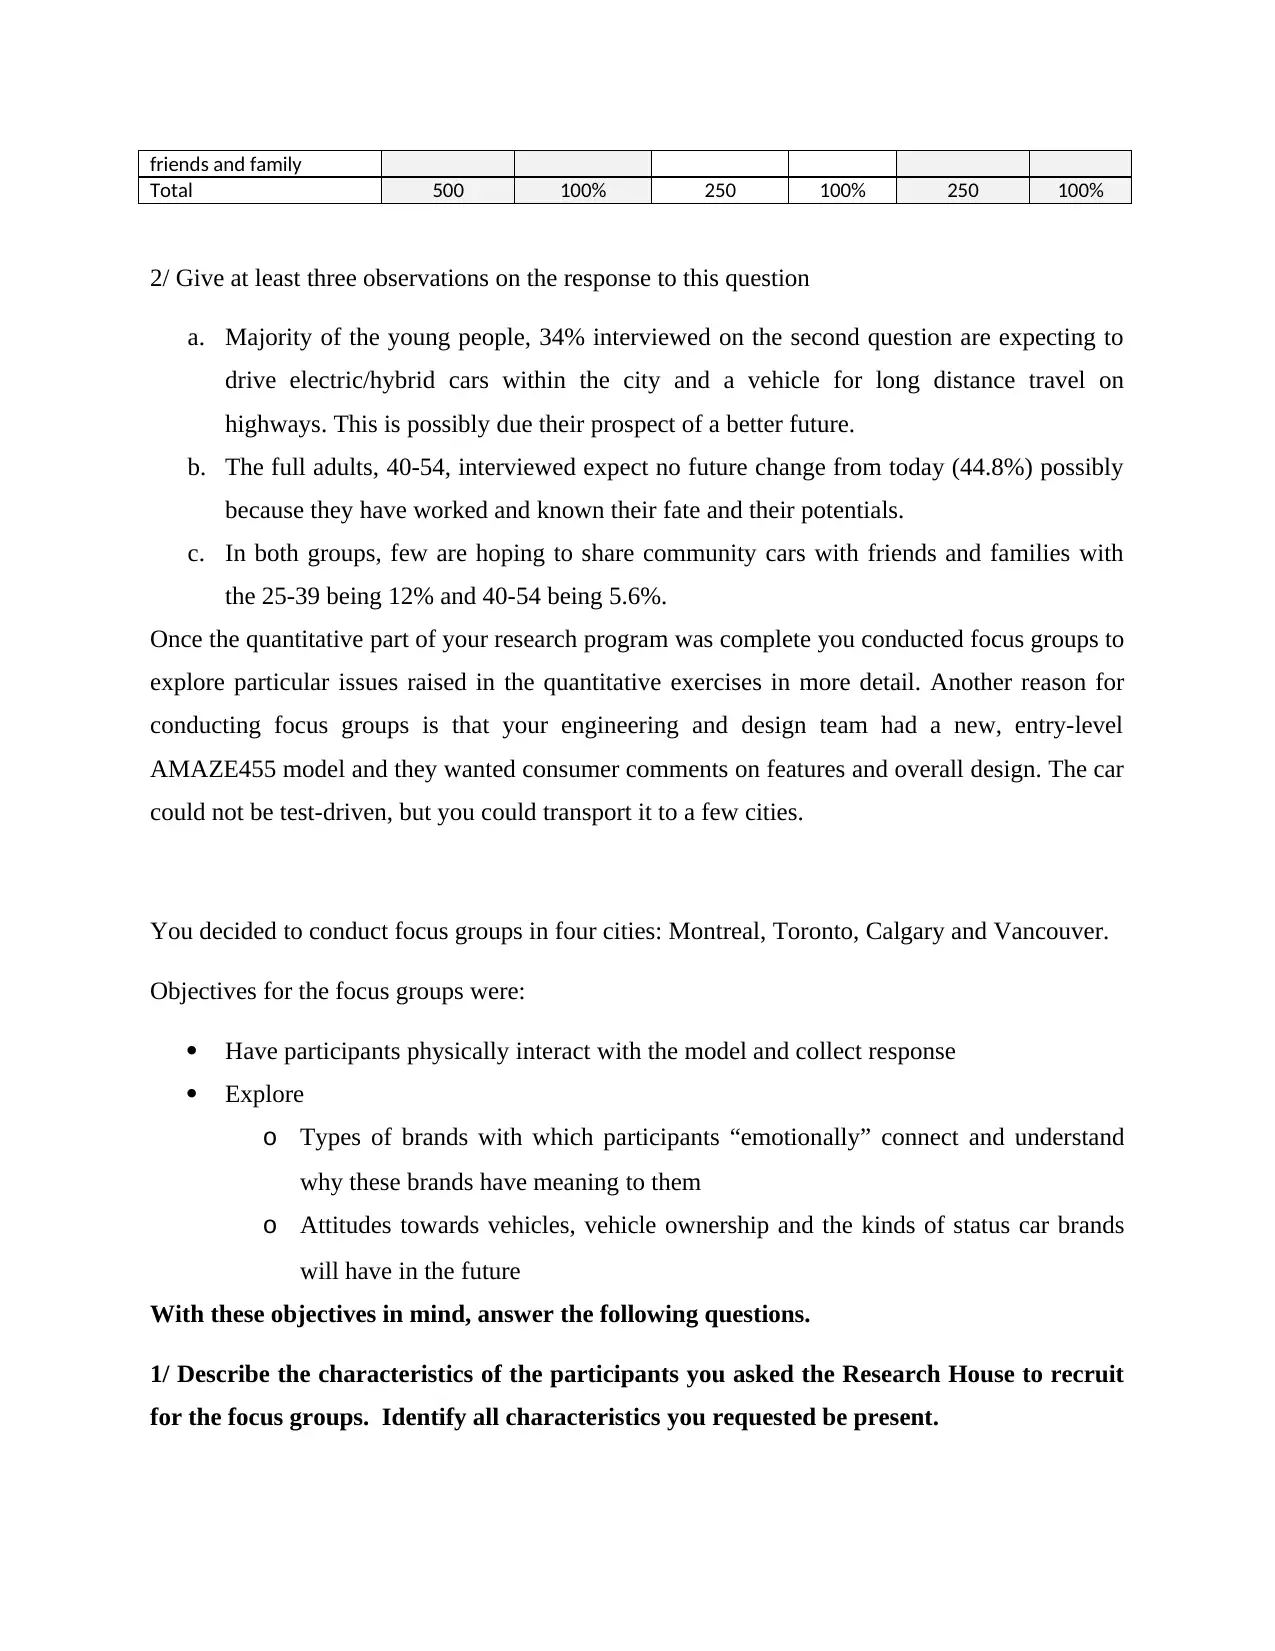
friends and family
Total 500 100% 250 100% 250 100%
2/ Give at least three observations on the response to this question
a. Majority of the young people, 34% interviewed on the second question are expecting to
drive electric/hybrid cars within the city and a vehicle for long distance travel on
highways. This is possibly due their prospect of a better future.
b. The full adults, 40-54, interviewed expect no future change from today (44.8%) possibly
because they have worked and known their fate and their potentials.
c. In both groups, few are hoping to share community cars with friends and families with
the 25-39 being 12% and 40-54 being 5.6%.
Once the quantitative part of your research program was complete you conducted focus groups to
explore particular issues raised in the quantitative exercises in more detail. Another reason for
conducting focus groups is that your engineering and design team had a new, entry-level
AMAZE455 model and they wanted consumer comments on features and overall design. The car
could not be test-driven, but you could transport it to a few cities.
You decided to conduct focus groups in four cities: Montreal, Toronto, Calgary and Vancouver.
Objectives for the focus groups were:
Have participants physically interact with the model and collect response
Explore
o Types of brands with which participants “emotionally” connect and understand
why these brands have meaning to them
o Attitudes towards vehicles, vehicle ownership and the kinds of status car brands
will have in the future
With these objectives in mind, answer the following questions.
1/ Describe the characteristics of the participants you asked the Research House to recruit
for the focus groups. Identify all characteristics you requested be present.
⊘ This is a preview!⊘
Do you want full access?
Subscribe today to unlock all pages.
Trusted by 1+ million students worldwide
A convenience sampling method will be applied in this case. I would therefore chose individuals
with knowledge about cars, more so, about the modelling features we need to add to the car.
Possibly I would go for individuals who have previously used our models of cars and who has
recommendations on which specific features to add to the currently-being manufactured model.
Finally, I’ll chose based on demographics, psychographics and purchase history.
2/ How many focus groups did you hold in each market? How did you organize the groups?
For example was each group comprised of people with the same characteristics? A mix of
characteristics? Why did you organize the groups this way? Describe your strategy.
In each market, I had one focus group. Each group contained six to ten people depending on the
market structure. I chose people with the only common factor being company customers.
Nonetheless, I considered people of diverse demography, psychographics, purchase history-
consistent and irregular customers, and based on their behavior. This was vital in helping me get
different answers and recommendations that are required.
3/ List five TOPICS with PROMPTS you asked the moderator to explore with each group.
You may use bullet points for the prompts.
a. The frequency of buying our cars. For instance, “Do you frequently buy from our
companies? How often?”
b. The changes required in our car models. For example, “Do wish for a change in our
existing models? Which changes?”
c. Past experience of the customer in our company. An example being, “Did you have a
better or poor experience when you purchased from us? Please explain?”
d. The brand that they prefer among our models. For instance, “Which brand do you love
most among our cars? Why?”
e. Emotional connection with our company cars. For example, “Do you have an emotional
connection with our brands? Why or why not?”
1 out of 7


Your All-in-One AI-Powered Toolkit for Academic Success.
+13062052269
info@desklib.com
Available 24*7 on WhatsApp / Email
![[object Object]](/_next/static/media/star-bottom.7253800d.svg)
Unlock your academic potential
Copyright © 2020–2026 A2Z Services. All Rights Reserved. Developed and managed by ZUCOL.