Corporate Finance Valuation Report
VerifiedAdded on 2019/12/18
|22
|4382
|212
Report
AI Summary
This corporate finance report assesses the valuation of Marks & Spencer (M&S) using multiple methodologies: Economic Value Added (EVA), Total Shareholder Return (TSR), Net Asset Value (NAV), comparable company ratios, and the Discounted Cash Flow (DCF) model. The EVA analysis reveals M&S's economic profit over five years, showing a trend of value creation but with a decline in recent years. The TSR analysis examines shareholder returns, including dividend payouts, indicating fluctuating returns over the period. NAV calculations demonstrate a generally increasing trend in net asset value per share. A comparison of M&S's financial ratios with competitors (Tesco and Sainsbury) reveals that M&S's price-to-earnings and price-to-book ratios are significantly higher. The DCF model, using forecasted free cash flows and a weighted average cost of capital (WACC), projects an intrinsic value per share significantly lower than the market price, suggesting that M&S is currently overvalued. The report concludes that while M&S showed strong performance in some areas, its current market price is not justified by its intrinsic value based on the DCF analysis.

CORPORATE FINANCE
1
1
Paraphrase This Document
Need a fresh take? Get an instant paraphrase of this document with our AI Paraphraser

Table of Contents
INTRODUCTION................................................................................................................................3
Economic value added analysis (EVA model)..................................................................................3
Total shareholders return..................................................................................................................4
Net Assets Value...............................................................................................................................5
Comparable ratio computations........................................................................................................6
Discounted cash flow model.............................................................................................................6
CONCLUSION....................................................................................................................................9
REFERENCES...................................................................................................................................10
APPENDIX.........................................................................................................................................11
Appendix: 1. EVA calculation.........................................................................................................11
Appendix: 2. Total shareholder return (TSR) analysis...................................................................14
Appendix: 3. Calculation of Net Assets Value (NAV)....................................................................17
Appendix: 4. Comparable ratios.....................................................................................................17
Appendix: 5. Discounted cash flow model (DCF).........................................................................18
Year on year growth........................................................................................................................19
% on sales.......................................................................................................................................20
2
INTRODUCTION
In the present market, companies face number of challenges & threats in the market, therefore, it seems really important for the
corporations to create an optimum capital structure. Establishments mainly fulfil their financial requirement through either long-term debt or
shareholders equity or a combination of both (Damodaran, 2016). M&S is the British retail organization that aims at rendering best quality
clothing, homeware & other products to satisfy globalized audience base. The aim of the present assignment is to apply various valuation
methodologies of corporate finance such as discounted cash flow model, enterprise value added model & total shareholder analysis to predict its
share price. On the basis of this, comparison will be made between the current stock price & it’s computed or derived value so as to identify that
whether it is overvalued or undervalued.
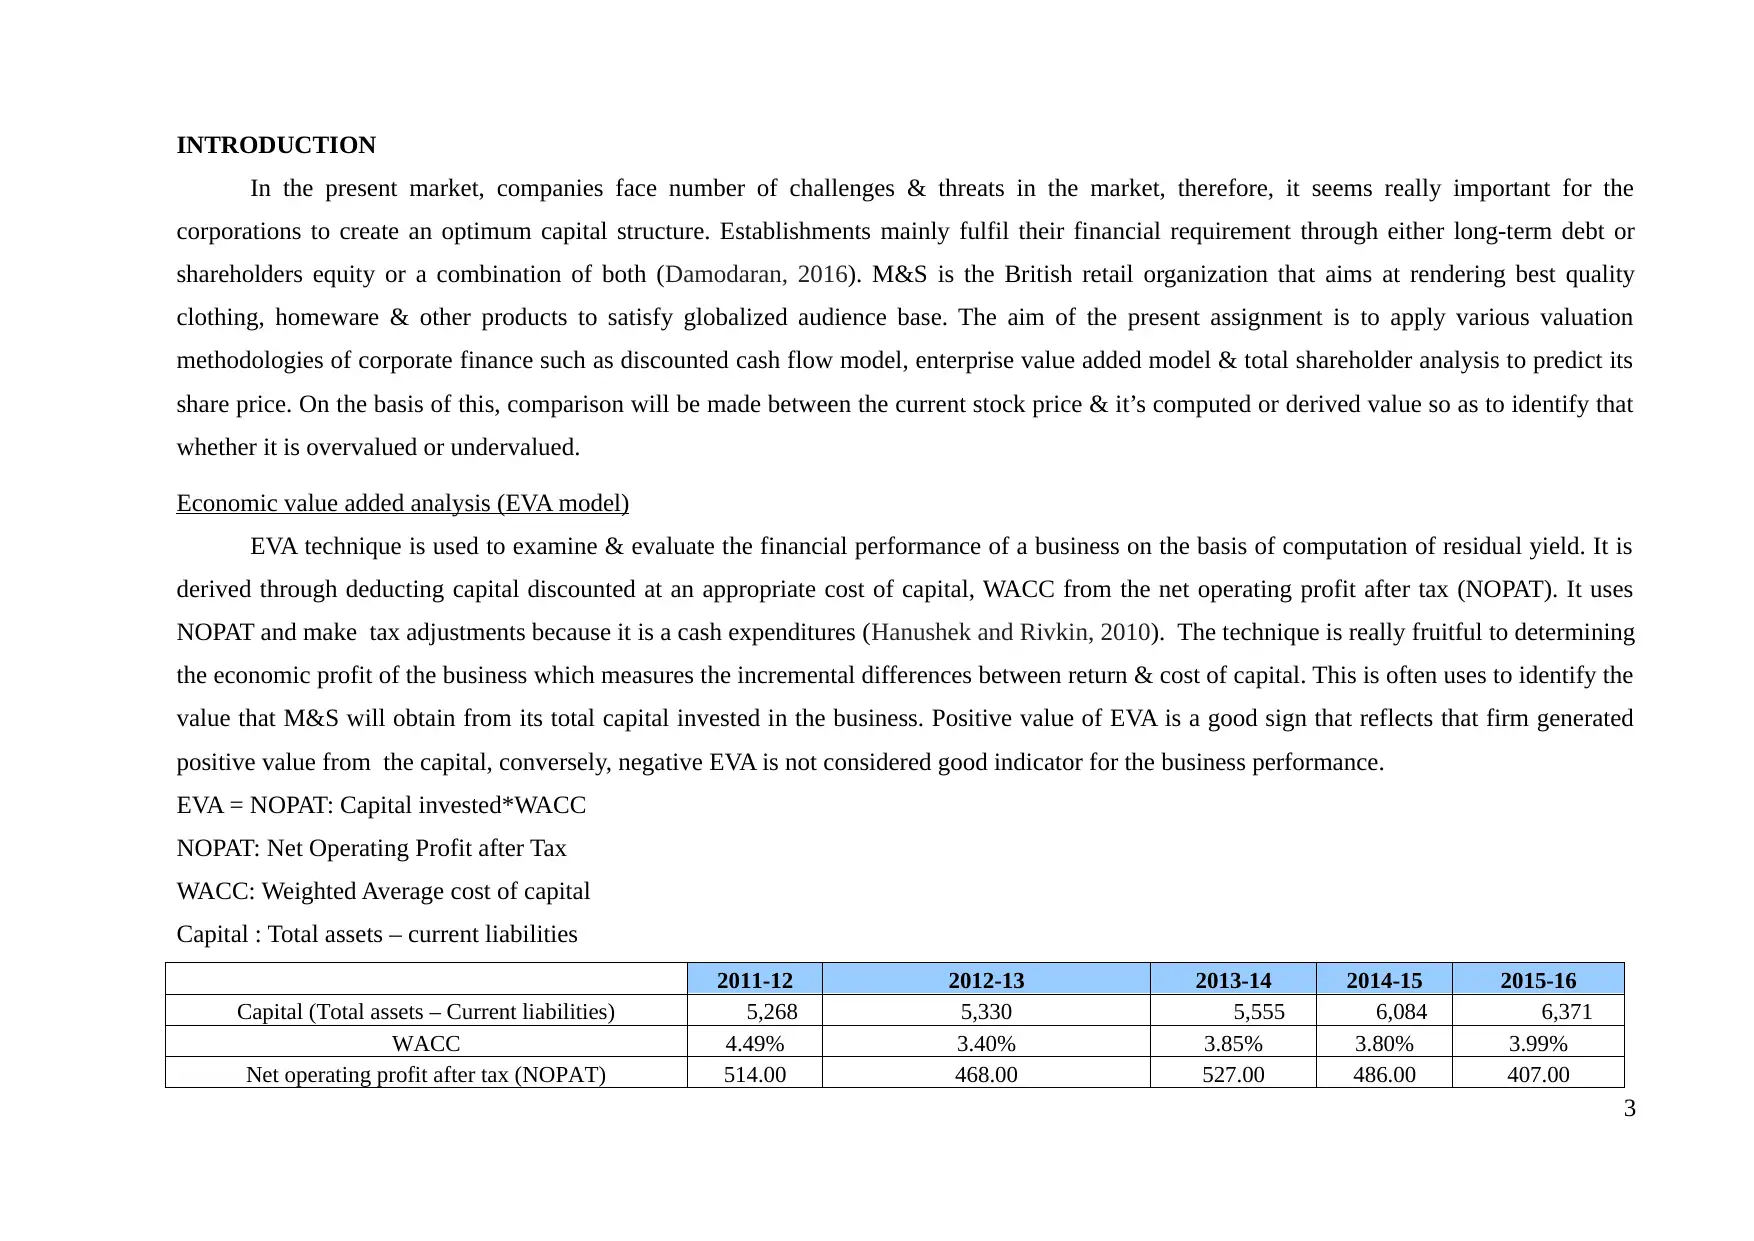
Economic value added analysis (EVA model)
EVA technique is used to examine & evaluate the financial performance of a business on the basis of computation of residual yield. It is
derived through deducting capital discounted at an appropriate cost of capital, WACC from the net operating profit after tax (NOPAT). It uses
NOPAT and make tax adjustments because it is a cash expenditures (Hanushek and Rivkin, 2010). The technique is really fruitful to determining
the economic profit of the business which measures the incremental differences between return & cost of capital. This is often uses to identify the
value that M&S will obtain from its total capital invested in the business. Positive value of EVA is a good sign that reflects that firm generated
positive value from the capital, conversely, negative EVA is not considered good indicator for the business performance.
EVA = NOPAT: Capital invested*WACC
NOPAT: Net Operating Profit after Tax
WACC: Weighted Average cost of capital
Capital : Total assets – current liabilities
2011-12 2012-13 2013-14 2014-15 2015-16
Capital (Total assets – Current liabilities) 5,268 5,330 5,555 6,084 6,371
WACC 4.49% 3.40% 3.85% 3.80% 3.99%
Net operating profit after tax (NOPAT) 514.00 468.00 527.00 486.00 407.00
3
In the present market, companies face number of challenges & threats in the market, therefore, it seems really important for the
corporations to create an optimum capital structure. Establishments mainly fulfil their financial requirement through either long-term debt or
shareholders equity or a combination of both (Damodaran, 2016). M&S is the British retail organization that aims at rendering best quality
clothing, homeware & other products to satisfy globalized audience base. The aim of the present assignment is to apply various valuation
methodologies of corporate finance such as discounted cash flow model, enterprise value added model & total shareholder analysis to predict its
share price. On the basis of this, comparison will be made between the current stock price & it’s computed or derived value so as to identify that
whether it is overvalued or undervalued.
Economic value added analysis (EVA model)
EVA technique is used to examine & evaluate the financial performance of a business on the basis of computation of residual yield. It is
derived through deducting capital discounted at an appropriate cost of capital, WACC from the net operating profit after tax (NOPAT). It uses
NOPAT and make tax adjustments because it is a cash expenditures (Hanushek and Rivkin, 2010). The technique is really fruitful to determining
the economic profit of the business which measures the incremental differences between return & cost of capital. This is often uses to identify the
value that M&S will obtain from its total capital invested in the business. Positive value of EVA is a good sign that reflects that firm generated
positive value from the capital, conversely, negative EVA is not considered good indicator for the business performance.
EVA = NOPAT: Capital invested*WACC
NOPAT: Net Operating Profit after Tax
WACC: Weighted Average cost of capital
Capital : Total assets – current liabilities
2011-12 2012-13 2013-14 2014-15 2015-16
Capital (Total assets – Current liabilities) 5,268 5,330 5,555 6,084 6,371
WACC 4.49% 3.40% 3.85% 3.80% 3.99%
Net operating profit after tax (NOPAT) 514.00 468.00 527.00 486.00 407.00
3
⊘ This is a preview!⊘
Do you want full access?
Subscribe today to unlock all pages.
Trusted by 1+ million students worldwide
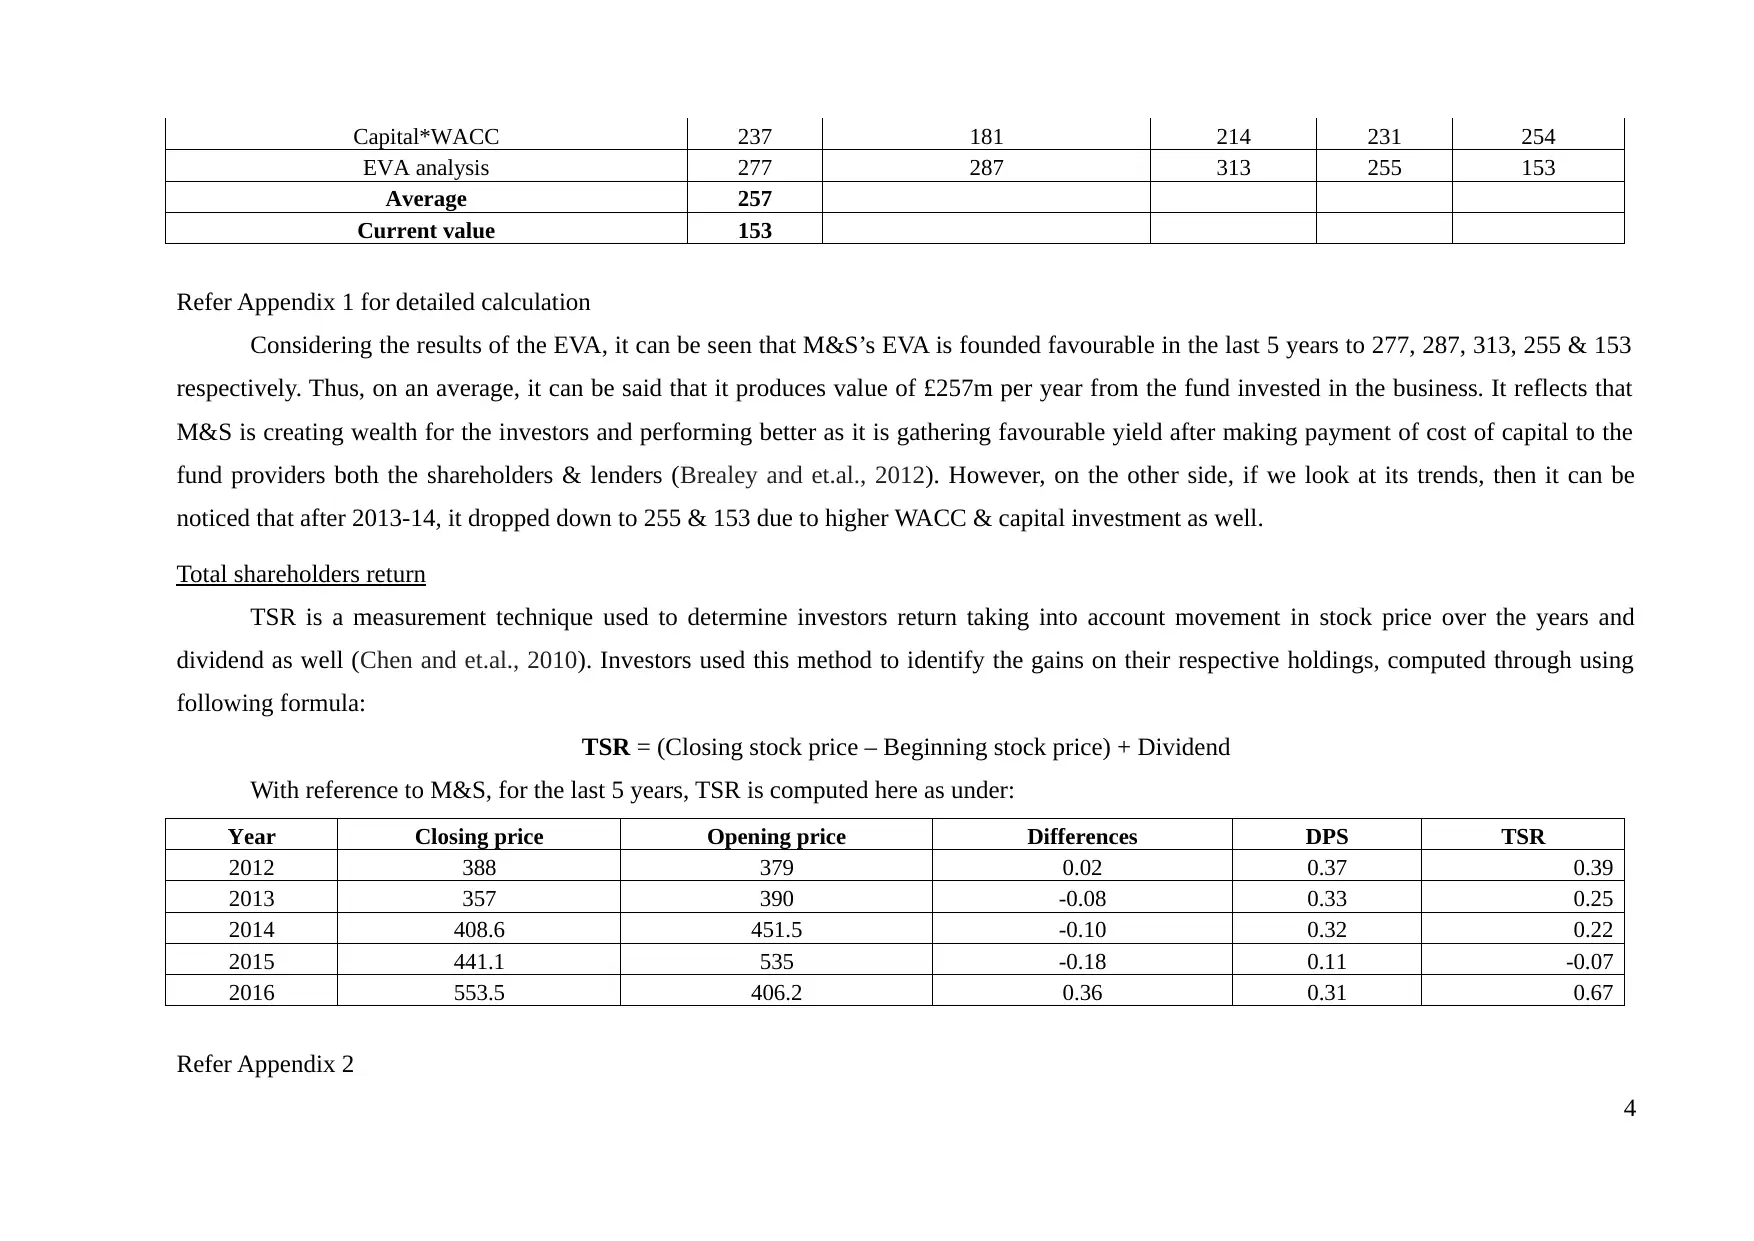
Capital*WACC 237 181 214 231 254
EVA analysis 277 287 313 255 153
Average 257
Current value 153
Refer Appendix 1 for detailed calculation
Considering the results of the EVA, it can be seen that M&S’s EVA is founded favourable in the last 5 years to 277, 287, 313, 255 & 153
respectively. Thus, on an average, it can be said that it produces value of £257m per year from the fund invested in the business. It reflects that
M&S is creating wealth for the investors and performing better as it is gathering favourable yield after making payment of cost of capital to the
fund providers both the shareholders & lenders (Brealey and et.al., 2012). However, on the other side, if we look at its trends, then it can be
noticed that after 2013-14, it dropped down to 255 & 153 due to higher WACC & capital investment as well.
Total shareholders return
TSR is a measurement technique used to determine investors return taking into account movement in stock price over the years and
dividend as well (Chen and et.al., 2010). Investors used this method to identify the gains on their respective holdings, computed through using
following formula:
TSR = (Closing stock price – Beginning stock price) + Dividend
With reference to M&S, for the last 5 years, TSR is computed here as under:
Year Closing price Opening price Differences DPS TSR
2012 388 379 0.02 0.37 0.39
2013 357 390 -0.08 0.33 0.25
2014 408.6 451.5 -0.10 0.32 0.22
2015 441.1 535 -0.18 0.11 -0.07
2016 553.5 406.2 0.36 0.31 0.67
Refer Appendix 2
4
Paraphrase This Document
Need a fresh take? Get an instant paraphrase of this document with our AI Paraphraser
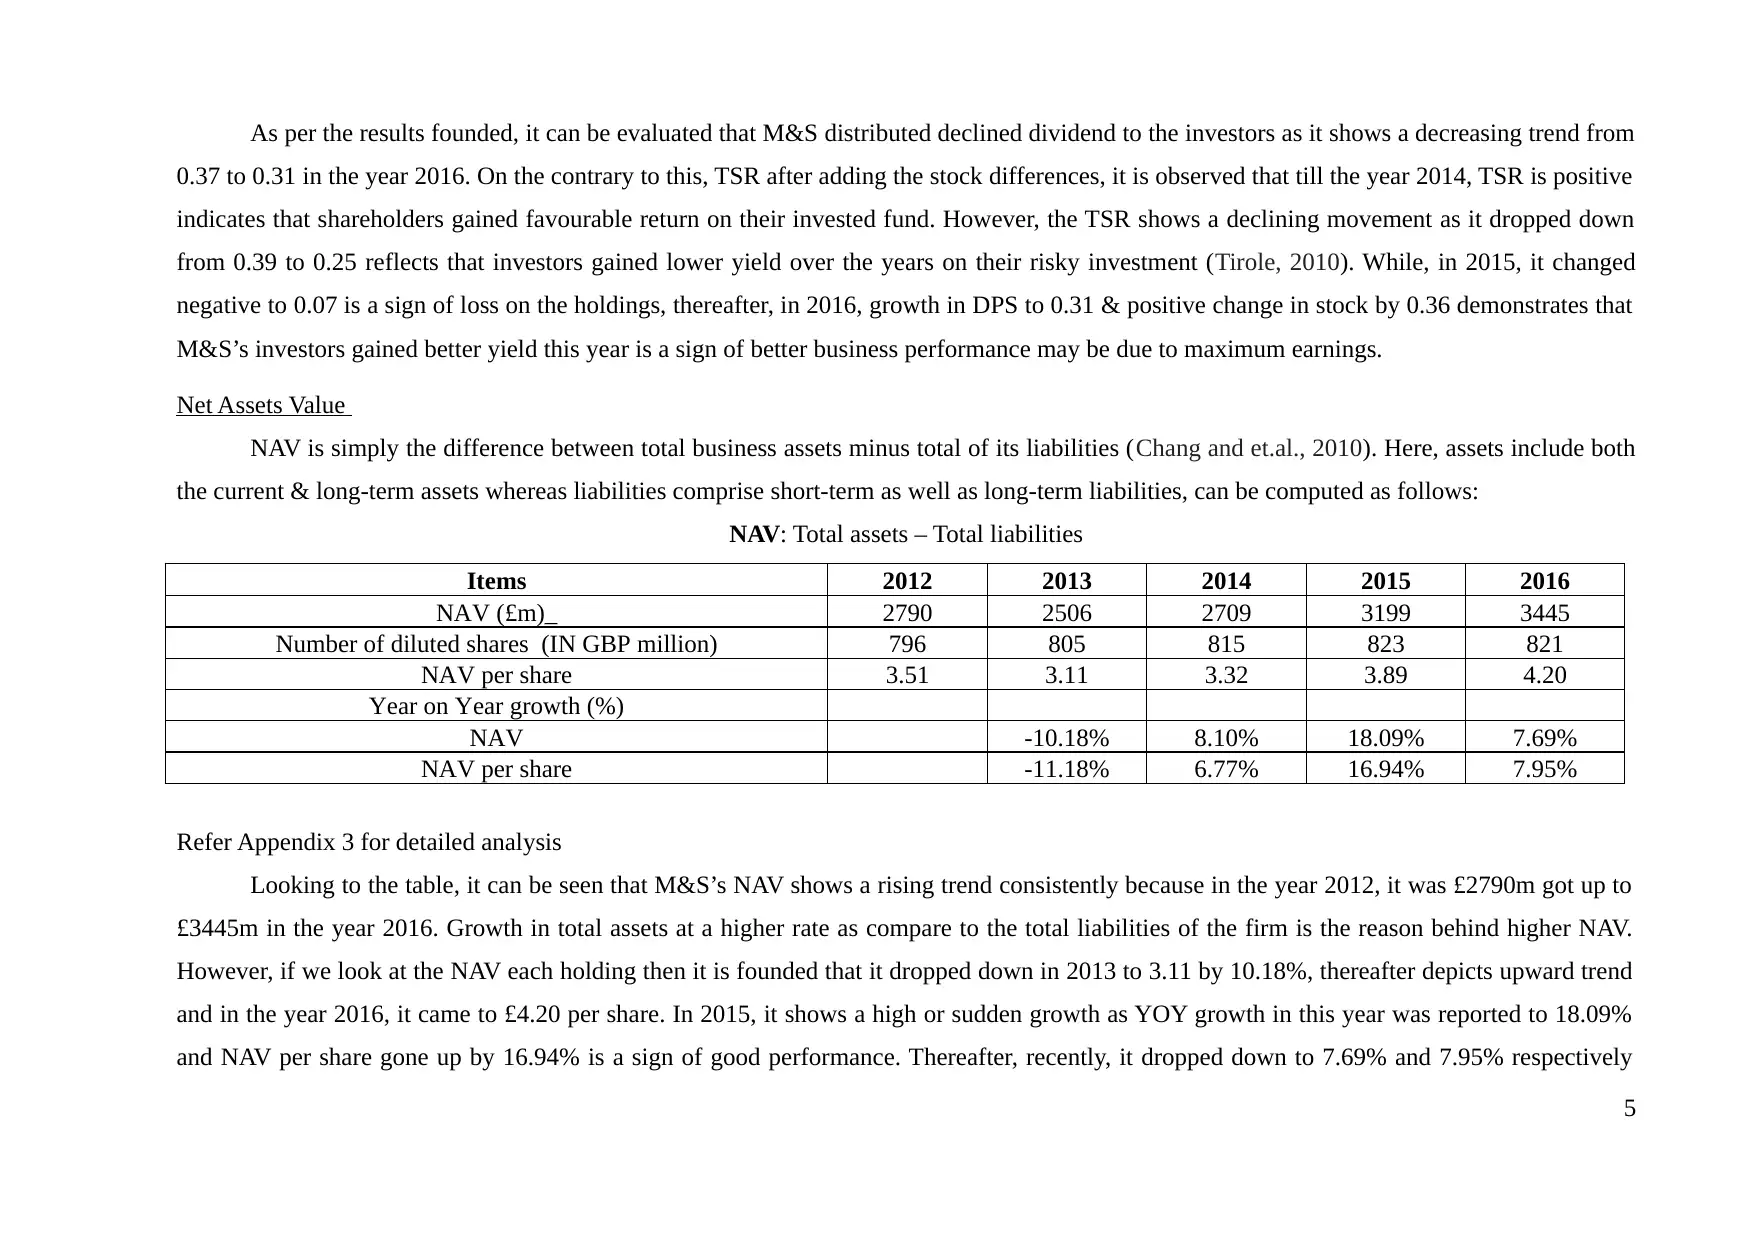
As per the results founded, it can be evaluated that M&S distributed declined dividend to the investors as it shows a decreasing trend from
0.37 to 0.31 in the year 2016. On the contrary to this, TSR after adding the stock differences, it is observed that till the year 2014, TSR is positive
indicates that shareholders gained favourable return on their invested fund. However, the TSR shows a declining movement as it dropped down
from 0.39 to 0.25 reflects that investors gained lower yield over the years on their risky investment (Tirole, 2010). While, in 2015, it changed
negative to 0.07 is a sign of loss on the holdings, thereafter, in 2016, growth in DPS to 0.31 & positive change in stock by 0.36 demonstrates that
M&S’s investors gained better yield this year is a sign of better business performance may be due to maximum earnings.
Net Assets Value
NAV is simply the difference between total business assets minus total of its liabilities (Chang and et.al., 2010). Here, assets include both
the current & long-term assets whereas liabilities comprise short-term as well as long-term liabilities, can be computed as follows:
NAV: Total assets – Total liabilities
Items 2012 2013 2014 2015 2016
NAV (£m)_ 2790 2506 2709 3199 3445
Number of diluted shares (IN GBP million) 796 805 815 823 821
NAV per share 3.51 3.11 3.32 3.89 4.20
Year on Year growth (%)
NAV -10.18% 8.10% 18.09% 7.69%
NAV per share -11.18% 6.77% 16.94% 7.95%
Refer Appendix 3 for detailed analysis
Looking to the table, it can be seen that M&S’s NAV shows a rising trend consistently because in the year 2012, it was £2790m got up to
£3445m in the year 2016. Growth in total assets at a higher rate as compare to the total liabilities of the firm is the reason behind higher NAV.
However, if we look at the NAV each holding then it is founded that it dropped down in 2013 to 3.11 by 10.18%, thereafter depicts upward trend
and in the year 2016, it came to £4.20 per share. In 2015, it shows a high or sudden growth as YOY growth in this year was reported to 18.09%
and NAV per share gone up by 16.94% is a sign of good performance. Thereafter, recently, it dropped down to 7.69% and 7.95% respectively
5
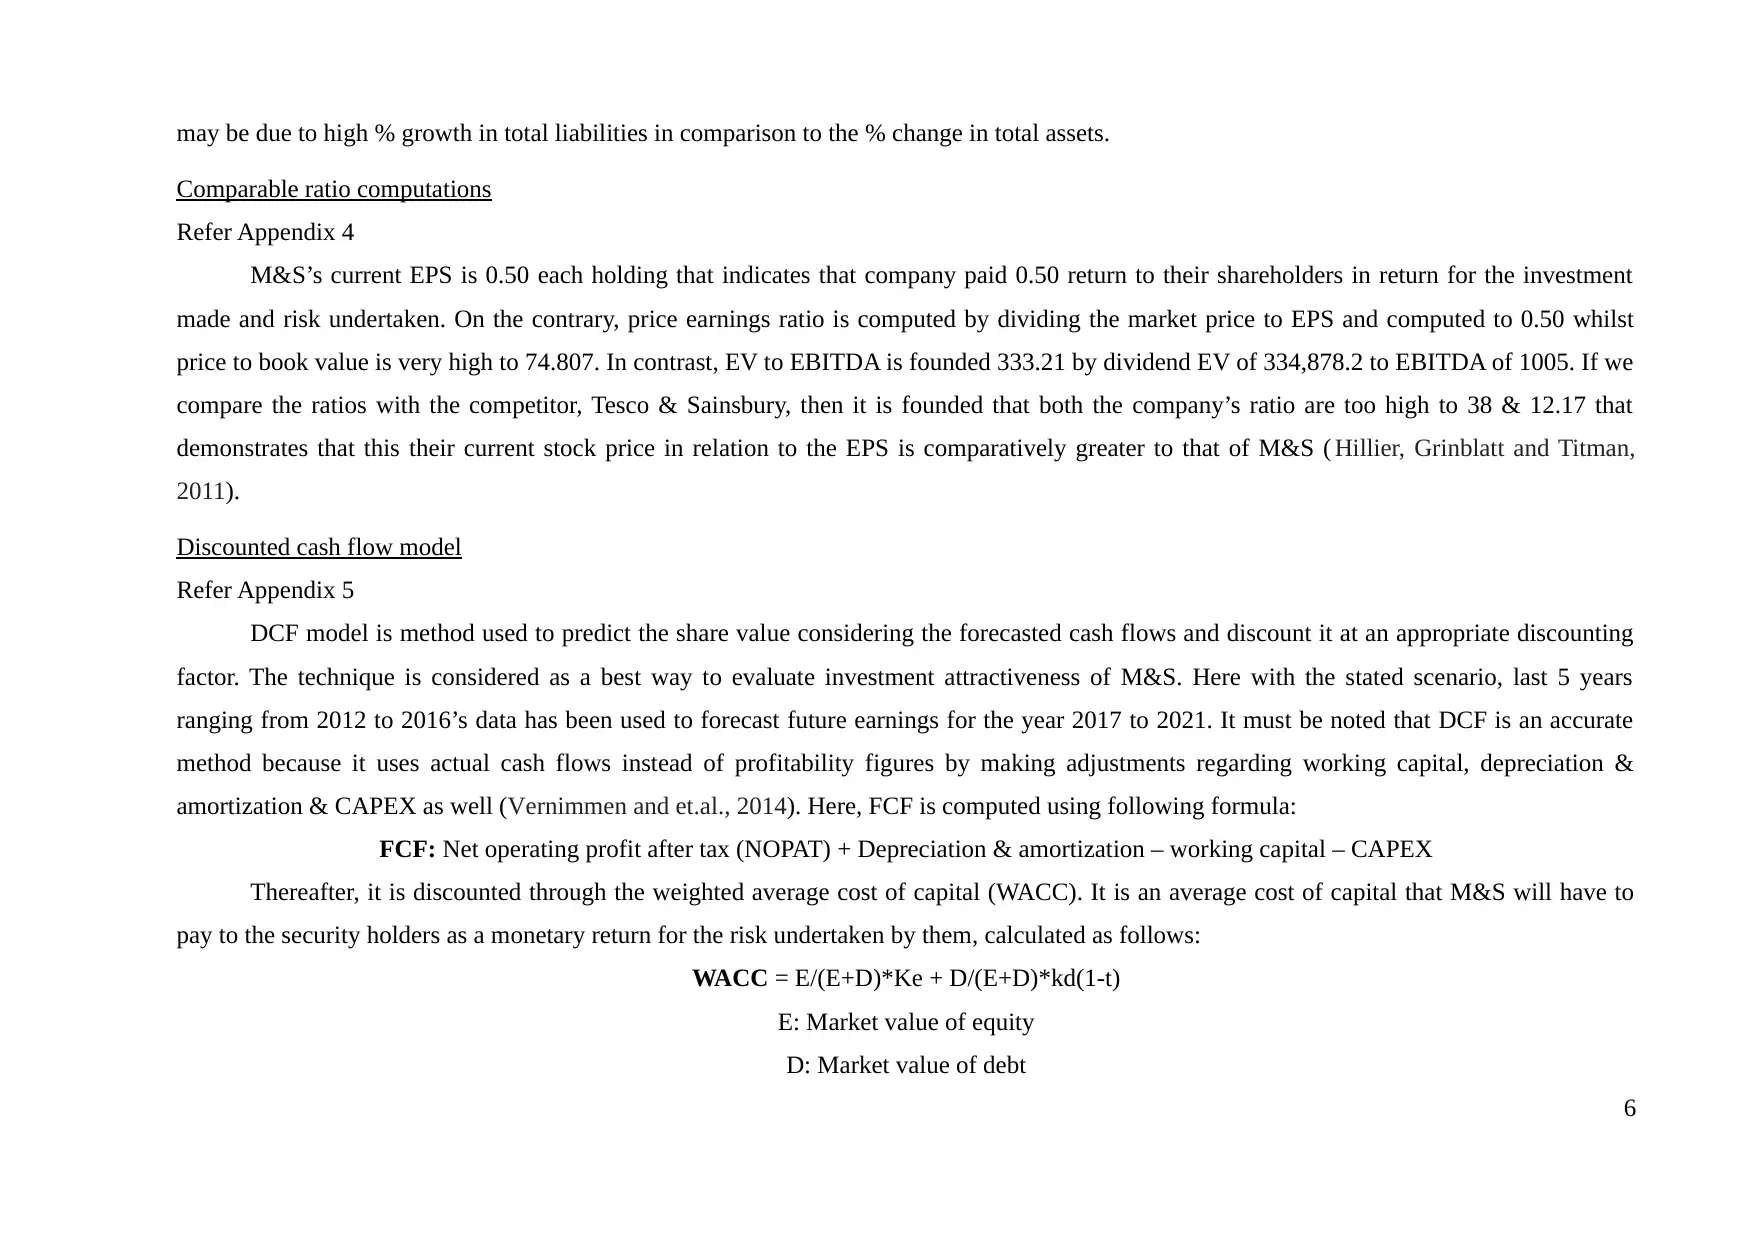
may be due to high % growth in total liabilities in comparison to the % change in total assets.
Comparable ratio computations
Refer Appendix 4
M&S’s current EPS is 0.50 each holding that indicates that company paid 0.50 return to their shareholders in return for the investment
made and risk undertaken. On the contrary, price earnings ratio is computed by dividing the market price to EPS and computed to 0.50 whilst
price to book value is very high to 74.807. In contrast, EV to EBITDA is founded 333.21 by dividend EV of 334,878.2 to EBITDA of 1005. If we
compare the ratios with the competitor, Tesco & Sainsbury, then it is founded that both the company’s ratio are too high to 38 & 12.17 that
demonstrates that this their current stock price in relation to the EPS is comparatively greater to that of M&S ( Hillier, Grinblatt and Titman,
2011).
Discounted cash flow model
Refer Appendix 5
DCF model is method used to predict the share value considering the forecasted cash flows and discount it at an appropriate discounting
factor. The technique is considered as a best way to evaluate investment attractiveness of M&S. Here with the stated scenario, last 5 years
ranging from 2012 to 2016’s data has been used to forecast future earnings for the year 2017 to 2021. It must be noted that DCF is an accurate
method because it uses actual cash flows instead of profitability figures by making adjustments regarding working capital, depreciation &
amortization & CAPEX as well (Vernimmen and et.al., 2014). Here, FCF is computed using following formula:
FCF: Net operating profit after tax (NOPAT) + Depreciation & amortization – working capital – CAPEX
Thereafter, it is discounted through the weighted average cost of capital (WACC). It is an average cost of capital that M&S will have to
pay to the security holders as a monetary return for the risk undertaken by them, calculated as follows:
WACC = E/(E+D)*Ke + D/(E+D)*kd(1-t)
E: Market value of equity
D: Market value of debt
6
⊘ This is a preview!⊘
Do you want full access?
Subscribe today to unlock all pages.
Trusted by 1+ million students worldwide

Kd: Cost of debt
T: Taxation rate
Justification for the assumptions
Historical trend in growth in sales of M&S has been derived to 0.94%, 2.82%, 0.01% & 2.37%, however, as per the growth of the retail
sector, high consumer demand and its contribution to the UK GDP, there is a probability that in the future years, sales of the industry will
grow up by 3.40% YOY basis (Retail economic, 2016).
Previous trend depicts M&S’s % cost on sales shows a rising trend and in the forthcoming years, it is predicted that cost of sales wuill
grow up by 0.10% on annul basis. Therefore, in all the explicit forecasted years from 2017 to 2021, cost of sales has been taken as 1.90%,
2.00%, 2.10%, 2.20% and 2.30% respectively (UK inflation rate, 2026).
Interest expenditures have been estimated to grow at an average % growth of the historical 5 years by 1.14%. Similarly, other revenues,
PFT & other items predicted to rise at an annual growth rate of 0.80%, 1.08% & 0.12% respectively.
Working capital is also necessary for the M&S to run their regular business activities and operations, therefore, last 5 year’s average to
0.68% has been used for the prediction.
CAPEX and depreciation has been increased at 5% & 3% respectively looking to the historical trends of the previous period.
Weightage average cost of capital
E/(D+E) @ Enterprise Value 99.48%
D/(D+E) @ Enterprise Value 0.52%
Interest Rate (%) 6.12%
Tax Rate (@) 20%
WACC Calculation 4.0%
As per the founded results, it can be seen that M&S is required to pay 4% on the total capital employed to the capital contributors.
Terminal value: It indicates the value that is expected to be obtained by M&S after an explicit or estimated period of life for the
7
Paraphrase This Document
Need a fresh take? Get an instant paraphrase of this document with our AI Paraphraser
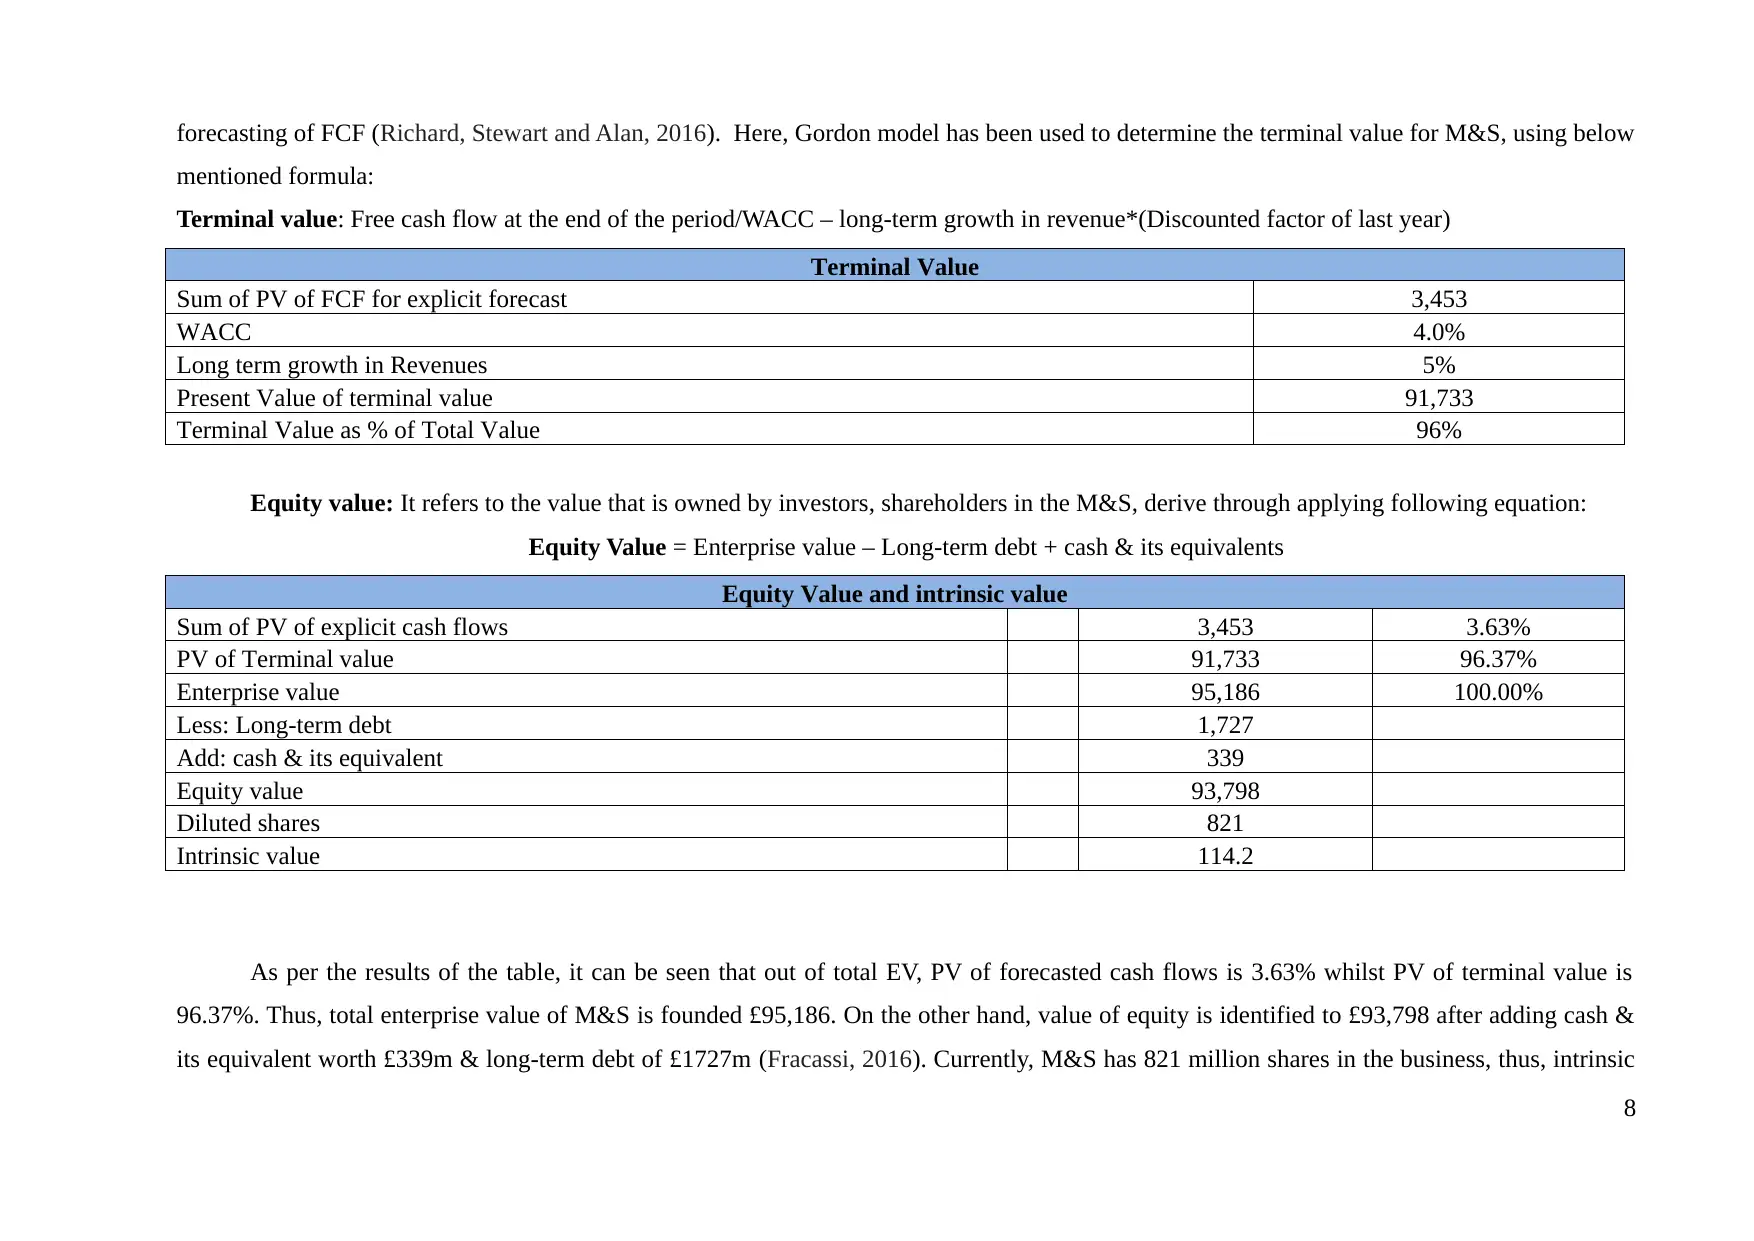
forecasting of FCF (Richard, Stewart and Alan, 2016). Here, Gordon model has been used to determine the terminal value for M&S, using below
mentioned formula:
Terminal value: Free cash flow at the end of the period/WACC – long-term growth in revenue*(Discounted factor of last year)
Terminal Value
Sum of PV of FCF for explicit forecast 3,453
WACC 4.0%
Long term growth in Revenues 5%
Present Value of terminal value 91,733
Terminal Value as % of Total Value 96%
Equity value: It refers to the value that is owned by investors, shareholders in the M&S, derive through applying following equation:
Equity Value = Enterprise value – Long-term debt + cash & its equivalents
Equity Value and intrinsic value
Sum of PV of explicit cash flows 3,453 3.63%
PV of Terminal value 91,733 96.37%
Enterprise value 95,186 100.00%
Less: Long-term debt 1,727
Add: cash & its equivalent 339
Equity value 93,798
Diluted shares 821
Intrinsic value 114.2
As per the results of the table, it can be seen that out of total EV, PV of forecasted cash flows is 3.63% whilst PV of terminal value is
96.37%. Thus, total enterprise value of M&S is founded £95,186. On the other hand, value of equity is identified to £93,798 after adding cash &
its equivalent worth £339m & long-term debt of £1727m (Fracassi, 2016). Currently, M&S has 821 million shares in the business, thus, intrinsic
8
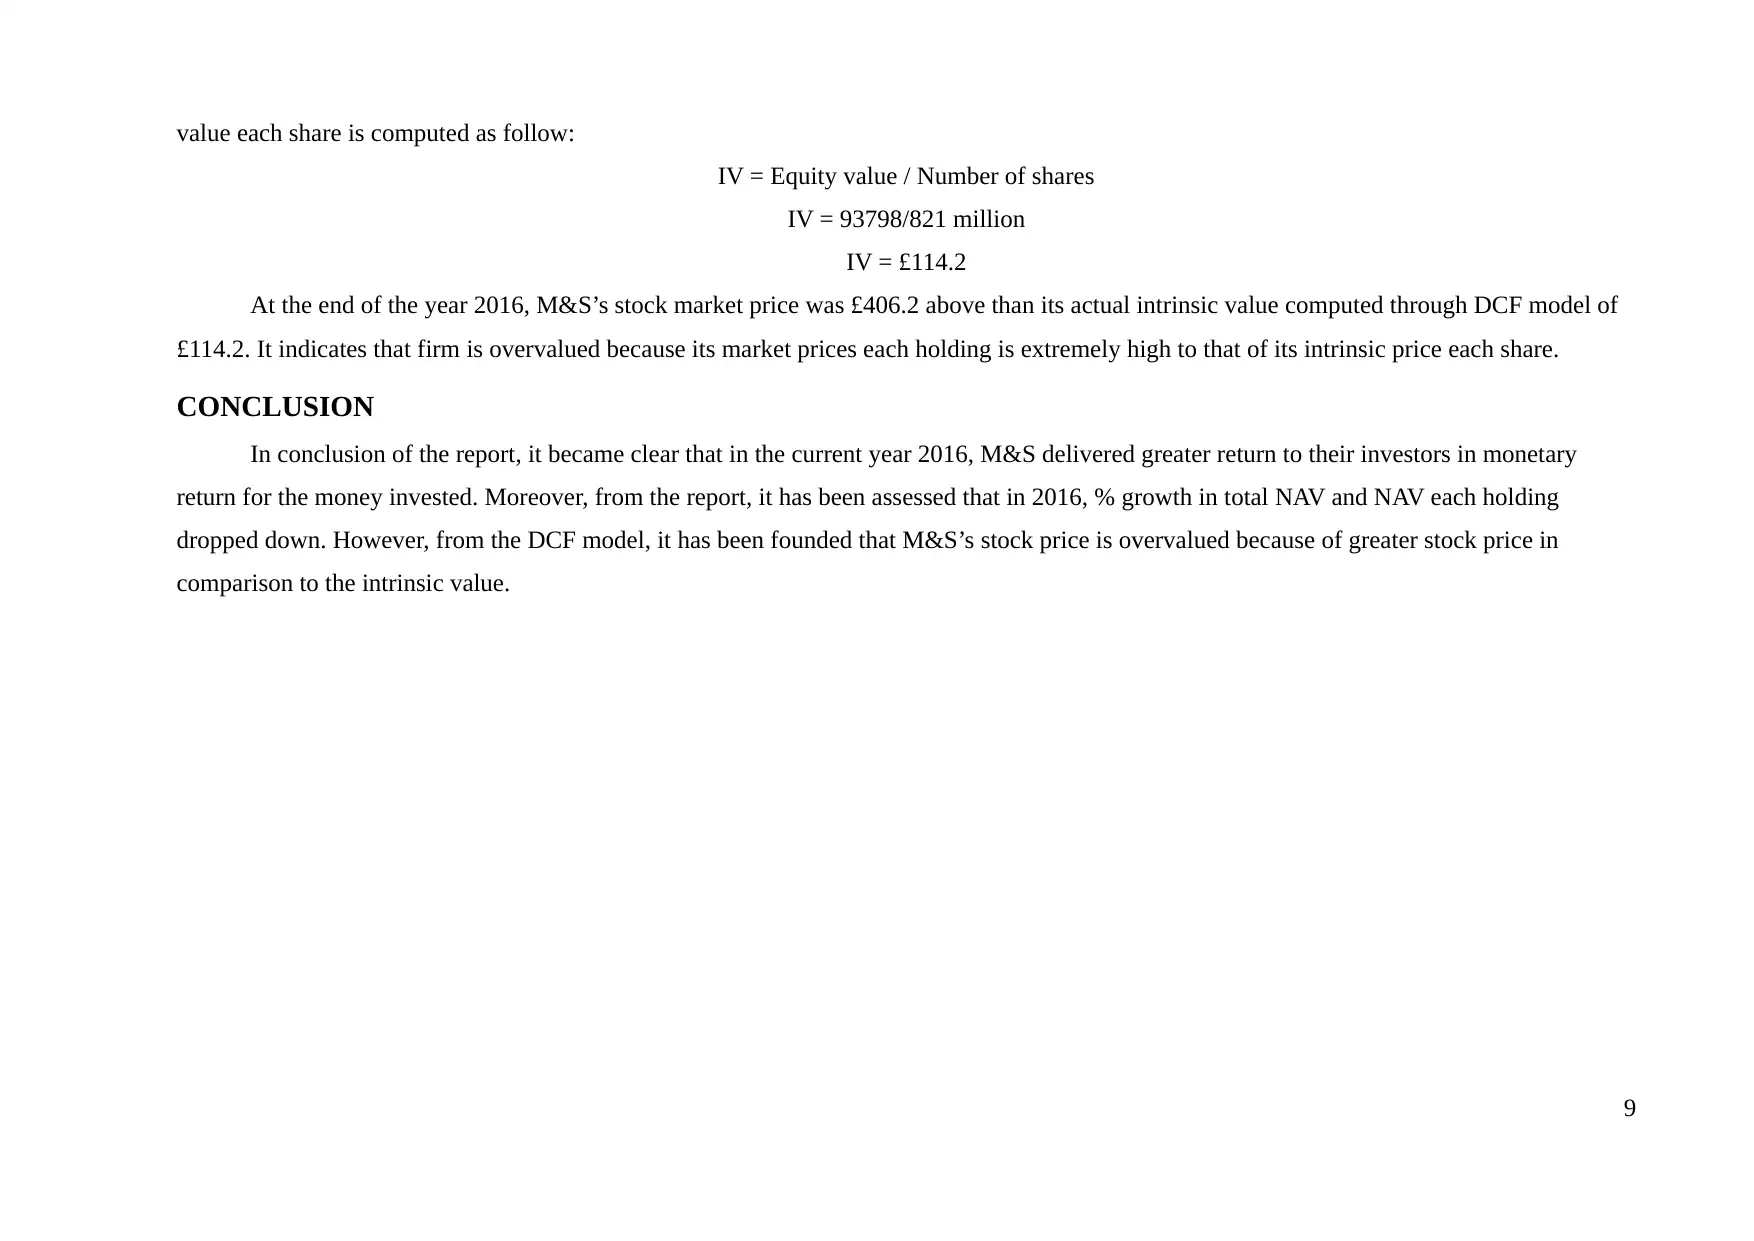
value each share is computed as follow:
IV = Equity value / Number of shares
IV = 93798/821 million
IV = £114.2
At the end of the year 2016, M&S’s stock market price was £406.2 above than its actual intrinsic value computed through DCF model of
£114.2. It indicates that firm is overvalued because its market prices each holding is extremely high to that of its intrinsic price each share.
CONCLUSION
In conclusion of the report, it became clear that in the current year 2016, M&S delivered greater return to their investors in monetary
return for the money invested. Moreover, from the report, it has been assessed that in 2016, % growth in total NAV and NAV each holding
dropped down. However, from the DCF model, it has been founded that M&S’s stock price is overvalued because of greater stock price in
comparison to the intrinsic value.
9
⊘ This is a preview!⊘
Do you want full access?
Subscribe today to unlock all pages.
Trusted by 1+ million students worldwide
REFERENCES
Books and Journals
Brealey, R.A., Myers, S.C., Allen, F. and Mohanty, P., 2012. Principles of corporate finance. Tata McGraw-Hill Education.
Chang, C.T. and et.al., 2010. Optimal ordering policies for deteriorating items using a discounted cash-flow analysis when a trade credit is linked
to order quantity. Computers & Industrial Engineering. 59(4). pp.770-777.
Chen, W.N and et.al., 2010. Optimizing discounted cash flows in project scheduling—an ant colony optimization approach. IEEE Transactions
on Systems, Man, and Cybernetics, Part C (Applications and Reviews). 40(1). pp.64-77.
Damodaran, A., 2016. Damodaran on valuation: security analysis for investment and corporate finance. (324). John Wiley & Sons.
Fracassi, C., 2016. Corporate finance policies and social networks.Management Science. Princeton University Press.
Hanushek, E.A. and Rivkin, S.G., 2010. Generalizations about using value-added measures of teacher quality. The American Economic Review.
100(2). pp.267-271.
Hillier, D., Grinblatt, M. and Titman, S., 2011. Financial markets and corporate strategy. McGraw Hill.
Richard, A.B., Stewart, C.M. and Alan, J.M., 2016. Fundamentals of corporate finance. McGraw Hill.
Tirole, J., 2010. The theory of corporate finance. Princeton University Press.
Vernimmen, P. and et.al., 2014.Corporate finance: theory and practice. John Wiley & Sons..
Online
Retail economic. 2016. [Online]. Available through : http://www.retaileconomics.co.uk/library-retail-stats-and-facts.asp. [Accessed on 16th
February 2017].
UK inflation rate. 2026. [Online]. Available through: http://www.tradingeconomics.com/united-kingdom/inflation-cpi/forecast. [Accessed on
16th February 2017].
APPENDIX
Appendix: 1. EVA calculation
Enterprise Value (EV) 2015-16
10
Paraphrase This Document
Need a fresh take? Get an instant paraphrase of this document with our AI Paraphraser
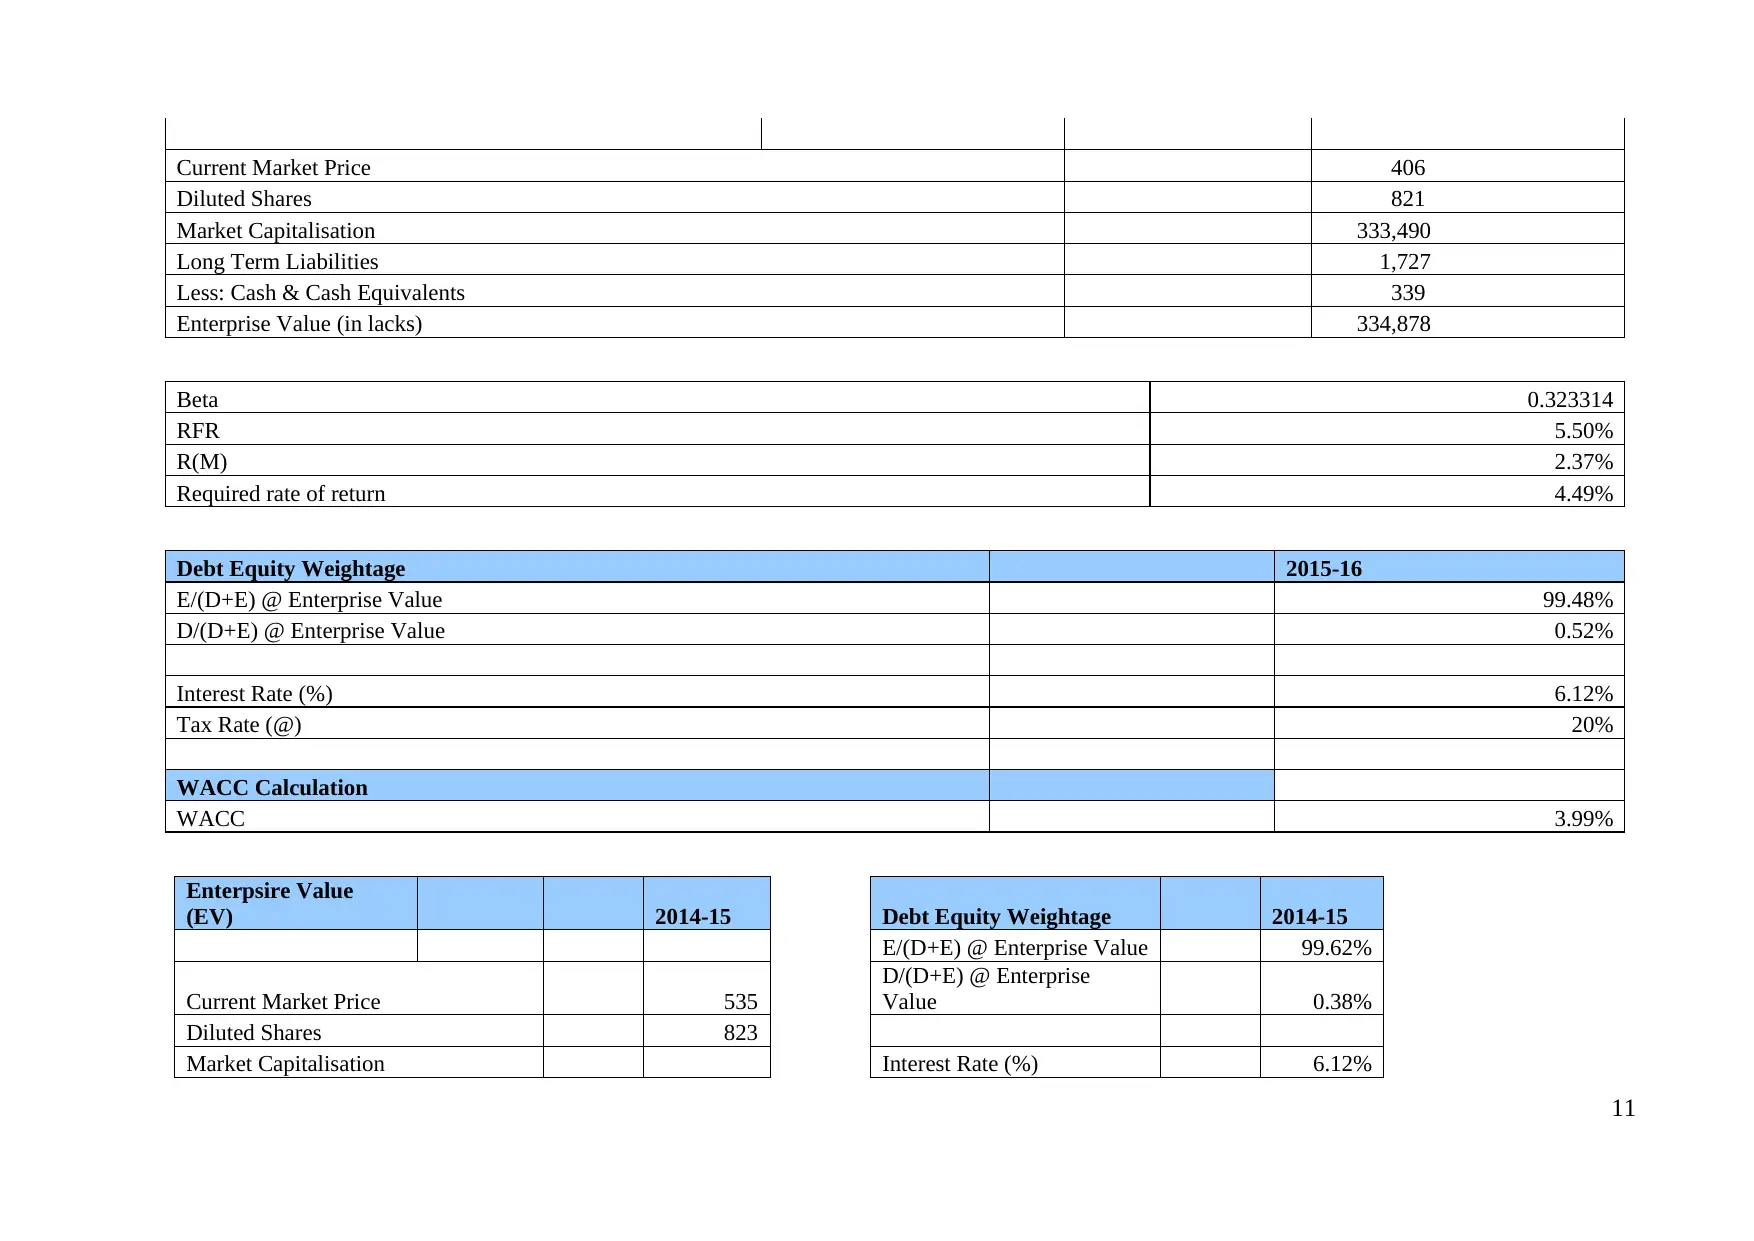
Current Market Price 406
Diluted Shares 821
Market Capitalisation 333,490
Long Term Liabilities 1,727
Less: Cash & Cash Equivalents 339
Enterprise Value (in lacks) 334,878
Beta 0.323314
RFR 5.50%
R(M) 2.37%
Required rate of return 4.49%
Debt Equity Weightage 2015-16
E/(D+E) @ Enterprise Value 99.48%
D/(D+E) @ Enterprise Value 0.52%
Interest Rate (%) 6.12%
Tax Rate (@) 20%
WACC Calculation
WACC 3.99%
Enterpsire Value
(EV) 2014-15 Debt Equity Weightage 2014-15
E/(D+E) @ Enterprise Value 99.62%
Current Market Price 535
D/(D+E) @ Enterprise
Value 0.38%
Diluted Shares 823
Market Capitalisation Interest Rate (%) 6.12%
11
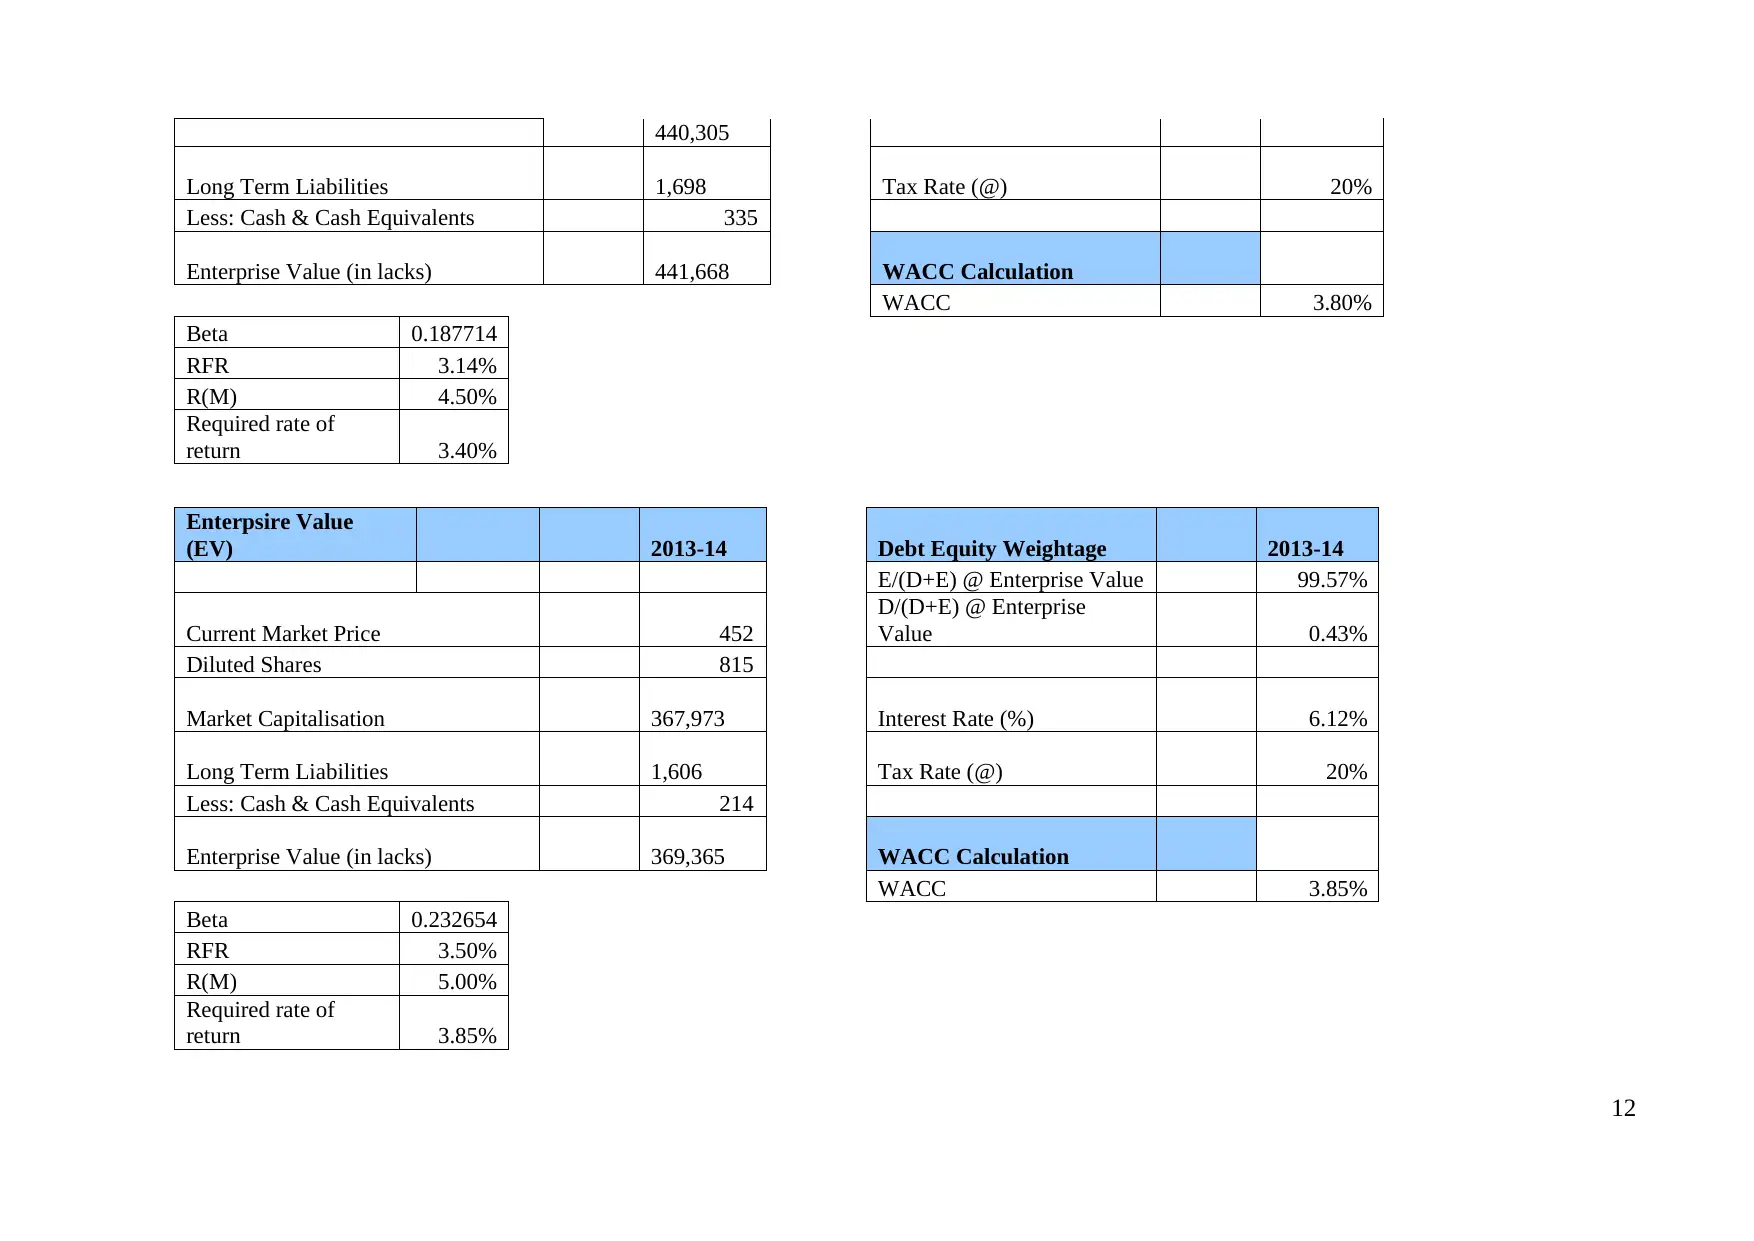
440,305
Long Term Liabilities 1,698 Tax Rate (@) 20%
Less: Cash & Cash Equivalents 335
Enterprise Value (in lacks) 441,668 WACC Calculation
WACC 3.80%
Beta 0.187714
RFR 3.14%
R(M) 4.50%
Required rate of
return 3.40%
Enterpsire Value
(EV) 2013-14 Debt Equity Weightage 2013-14
E/(D+E) @ Enterprise Value 99.57%
Current Market Price 452
D/(D+E) @ Enterprise
Value 0.43%
Diluted Shares 815
Market Capitalisation 367,973 Interest Rate (%) 6.12%
Long Term Liabilities 1,606 Tax Rate (@) 20%
Less: Cash & Cash Equivalents 214
Enterprise Value (in lacks) 369,365 WACC Calculation
WACC 3.85%
Beta 0.232654
RFR 3.50%
R(M) 5.00%
Required rate of
return 3.85%
12
⊘ This is a preview!⊘
Do you want full access?
Subscribe today to unlock all pages.
Trusted by 1+ million students worldwide
1 out of 22
Related Documents


Your All-in-One AI-Powered Toolkit for Academic Success.
+13062052269
info@desklib.com
Available 24*7 on WhatsApp / Email
![[object Object]](/_next/static/media/star-bottom.7253800d.svg)
Unlock your academic potential
Copyright © 2020–2026 A2Z Services. All Rights Reserved. Developed and managed by ZUCOL.