Finance for Decision Makers: M&S Financial Performance Report
VerifiedAdded on 2023/01/10
|15
|3824
|31
Report
AI Summary
This report provides a comprehensive financial analysis of Mark and Spencer (M&S), evaluating its performance through ratio analysis, including profitability, efficiency, liquidity, and financial gearing ratios from 2015 to 2019. The analysis reveals trends in gross profit margin, asset turnover, current ratio, and debt-to-equity ratio, offering recommendations to improve profitability and financial stability. Furthermore, the report assesses investment alternatives using Net Present Value (NPV) and Internal Rate of Return (IRR) methods, evaluating a potential project's viability. The NPV calculation yields a positive result, while the IRR is calculated, indicating the project's attractiveness. The report also touches on the concept of potential acquisition, providing a holistic view of financial decision-making for the company.

Finance
for
Decision Makers
for
Decision Makers
Paraphrase This Document
Need a fresh take? Get an instant paraphrase of this document with our AI Paraphraser
Table of Contents
INTRODUCTION...........................................................................................................................3
MAIN BODY...................................................................................................................................3
1. Evaluation of financial performance:.......................................................................................3
2. Investment appraisal:...............................................................................................................9
3. Potential acquisition:..............................................................................................................11
CONCLUSION..............................................................................................................................13
REFERENCES..............................................................................................................................14
INTRODUCTION
In the companies, decision making is one of the crucial process which needs to be
considered in an effective manner. Especially financial decisions need lot of time and data for
making correct judgement. The term, financial decision making can be defined as a process of
analysing need of funds in a company and allocating funds into different activities. The project
report is based on a company that is Mark and Spencer. This company is located in London,
United Kingdom and it was founded in year 1884. The company mainly engaged in selling a
range of products such as clothing, food, home products etc. The senior management team of this
company wants a detailed report which needs to include information about financial performance
of company. As well as analysis of investment alternatives by help of various method of
investment appraisal. The end part of report includes information about acquisition in which
Mark and Spencer will acquire a target company.
MAIN BODY
1. Evaluation of financial performance:
Ratio analysis- This is defined as a kind of approach or method which is used by companies in
order to evaluate their financial performance. Under it, different kinds of ratios are calculated
and analysed in order to compare current performance with past years’ performance. This
technique is suitable for companies because it consumes lack of time and cost in financial
analysis as compared to other techniques. There are some advantages and disadvantages of ratio
analysis technique that are as follows:
Advantages:
One of the key benefit of this technique is that by help of it, a company can easily make
compare their financial performance with competitive companies and industries.
This technique highlights the problem areas in which company needs to improve. As well
as managers of companies become able to know the concern area or activity in which
they need to take action.
The ratio analysis makes complex financial statements easier to understand. This
becomes possible because under it, all type of financial data of statements is included in
ratios.
⊘ This is a preview!⊘
Do you want full access?
Subscribe today to unlock all pages.
Trusted by 1+ million students worldwide
This technique helps to companies to take all kinds of decisions including investing,
financing or operating decisions. It is so because ratios are categorized into multiple
ranges which makes easier for managers to take appropriate actions.
Disadvantages:
Companies often make change in the data of financial statements in order to improve
their ratios. Due to this, ratio analysis become senseless because companies have right
and option to make modifications in their statements to show their ratios effective.
In addition, the ratio calculation does not consider price factor and due to which it
becomes difficult to relay on outcomes. All types of ratios are calculated on the basis of
historical data and on the basis of it, investors can take investment decision in company.
The ratio analysis technique considers only financial or monetary aspect. It does not
consider non-financial factors. This thing makes ratio analysis technique less effective
and reliable.
Another drawback of this technique is that there is no standard formula to compute ratios
and companies can adopt methods in accordance of own suitability. This indicates that
comparison of two companies’ financial performance may be wrong because both
companies might have used different formulas to find out value of ratios.
In regards to Mark and Spencer company, this technique has been applied in order to analyse
financial performance so that recommendation can be given to management team:
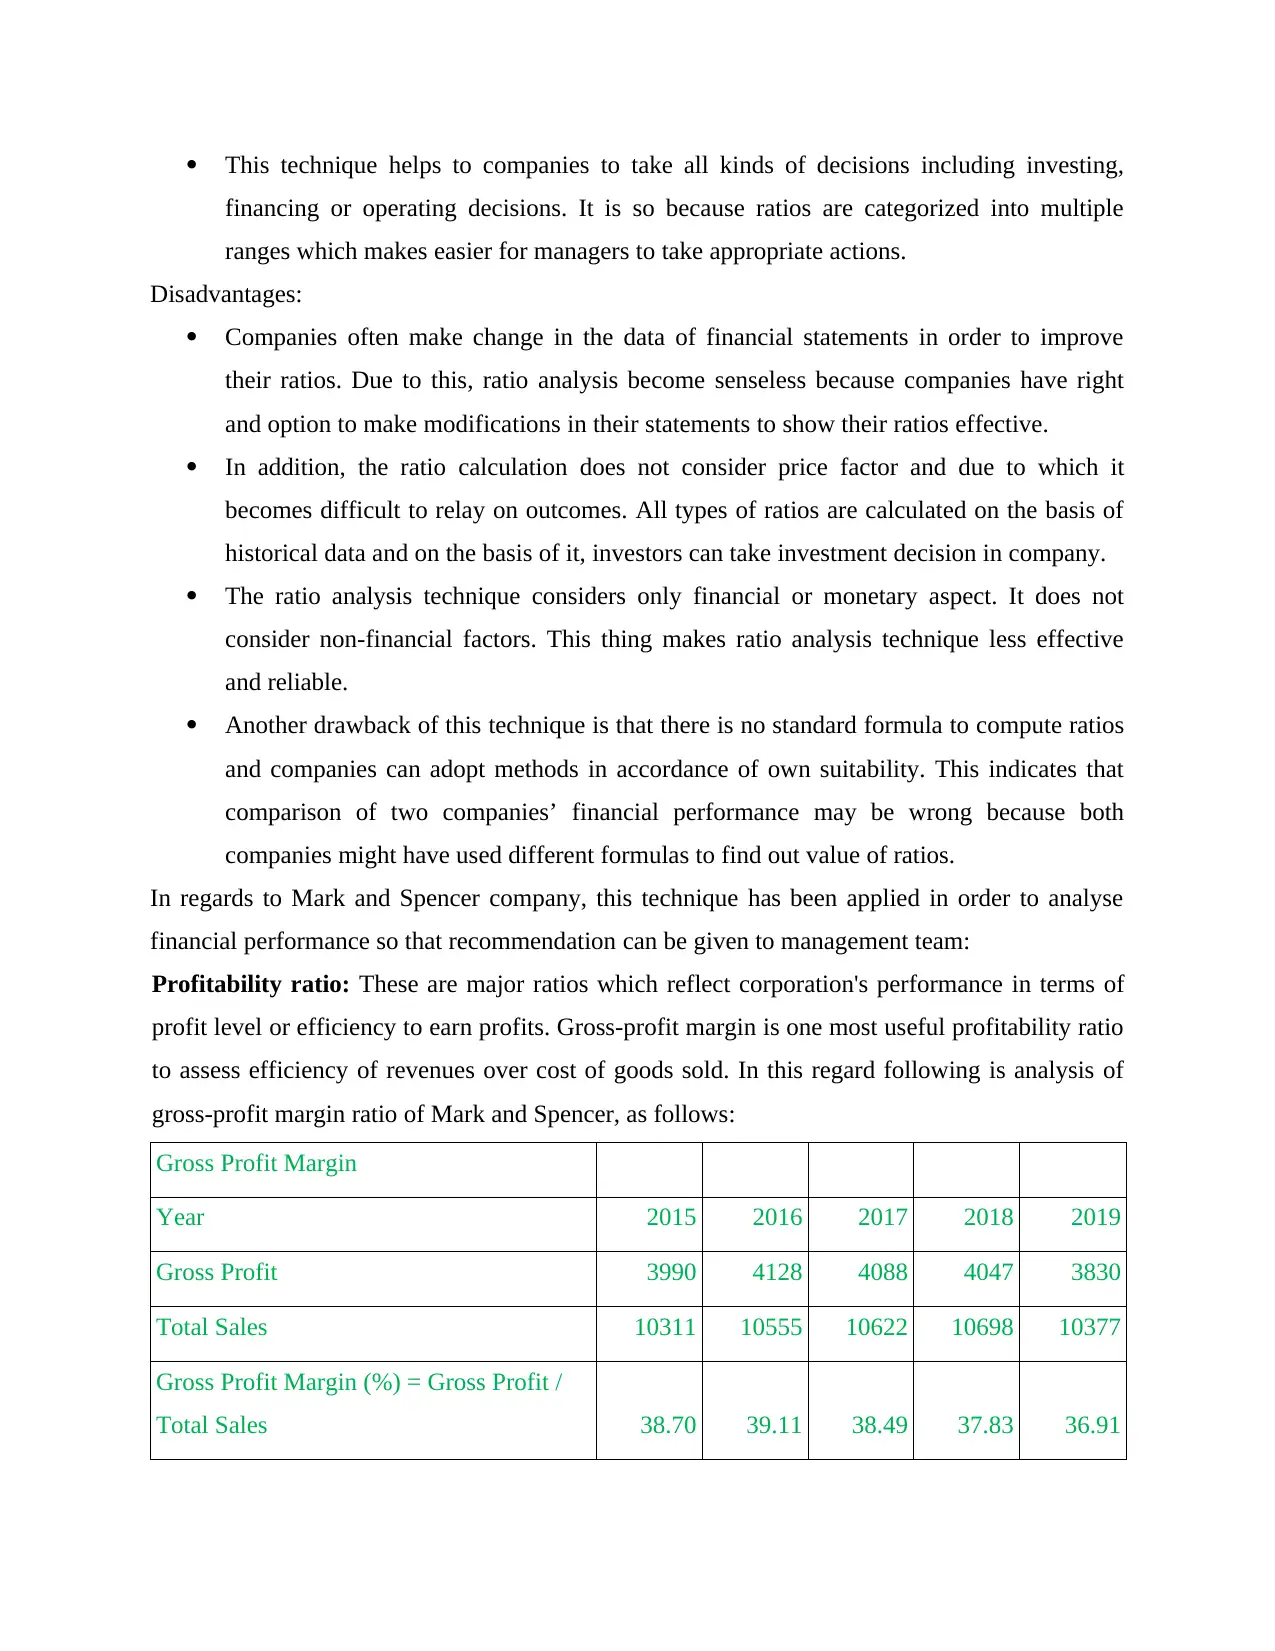
Profitability ratio: These are major ratios which reflect corporation's performance in terms of
profit level or efficiency to earn profits. Gross-profit margin is one most useful profitability ratio
to assess efficiency of revenues over cost of goods sold. In this regard following is analysis of
gross-profit margin ratio of Mark and Spencer, as follows:
Gross Profit Margin
Year 2015 2016 2017 2018 2019
Gross Profit 3990 4128 4088 4047 3830
Total Sales 10311 10555 10622 10698 10377
Gross Profit Margin (%) = Gross Profit /
Total Sales 38.70 39.11 38.49 37.83 36.91
financing or operating decisions. It is so because ratios are categorized into multiple
ranges which makes easier for managers to take appropriate actions.
Disadvantages:
Companies often make change in the data of financial statements in order to improve
their ratios. Due to this, ratio analysis become senseless because companies have right
and option to make modifications in their statements to show their ratios effective.
In addition, the ratio calculation does not consider price factor and due to which it
becomes difficult to relay on outcomes. All types of ratios are calculated on the basis of
historical data and on the basis of it, investors can take investment decision in company.
The ratio analysis technique considers only financial or monetary aspect. It does not
consider non-financial factors. This thing makes ratio analysis technique less effective
and reliable.
Another drawback of this technique is that there is no standard formula to compute ratios
and companies can adopt methods in accordance of own suitability. This indicates that
comparison of two companies’ financial performance may be wrong because both
companies might have used different formulas to find out value of ratios.
In regards to Mark and Spencer company, this technique has been applied in order to analyse
financial performance so that recommendation can be given to management team:
Profitability ratio: These are major ratios which reflect corporation's performance in terms of
profit level or efficiency to earn profits. Gross-profit margin is one most useful profitability ratio
to assess efficiency of revenues over cost of goods sold. In this regard following is analysis of
gross-profit margin ratio of Mark and Spencer, as follows:
Gross Profit Margin
Year 2015 2016 2017 2018 2019
Gross Profit 3990 4128 4088 4047 3830
Total Sales 10311 10555 10622 10698 10377
Gross Profit Margin (%) = Gross Profit /
Total Sales 38.70 39.11 38.49 37.83 36.91
Paraphrase This Document
Need a fresh take? Get an instant paraphrase of this document with our AI Paraphraser
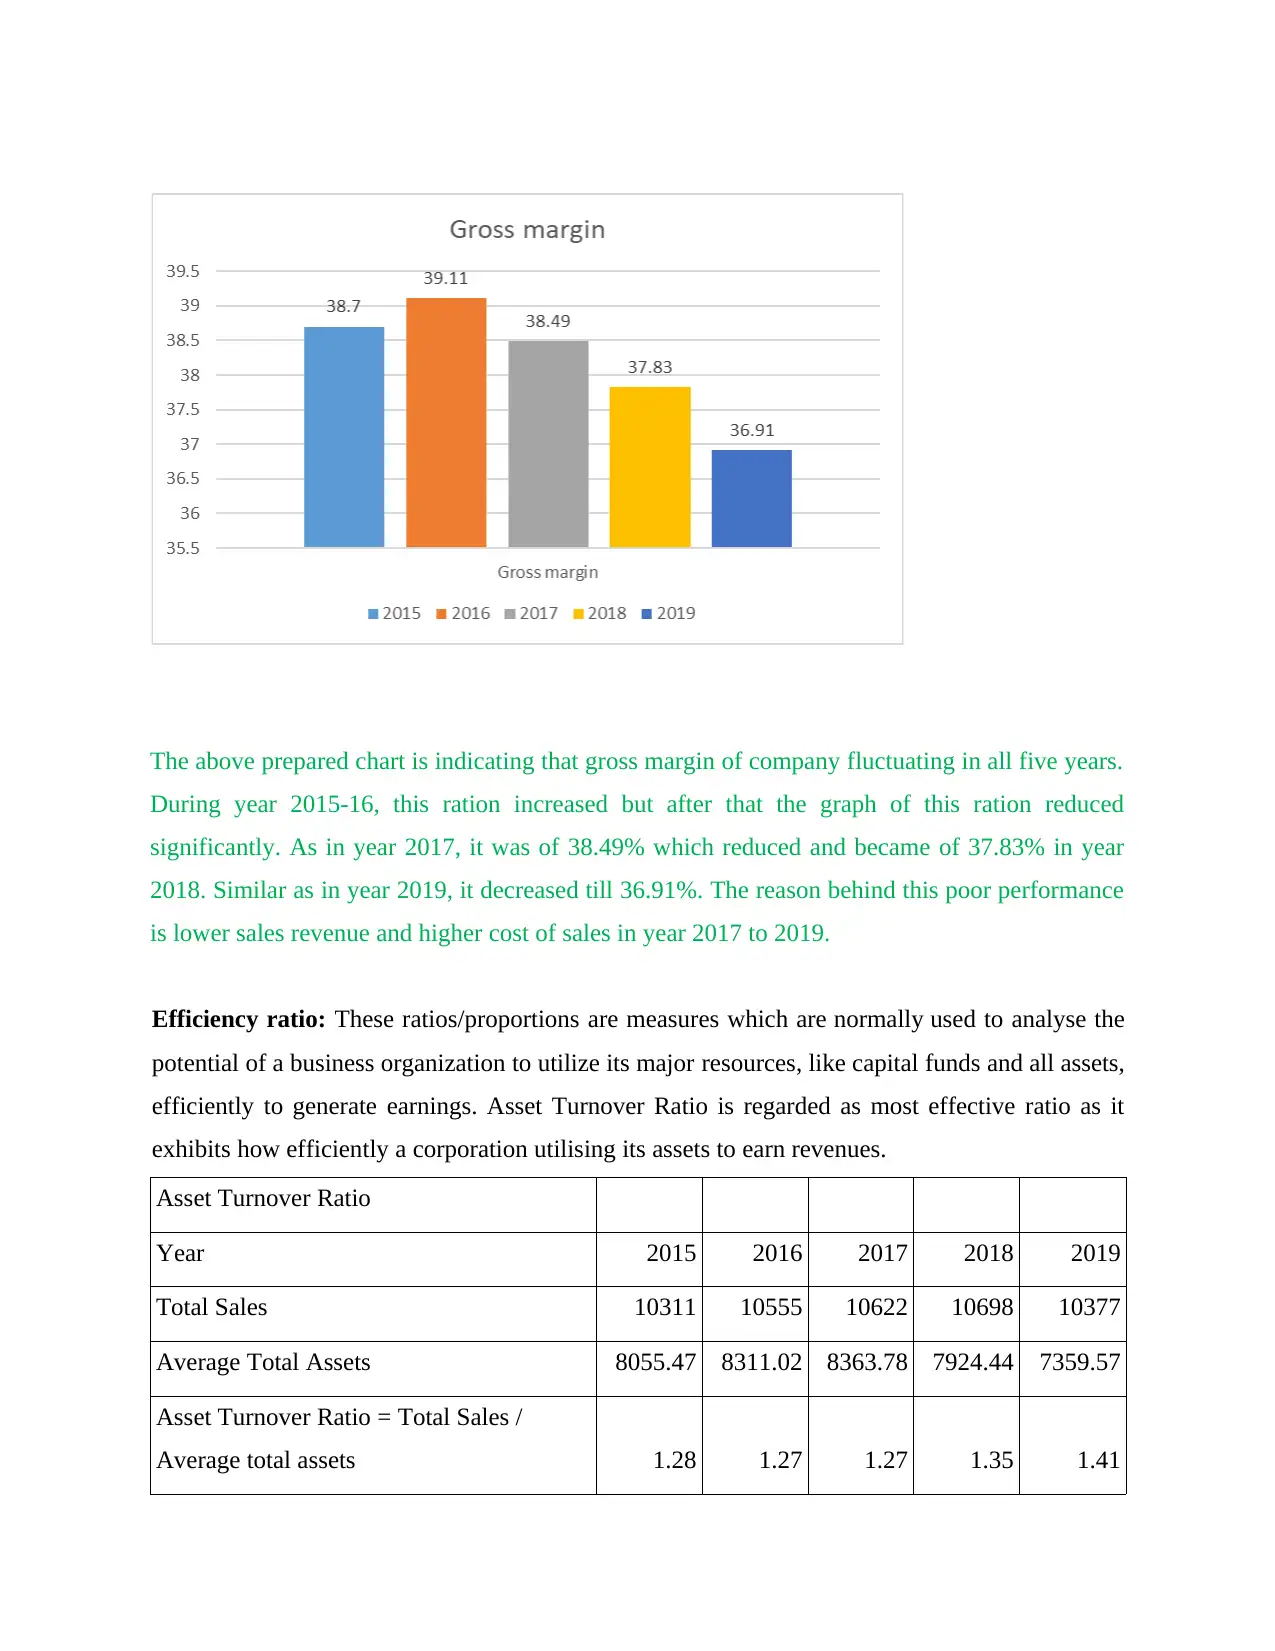
The above prepared chart is indicating that gross margin of company fluctuating in all five years.
During year 2015-16, this ration increased but after that the graph of this ration reduced
significantly. As in year 2017, it was of 38.49% which reduced and became of 37.83% in year
2018. Similar as in year 2019, it decreased till 36.91%. The reason behind this poor performance
is lower sales revenue and higher cost of sales in year 2017 to 2019.
Efficiency ratio: These ratios/proportions are measures which are normally used to analyse the
potential of a business organization to utilize its major resources, like capital funds and all assets,
efficiently to generate earnings. Asset Turnover Ratio is regarded as most effective ratio as it
exhibits how efficiently a corporation utilising its assets to earn revenues.
Asset Turnover Ratio
Year 2015 2016 2017 2018 2019
Total Sales 10311 10555 10622 10698 10377
Average Total Assets 8055.47 8311.02 8363.78 7924.44 7359.57
Asset Turnover Ratio = Total Sales /
Average total assets 1.28 1.27 1.27 1.35 1.41
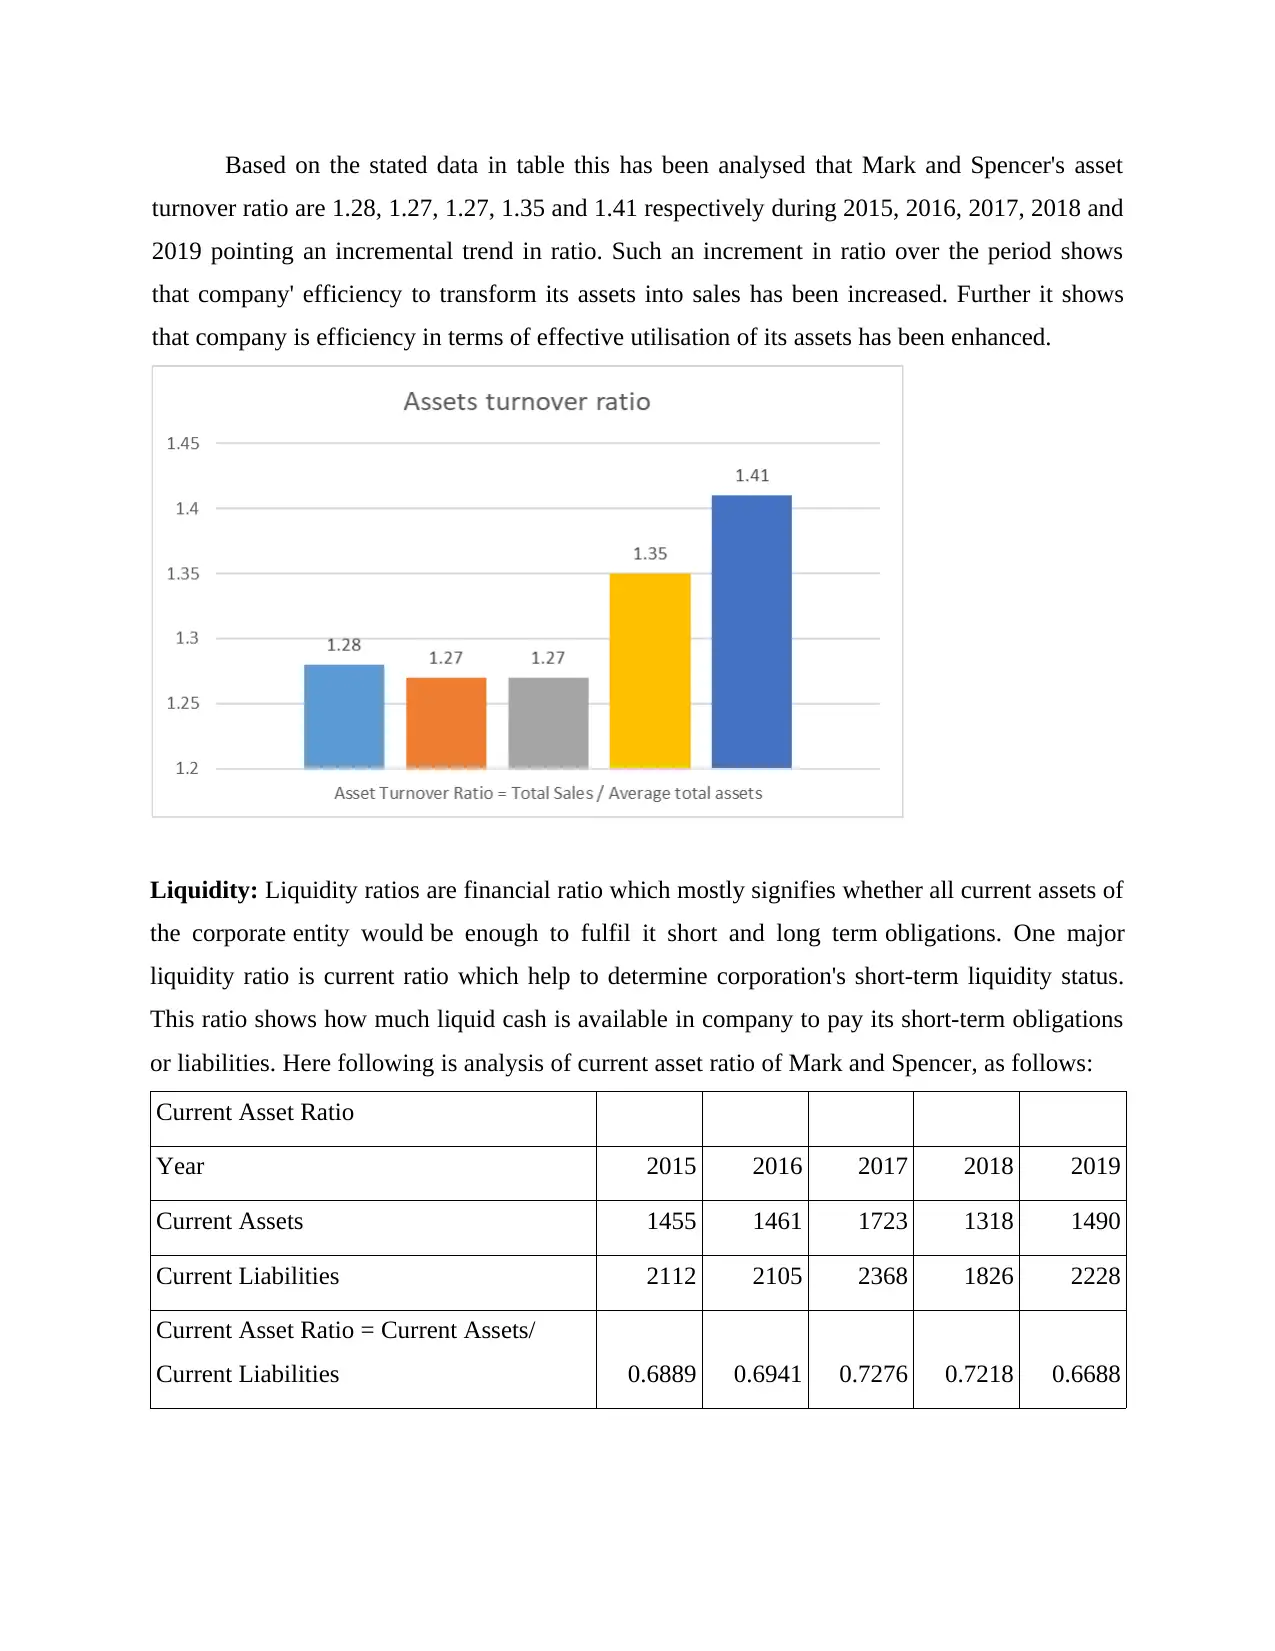
Based on the stated data in table this has been analysed that Mark and Spencer's asset
turnover ratio are 1.28, 1.27, 1.27, 1.35 and 1.41 respectively during 2015, 2016, 2017, 2018 and
2019 pointing an incremental trend in ratio. Such an increment in ratio over the period shows
that company' efficiency to transform its assets into sales has been increased. Further it shows
that company is efficiency in terms of effective utilisation of its assets has been enhanced.
Liquidity: Liquidity ratios are financial ratio which mostly signifies whether all current assets of
the corporate entity would be enough to fulfil it short and long term obligations. One major
liquidity ratio is current ratio which help to determine corporation's short-term liquidity status.
This ratio shows how much liquid cash is available in company to pay its short-term obligations
or liabilities. Here following is analysis of current asset ratio of Mark and Spencer, as follows:
Current Asset Ratio
Year 2015 2016 2017 2018 2019
Current Assets 1455 1461 1723 1318 1490
Current Liabilities 2112 2105 2368 1826 2228
Current Asset Ratio = Current Assets/
Current Liabilities 0.6889 0.6941 0.7276 0.7218 0.6688
⊘ This is a preview!⊘
Do you want full access?
Subscribe today to unlock all pages.
Trusted by 1+ million students worldwide
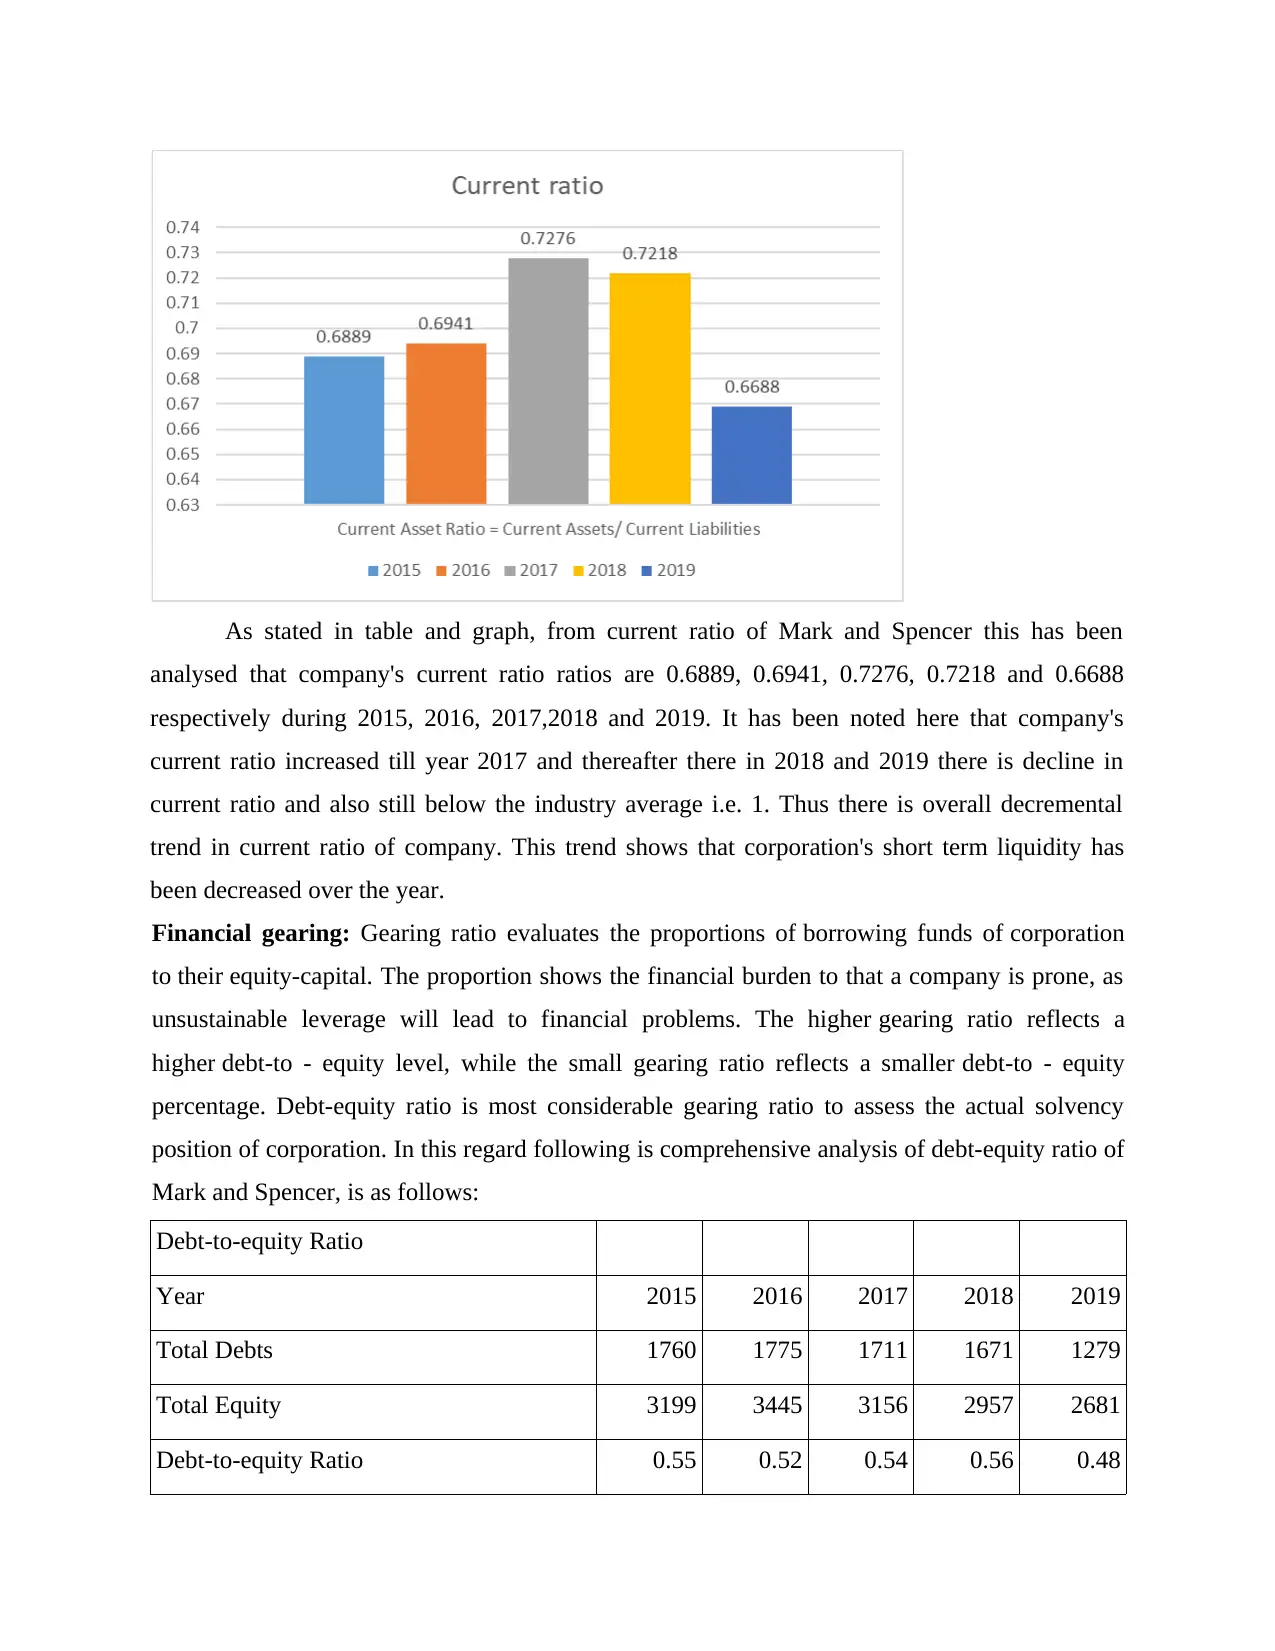
As stated in table and graph, from current ratio of Mark and Spencer this has been
analysed that company's current ratio ratios are 0.6889, 0.6941, 0.7276, 0.7218 and 0.6688
respectively during 2015, 2016, 2017,2018 and 2019. It has been noted here that company's
current ratio increased till year 2017 and thereafter there in 2018 and 2019 there is decline in
current ratio and also still below the industry average i.e. 1. Thus there is overall decremental
trend in current ratio of company. This trend shows that corporation's short term liquidity has
been decreased over the year.
Financial gearing: Gearing ratio evaluates the proportions of borrowing funds of corporation
to their equity-capital. The proportion shows the financial burden to that a company is prone, as
unsustainable leverage will lead to financial problems. The higher gearing ratio reflects a
higher debt-to - equity level, while the small gearing ratio reflects a smaller debt-to - equity
percentage. Debt-equity ratio is most considerable gearing ratio to assess the actual solvency
position of corporation. In this regard following is comprehensive analysis of debt-equity ratio of
Mark and Spencer, is as follows:
Debt-to-equity Ratio
Year 2015 2016 2017 2018 2019
Total Debts 1760 1775 1711 1671 1279
Total Equity 3199 3445 3156 2957 2681
Debt-to-equity Ratio 0.55 0.52 0.54 0.56 0.48
Paraphrase This Document
Need a fresh take? Get an instant paraphrase of this document with our AI Paraphraser

As table shows Mark and Spencer's debt-to-equity ratios are 0.55, 0.52, 0.54, 0.56 and
0.48 respectively in year 2015, 2016, 2017, 2018 and 2019 reflecting a declining trend i.e.
favourable indication. This decline in ratio shows that company's reliability upon debt financing
has been decreased. Although here it is also notable aspect is that company's equity funds has
also been decreased over the period and below the industry's average level i.e. around 1.
Decrease in dependence upon debt-financing shows that corporation's long term liquidity
position is quite good.
Recommendation to management team: Here based on the above ratios analysis it has been
recommended to managerial team that corporation's profitability status is continuously declined
and expected to be decline thus they have to focus towards this area. In attempt to increase net
profit margin company has to improve their controlling over costs and expenditures. Further to
increase the overall sales company has to modify or adapt new promotional strategy. Also there
is just slight improvement in financial gearing while liquidity ratio is decline in last two year
there here advisable to them to restructure their debts and focus towards equity funding instead
debt financing. Moreover, company should list out all those aspects or influences which are
impacting corporation's financial performance within industry and put efforts to minimise the
effects of such aspects.
2. Investment appraisal:
Investment appraisal is an analysis conducted to determine the viability of investment
made over asset's existence including feasibility and strategic alliance considerations. It is a way
a company can determine the feasibility of future investments or ventures centred on results from
many various methods of capital-budgeting and funding. This is a sort of basic evaluation for
traders because this could help recognize longer-term patterns and the expected profitability
level of a business. Investment appraisal can be regarded as an input to investment decision that
is sponsor and governing board 's decision who determines/defines investment in a portfolio,
proposal and project (Ndanyenbah, T.Y. and Zakaria, A., 2019). This offers the basis and
reasoning for investing scarce capital and focuses on a comprehensive investment evaluation.
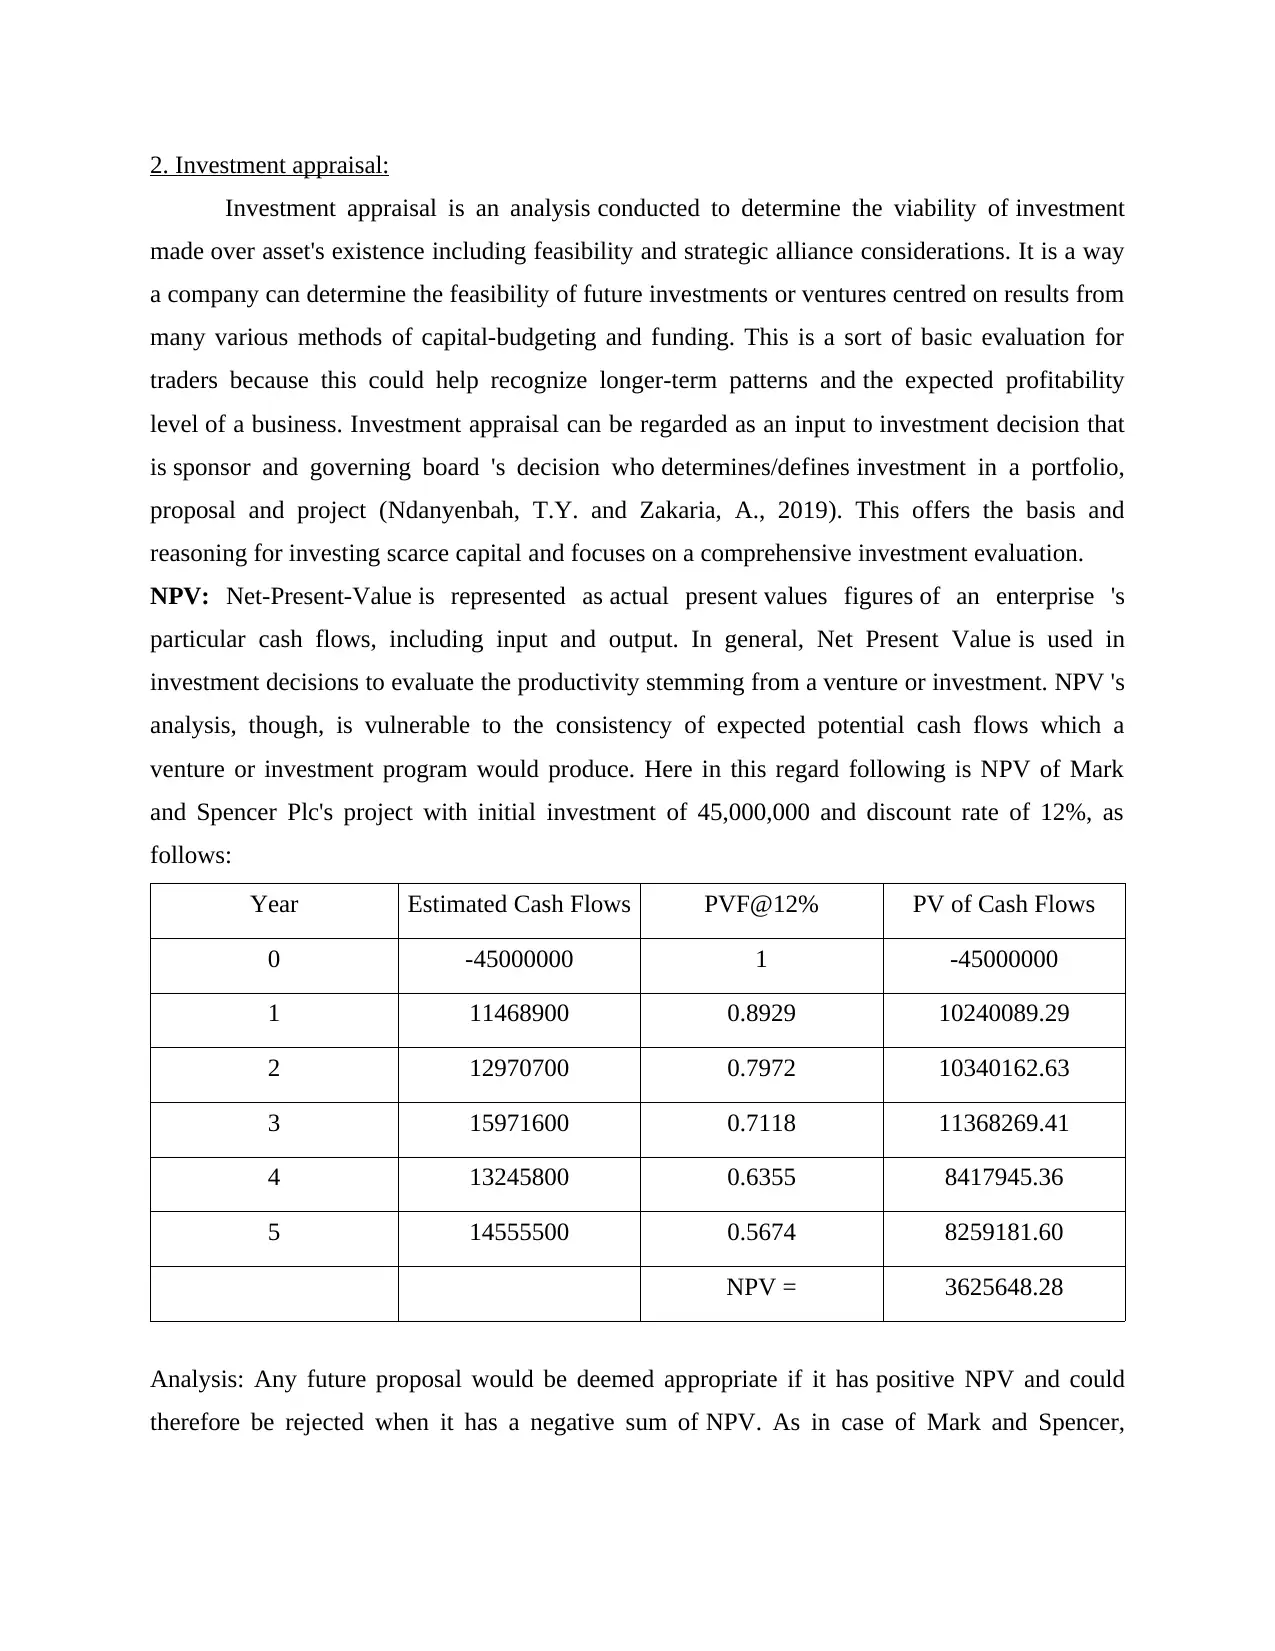
NPV: Net-Present-Value is represented as actual present values figures of an enterprise 's
particular cash flows, including input and output. In general, Net Present Value is used in
investment decisions to evaluate the productivity stemming from a venture or investment. NPV 's
analysis, though, is vulnerable to the consistency of expected potential cash flows which a
venture or investment program would produce. Here in this regard following is NPV of Mark
and Spencer Plc's project with initial investment of 45,000,000 and discount rate of 12%, as
follows:
Year Estimated Cash Flows PVF@12% PV of Cash Flows
0 -45000000 1 -45000000
1 11468900 0.8929 10240089.29
2 12970700 0.7972 10340162.63
3 15971600 0.7118 11368269.41
4 13245800 0.6355 8417945.36
5 14555500 0.5674 8259181.60
NPV = 3625648.28
Analysis: Any future proposal would be deemed appropriate if it has positive NPV and could
therefore be rejected when it has a negative sum of NPV. As in case of Mark and Spencer,
Investment appraisal is an analysis conducted to determine the viability of investment
made over asset's existence including feasibility and strategic alliance considerations. It is a way
a company can determine the feasibility of future investments or ventures centred on results from
many various methods of capital-budgeting and funding. This is a sort of basic evaluation for
traders because this could help recognize longer-term patterns and the expected profitability
level of a business. Investment appraisal can be regarded as an input to investment decision that
is sponsor and governing board 's decision who determines/defines investment in a portfolio,
proposal and project (Ndanyenbah, T.Y. and Zakaria, A., 2019). This offers the basis and
reasoning for investing scarce capital and focuses on a comprehensive investment evaluation.
NPV: Net-Present-Value is represented as actual present values figures of an enterprise 's
particular cash flows, including input and output. In general, Net Present Value is used in
investment decisions to evaluate the productivity stemming from a venture or investment. NPV 's
analysis, though, is vulnerable to the consistency of expected potential cash flows which a
venture or investment program would produce. Here in this regard following is NPV of Mark
and Spencer Plc's project with initial investment of 45,000,000 and discount rate of 12%, as
follows:
Year Estimated Cash Flows PVF@12% PV of Cash Flows
0 -45000000 1 -45000000
1 11468900 0.8929 10240089.29
2 12970700 0.7972 10340162.63
3 15971600 0.7118 11368269.41
4 13245800 0.6355 8417945.36
5 14555500 0.5674 8259181.60
NPV = 3625648.28
Analysis: Any future proposal would be deemed appropriate if it has positive NPV and could
therefore be rejected when it has a negative sum of NPV. As in case of Mark and Spencer,
⊘ This is a preview!⊘
Do you want full access?
Subscribe today to unlock all pages.
Trusted by 1+ million students worldwide
company's said project has positive NPV i.e. 3625648.28 which reflects that this project would
be viable for corporation if all other factors remain same.
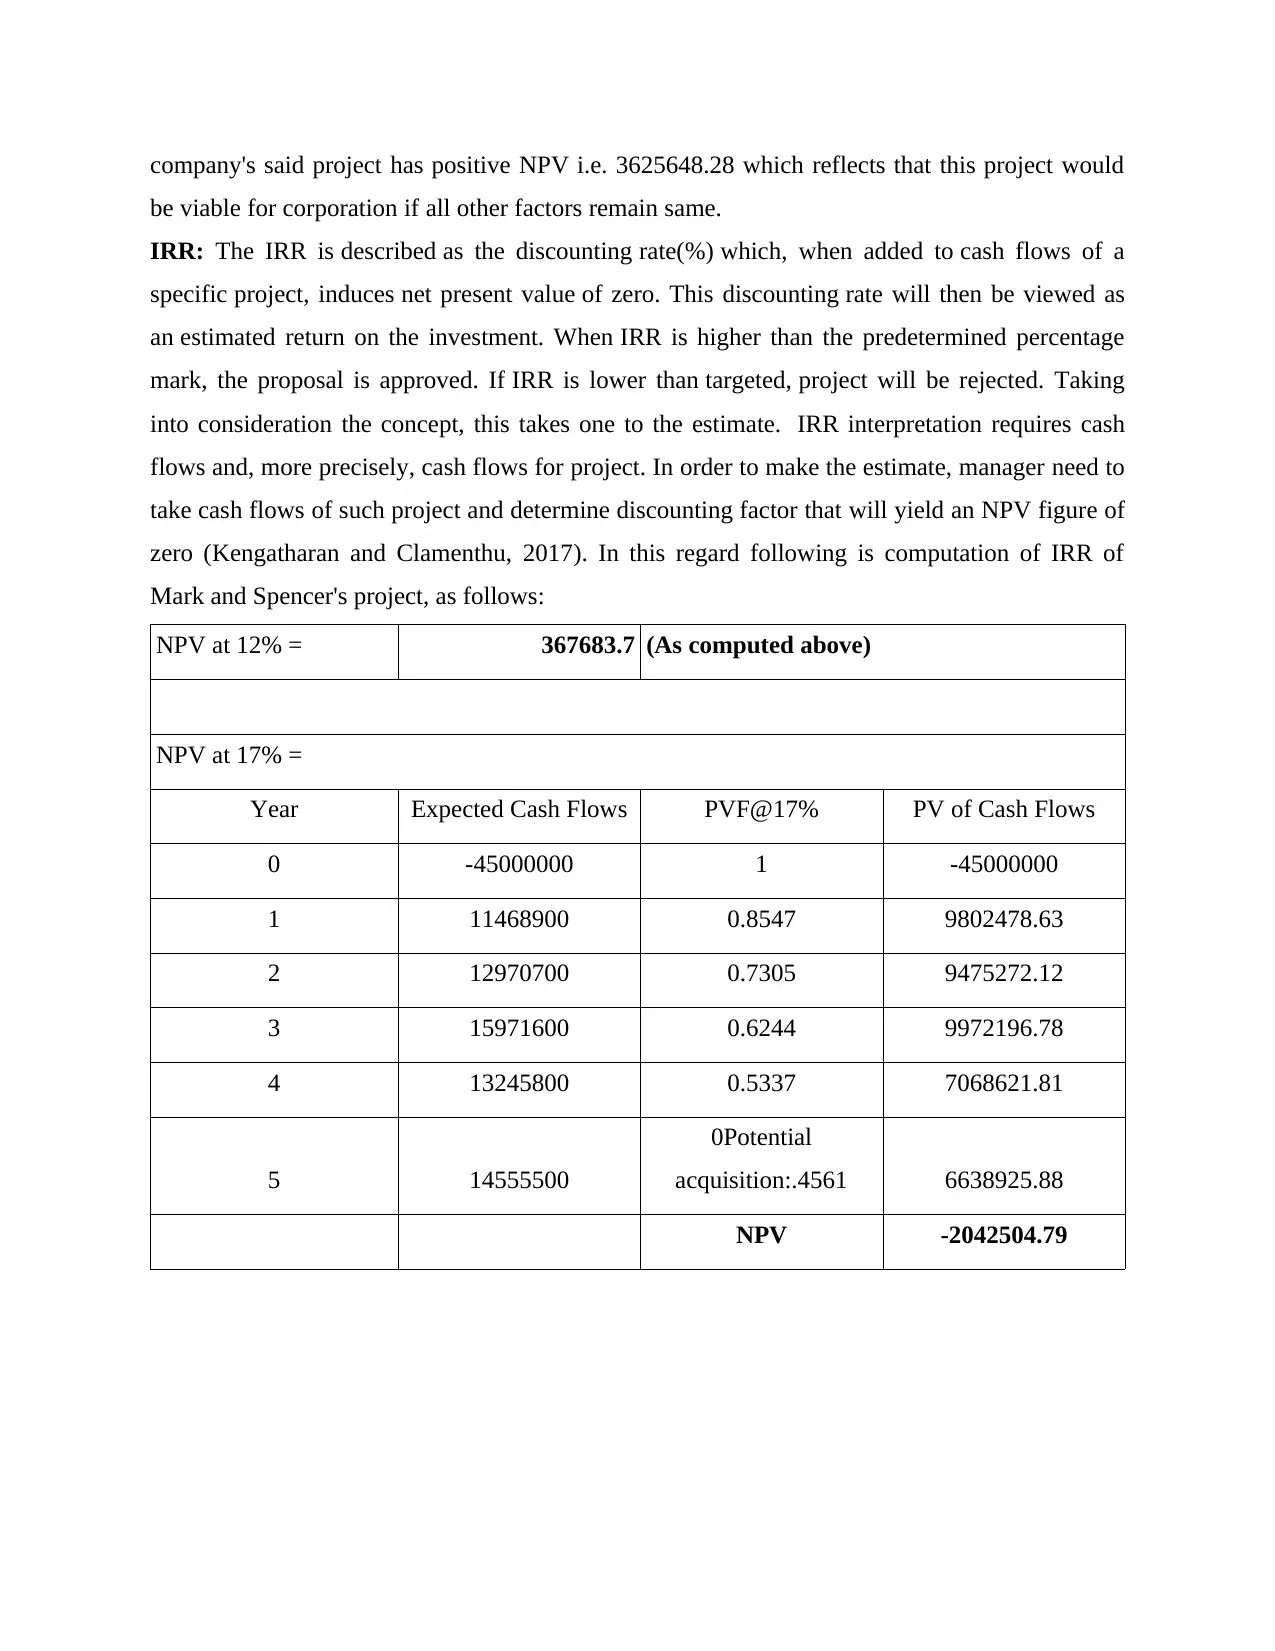
IRR: The IRR is described as the discounting rate(%) which, when added to cash flows of a
specific project, induces net present value of zero. This discounting rate will then be viewed as
an estimated return on the investment. When IRR is higher than the predetermined percentage
mark, the proposal is approved. If IRR is lower than targeted, project will be rejected. Taking
into consideration the concept, this takes one to the estimate. IRR interpretation requires cash
flows and, more precisely, cash flows for project. In order to make the estimate, manager need to
take cash flows of such project and determine discounting factor that will yield an NPV figure of
zero (Kengatharan and Clamenthu, 2017). In this regard following is computation of IRR of
Mark and Spencer's project, as follows:
NPV at 12% = 367683.7 (As computed above)
NPV at 17% =
Year Expected Cash Flows PVF@17% PV of Cash Flows
0 -45000000 1 -45000000
1 11468900 0.8547 9802478.63
2 12970700 0.7305 9475272.12
3 15971600 0.6244 9972196.78
4 13245800 0.5337 7068621.81
5 14555500
0Potential
acquisition:.4561 6638925.88
NPV -2042504.79
be viable for corporation if all other factors remain same.
IRR: The IRR is described as the discounting rate(%) which, when added to cash flows of a
specific project, induces net present value of zero. This discounting rate will then be viewed as
an estimated return on the investment. When IRR is higher than the predetermined percentage
mark, the proposal is approved. If IRR is lower than targeted, project will be rejected. Taking
into consideration the concept, this takes one to the estimate. IRR interpretation requires cash
flows and, more precisely, cash flows for project. In order to make the estimate, manager need to
take cash flows of such project and determine discounting factor that will yield an NPV figure of
zero (Kengatharan and Clamenthu, 2017). In this regard following is computation of IRR of
Mark and Spencer's project, as follows:
NPV at 12% = 367683.7 (As computed above)
NPV at 17% =
Year Expected Cash Flows PVF@17% PV of Cash Flows
0 -45000000 1 -45000000
1 11468900 0.8547 9802478.63
2 12970700 0.7305 9475272.12
3 15971600 0.6244 9972196.78
4 13245800 0.5337 7068621.81
5 14555500
0Potential
acquisition:.4561 6638925.88
NPV -2042504.79
Paraphrase This Document
Need a fresh take? Get an instant paraphrase of this document with our AI Paraphraser
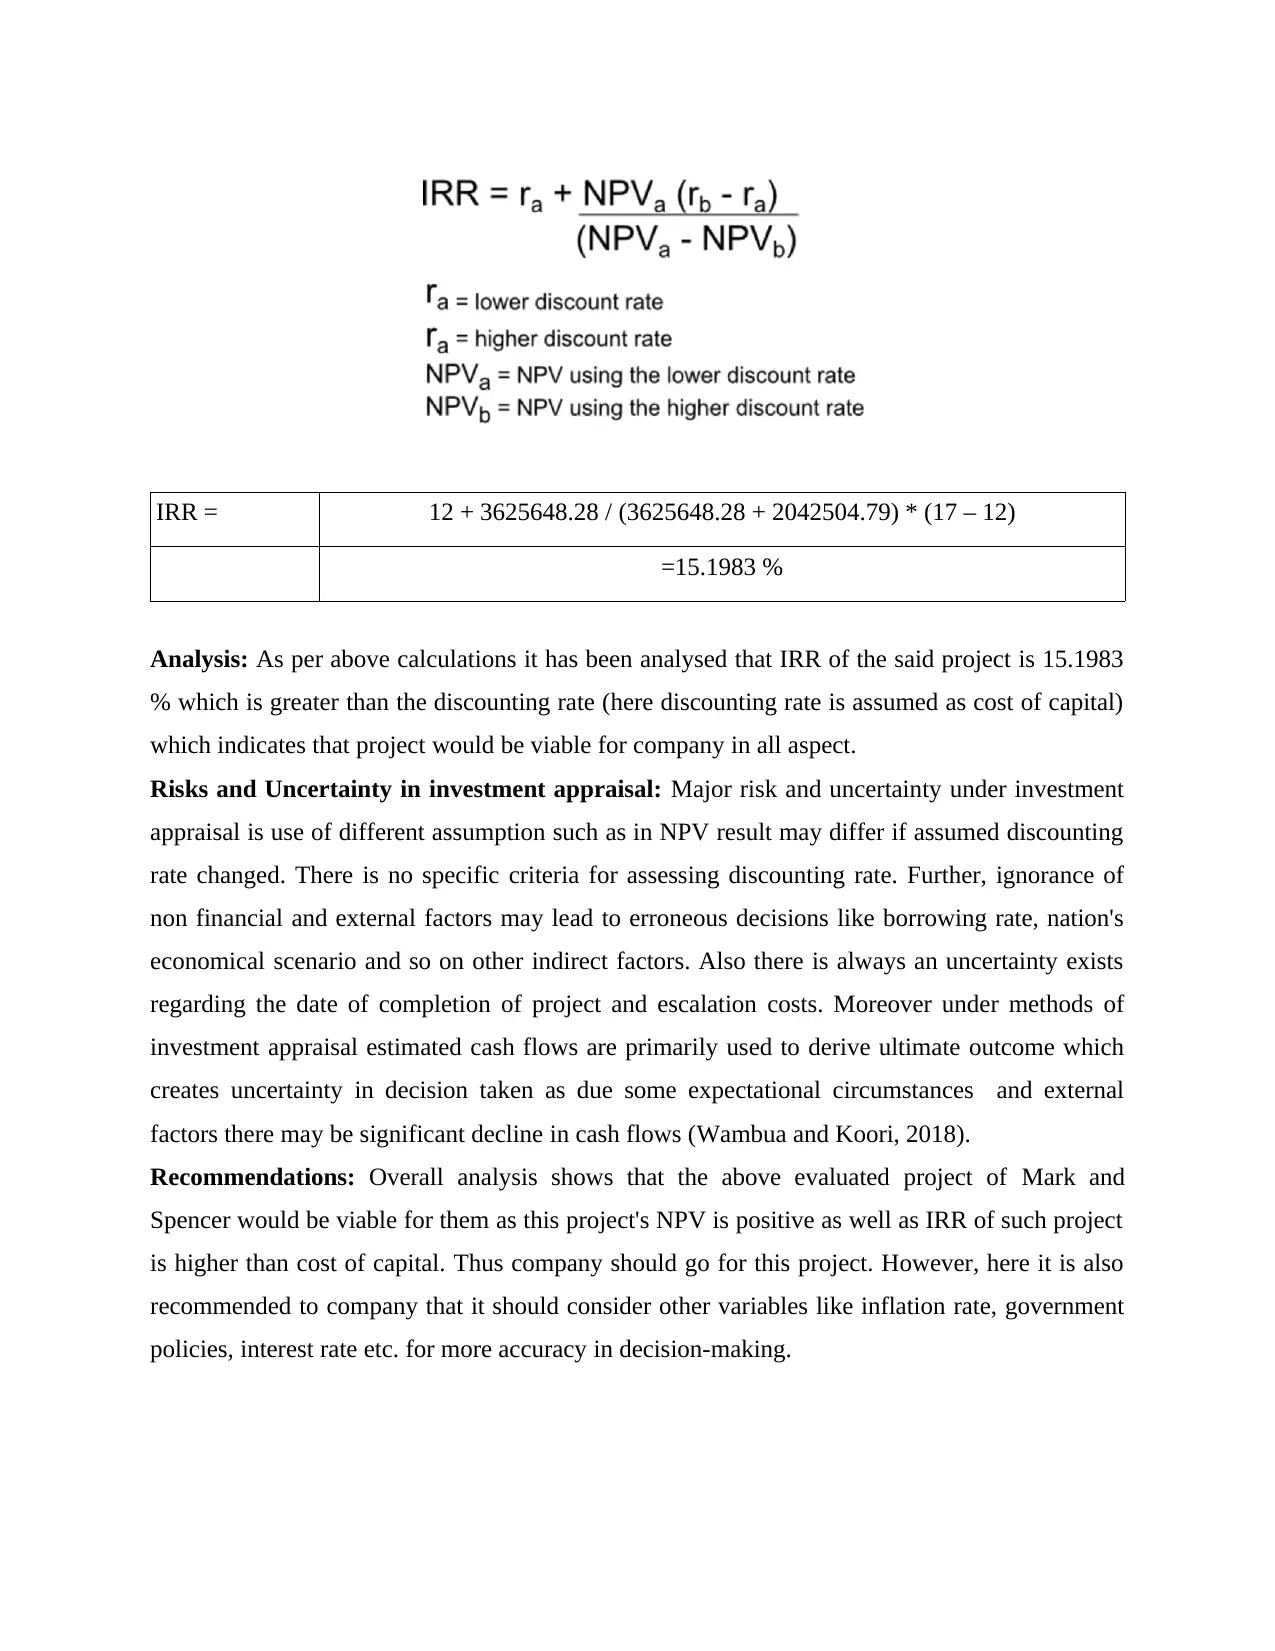
IRR = 12 + 3625648.28 / (3625648.28 + 2042504.79) * (17 – 12)
=15.1983 %
Analysis: As per above calculations it has been analysed that IRR of the said project is 15.1983
% which is greater than the discounting rate (here discounting rate is assumed as cost of capital)
which indicates that project would be viable for company in all aspect.
Risks and Uncertainty in investment appraisal: Major risk and uncertainty under investment
appraisal is use of different assumption such as in NPV result may differ if assumed discounting
rate changed. There is no specific criteria for assessing discounting rate. Further, ignorance of
non financial and external factors may lead to erroneous decisions like borrowing rate, nation's
economical scenario and so on other indirect factors. Also there is always an uncertainty exists
regarding the date of completion of project and escalation costs. Moreover under methods of
investment appraisal estimated cash flows are primarily used to derive ultimate outcome which
creates uncertainty in decision taken as due some expectational circumstances and external
factors there may be significant decline in cash flows (Wambua and Koori, 2018).
Recommendations: Overall analysis shows that the above evaluated project of Mark and
Spencer would be viable for them as this project's NPV is positive as well as IRR of such project
is higher than cost of capital. Thus company should go for this project. However, here it is also
recommended to company that it should consider other variables like inflation rate, government
policies, interest rate etc. for more accuracy in decision-making.
3. Potential acquisition:
Rationale for selecting Ocado Retail Ltd (Target Company): Ocado Retail Ltd is an
active corporation with registered office situated in the Hatfield, Hertfordshire, formed on
11th November 1999. Ocado Retail operating for 20 years. Mark and Spencer is expecting
around significant synergy to be generated due to this acquisition as the target company has 20
year experience in the sector as well as have popular web platform for online selling of products.
Main rationale for selecting this company is that company is planning to expand their online
selling through the online web platform of Ocado Retail. Also company is planning to expand
their business in clothing sector (Ocado: About us. 2020).
Synergistic gain of the acquisition: Synergistic gain of around GBP 70 million is expected by
Mark and Spencer due to this acquisition. This would benefit from a acquisition of increased
purchasing volume, enhanced procurement economics of M&S direct brand and marketed
products, and substantial decrease in product research cost and production costs. The new
collaboration could lead to the distribution of clothes alongside grocery stores, and although
Ocado's logistics were not currently structured to distribute clothes, they stored products like
Pretty Polly tights and knickers, suggesting "possibility to use it very rapidly". The acquisition
would see Marks & Spencer providing first-time online grocery delivery platform and will be
able to sell more than 6,500 food products through Ocado 's website.
Proposed deal value and finance of the acquisition: Here in the proposed deal Mark and
Spencer and Ocado will enter into a joint venture arrangement, whereby M&S will acquire 50
percent of share in Ocado's UK retail business. Under terms of this joint venture, as portion
of five-year strategy to "unlocking growth" inside its food sector, M&S is to buy a 50 per cent
share of the Ocado for GBP 750 million. Ocado will keep trading under its original title, but it
will sell M&S goods from Sep 2020 at latest after its existing Waitrose deal is terminated.
Completion of the deal is scheduled in third quarter of year 2019. A major portion of finance for
this acquisition will be arranged by company through long term loans from bank (M&S
ACQUIRES 50% OF OCADO. 2019). Potential implications of this acquisition on organization's
performance: A major implication of the said acquisition will be: prices for consumers may be
at lower Credit. M&S Food adherents would be enabled to purchase the items online. Prior
experiments at retailer of in-house delivery services proved uneconomic, preventing a complete
rolled-out. As per chief executive Steve Rowe, this was a potential owing to the expected cost
⊘ This is a preview!⊘
Do you want full access?
Subscribe today to unlock all pages.
Trusted by 1+ million students worldwide
1 out of 15
Related Documents


Your All-in-One AI-Powered Toolkit for Academic Success.
+13062052269
info@desklib.com
Available 24*7 on WhatsApp / Email
![[object Object]](/_next/static/media/star-bottom.7253800d.svg)
Unlock your academic potential
Copyright © 2020–2026 A2Z Services. All Rights Reserved. Developed and managed by ZUCOL.