Comprehensive Marketing and Data Analytics Report on M&S Performance
VerifiedAdded on 2023/01/11
|12
|3130
|56
Report
AI Summary
This report provides a detailed marketing and data analytics analysis of Marks and Spencer (M&S). It begins with an overview of the company, followed by an in-depth examination of its financial performance, including profitability, liquidity, and working capital management ratios. The report assesses the risks faced by M&S, such as customer service satisfaction, product innovation, and competition. It also analyzes the company's competitive environment using the PESTEL framework, considering political, economic, social, technological, environmental, and legal factors. Finally, the report examines M&S's marketing strategies, offering insights into its approach to the market. The analysis highlights key trends, challenges, and opportunities for the company, providing a comprehensive understanding of its current position and future prospects.
Marketing and Data
Analytics
Analytics
Paraphrase This Document
Need a fresh take? Get an instant paraphrase of this document with our AI Paraphraser
Contents
INTRODUCTION...........................................................................................................................3
MAIN BODY...................................................................................................................................3
Overview of company............................................................................................................3
Financial performance............................................................................................................3
Assessment of marks and spencer risk...................................................................................8
Analyse the company’s competitive environment.................................................................9
Marketing strategy of M&S..................................................................................................10
CONCLUSION..............................................................................................................................10
REEFRENCES..............................................................................................................................12
INTRODUCTION
Marketing analysis is the process of processing and analysing statistical information to
assess the ROI of marketing activities and also the practice of finding opportunities for change
(Choi, Wallace and Wang, 2018). To better understand the concept of marketing and data
Analysis Mark and Spenser Group have been selected which is listed on Financial Times Stock
Exchange 250 index.
In this report, financial performance, company risks and essentially analyse the company’s
competitive environment and marketing strategy is discussed.
MAIN BODY
Overview of company
Marks and Spencer Group plc is a leading British international company headquartered in
London, England, specialized in the selling of clothes, kitchen goods and food items. Throughout
the early 20th century, Marks and Spencer is known as "Marks and Sparks or M&S, "made their
name with a strategy of promoting only British-produced products. &S Food operates with
10,000 British Farming units and give the extra mile along with the produce which customer
deserve (About Marks and Spencer Group plc, 2020).
Financial performance
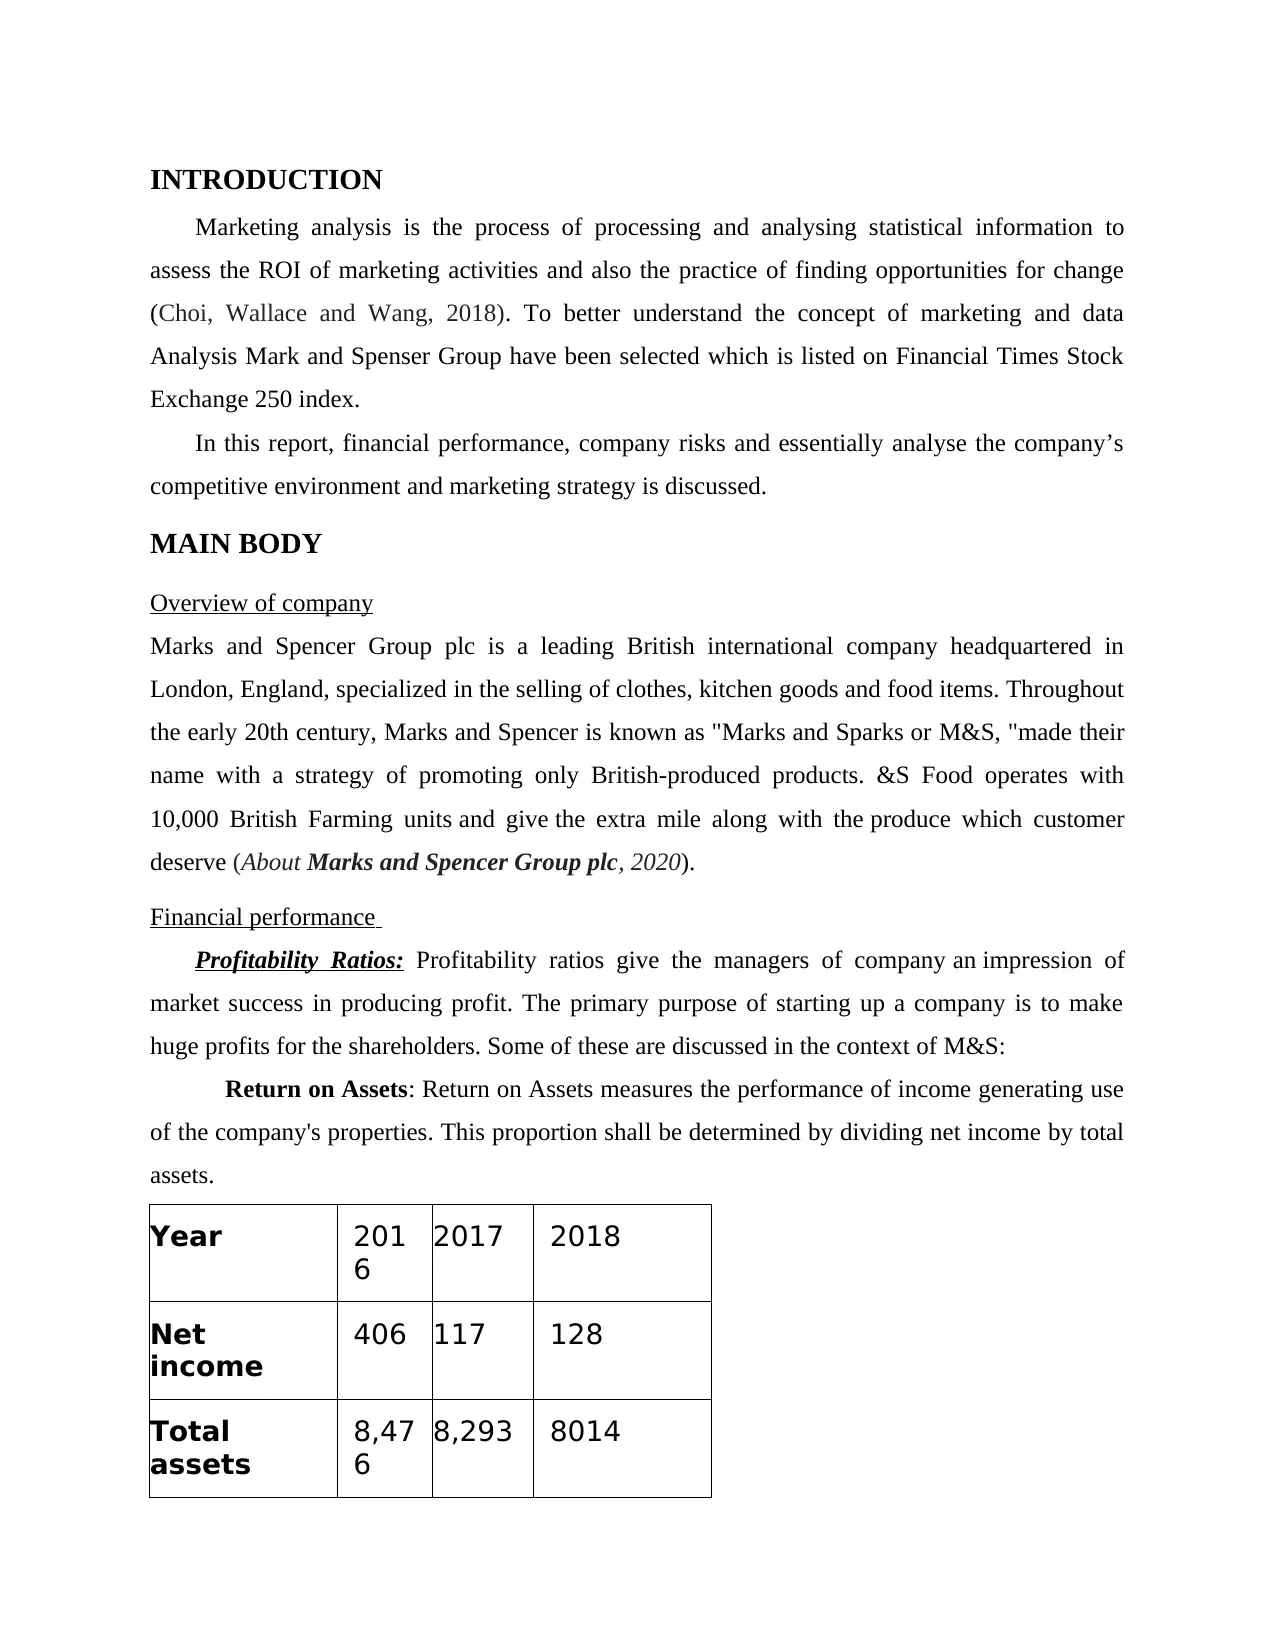
Profitability Ratios: Profitability ratios give the managers of company an impression of
market success in producing profit. The primary purpose of starting up a company is to make
huge profits for the shareholders. Some of these are discussed in the context of M&S:
Return on Assets: Return on Assets measures the performance of income generating use
of the company's properties. This proportion shall be determined by dividing net income by total
assets.
Year 201
6
2017 2018
Net
income
406 117 128
Total
assets
8,47
6
8,293 8014
Marketing analysis is the process of processing and analysing statistical information to
assess the ROI of marketing activities and also the practice of finding opportunities for change
(Choi, Wallace and Wang, 2018). To better understand the concept of marketing and data
Analysis Mark and Spenser Group have been selected which is listed on Financial Times Stock
Exchange 250 index.
In this report, financial performance, company risks and essentially analyse the company’s
competitive environment and marketing strategy is discussed.
MAIN BODY
Overview of company
Marks and Spencer Group plc is a leading British international company headquartered in
London, England, specialized in the selling of clothes, kitchen goods and food items. Throughout
the early 20th century, Marks and Spencer is known as "Marks and Sparks or M&S, "made their
name with a strategy of promoting only British-produced products. &S Food operates with
10,000 British Farming units and give the extra mile along with the produce which customer
deserve (About Marks and Spencer Group plc, 2020).
Financial performance
Profitability Ratios: Profitability ratios give the managers of company an impression of
market success in producing profit. The primary purpose of starting up a company is to make
huge profits for the shareholders. Some of these are discussed in the context of M&S:
Return on Assets: Return on Assets measures the performance of income generating use
of the company's properties. This proportion shall be determined by dividing net income by total
assets.
Year 201
6
2017 2018
Net
income
406 117 128
Total
assets
8,47
6
8,293 8014
⊘ This is a preview!⊘
Do you want full access?
Subscribe today to unlock all pages.
Trusted by 1+ million students worldwide
Return on
assets (%)
4.88 1.4 0.32
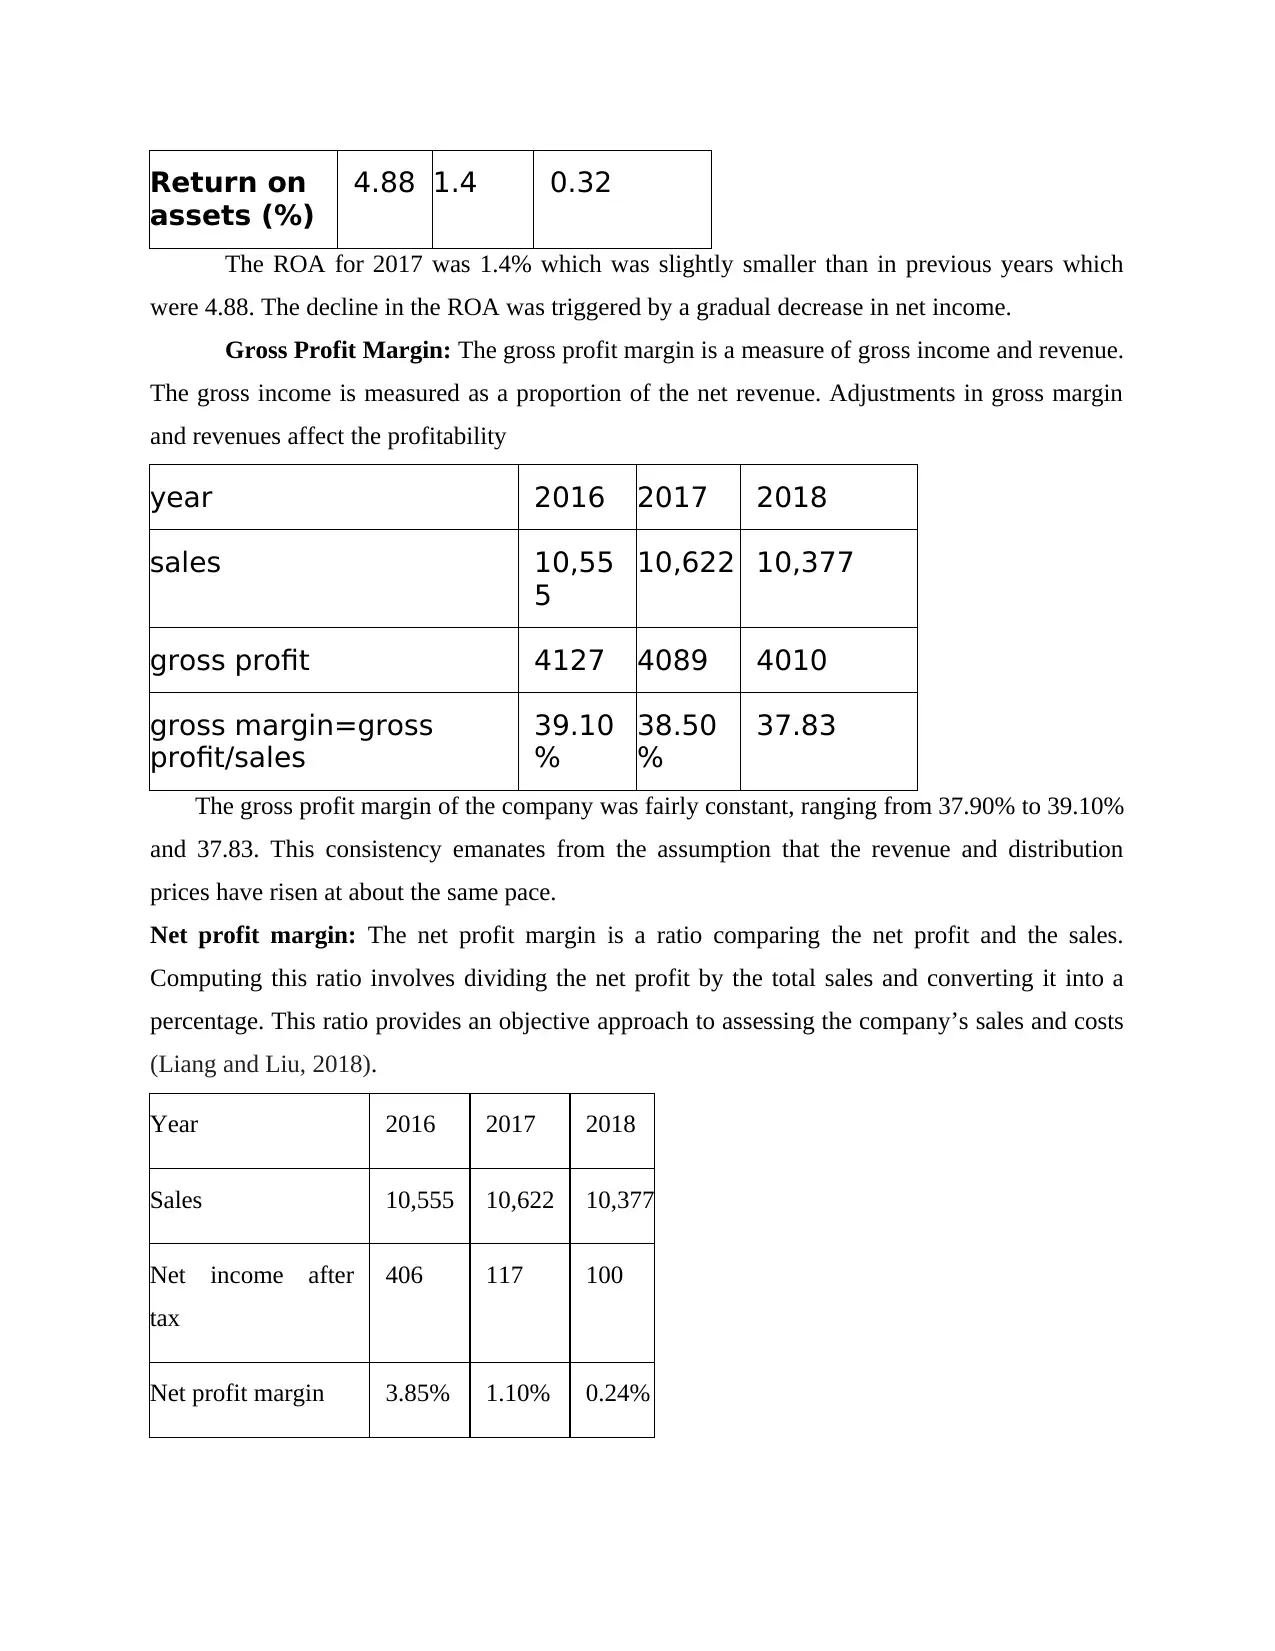
The ROA for 2017 was 1.4% which was slightly smaller than in previous years which
were 4.88. The decline in the ROA was triggered by a gradual decrease in net income.
Gross Profit Margin: The gross profit margin is a measure of gross income and revenue.
The gross income is measured as a proportion of the net revenue. Adjustments in gross margin
and revenues affect the profitability
year 2016 2017 2018
sales 10,55
5
10,622 10,377
gross profit 4127 4089 4010
gross margin=gross
profit/sales
39.10
%
38.50
%
37.83
The gross profit margin of the company was fairly constant, ranging from 37.90% to 39.10%
and 37.83. This consistency emanates from the assumption that the revenue and distribution
prices have risen at about the same pace.
Net profit margin: The net profit margin is a ratio comparing the net profit and the sales.
Computing this ratio involves dividing the net profit by the total sales and converting it into a
percentage. This ratio provides an objective approach to assessing the company’s sales and costs
(Liang and Liu, 2018).
Year 2016 2017 2018
Sales 10,555 10,622 10,377
Net income after
tax
406 117 100
Net profit margin 3.85% 1.10% 0.24%
assets (%)
4.88 1.4 0.32
The ROA for 2017 was 1.4% which was slightly smaller than in previous years which
were 4.88. The decline in the ROA was triggered by a gradual decrease in net income.
Gross Profit Margin: The gross profit margin is a measure of gross income and revenue.
The gross income is measured as a proportion of the net revenue. Adjustments in gross margin
and revenues affect the profitability
year 2016 2017 2018
sales 10,55
5
10,622 10,377
gross profit 4127 4089 4010
gross margin=gross
profit/sales
39.10
%
38.50
%
37.83
The gross profit margin of the company was fairly constant, ranging from 37.90% to 39.10%
and 37.83. This consistency emanates from the assumption that the revenue and distribution
prices have risen at about the same pace.
Net profit margin: The net profit margin is a ratio comparing the net profit and the sales.
Computing this ratio involves dividing the net profit by the total sales and converting it into a
percentage. This ratio provides an objective approach to assessing the company’s sales and costs
(Liang and Liu, 2018).
Year 2016 2017 2018
Sales 10,555 10,622 10,377
Net income after
tax
406 117 100
Net profit margin 3.85% 1.10% 0.24%
Paraphrase This Document
Need a fresh take? Get an instant paraphrase of this document with our AI Paraphraser
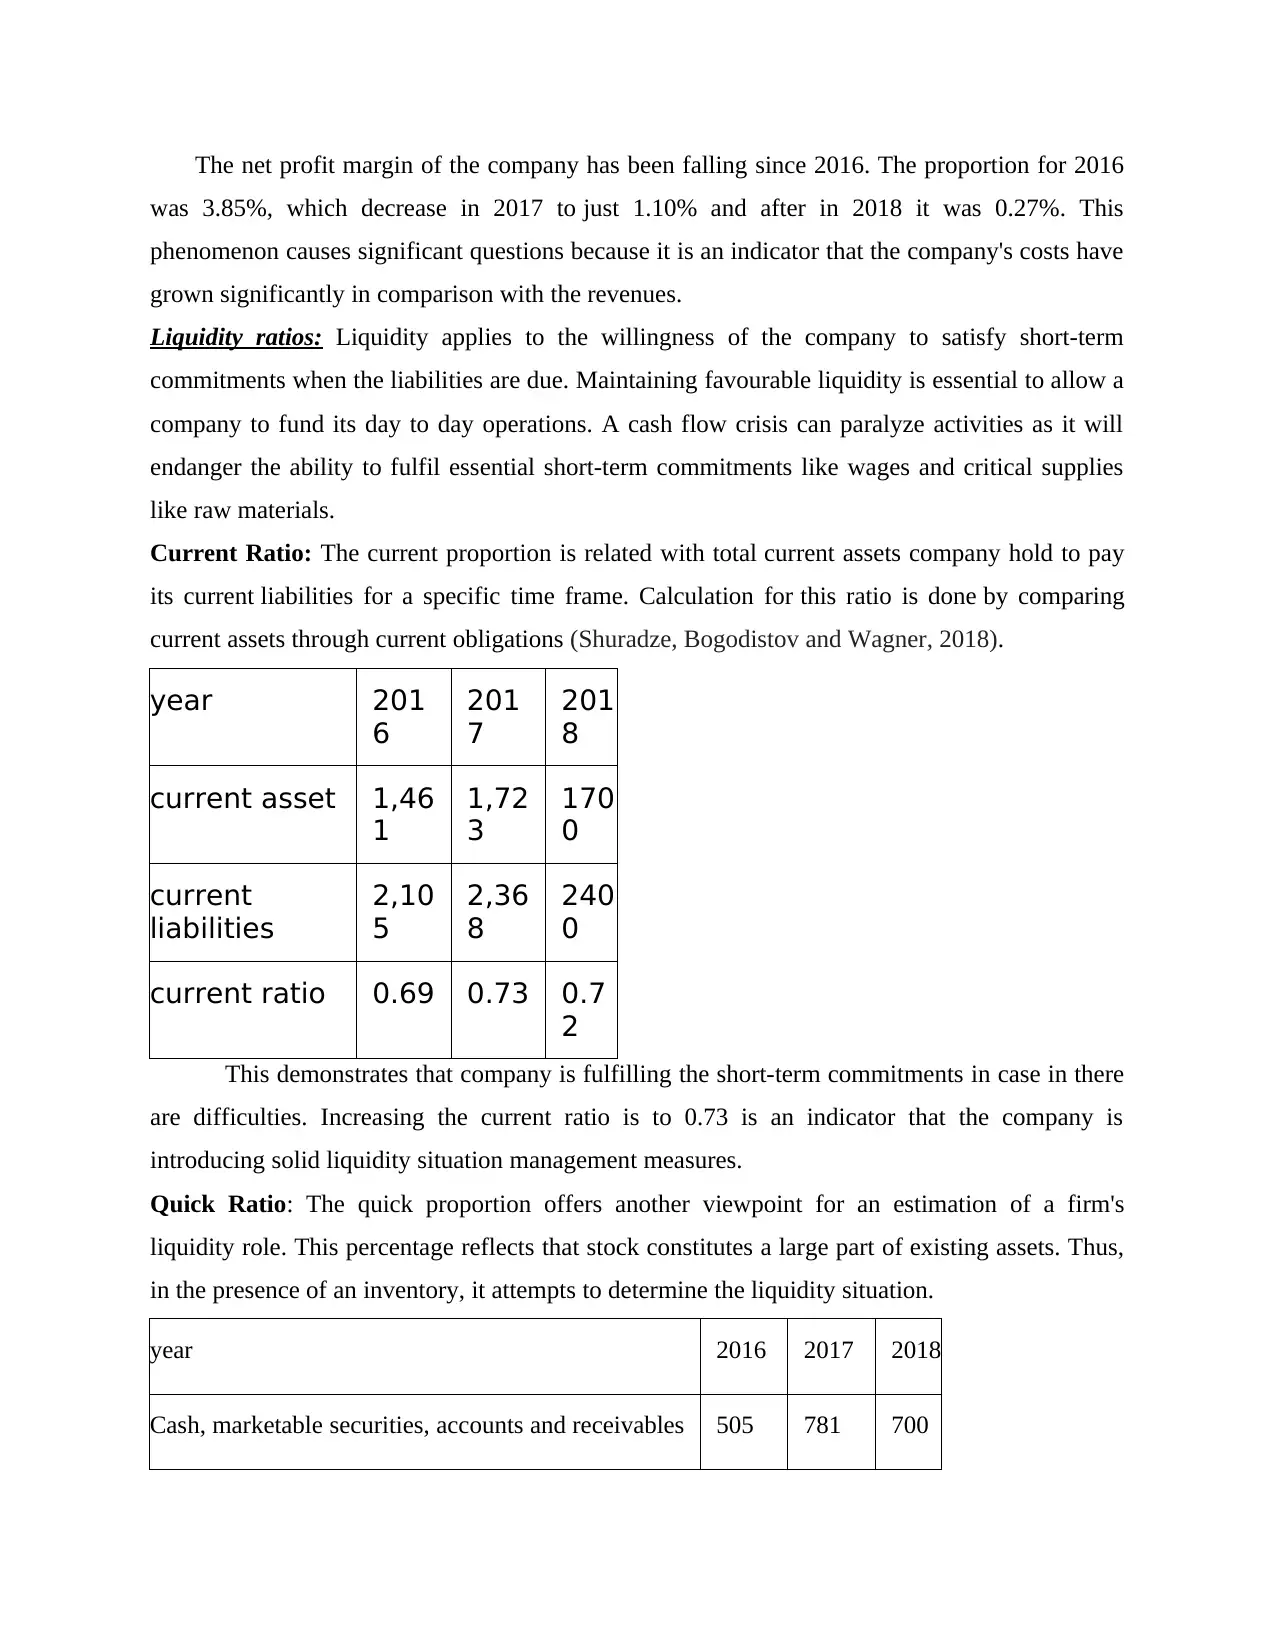
The net profit margin of the company has been falling since 2016. The proportion for 2016
was 3.85%, which decrease in 2017 to just 1.10% and after in 2018 it was 0.27%. This
phenomenon causes significant questions because it is an indicator that the company's costs have
grown significantly in comparison with the revenues.
Liquidity ratios: Liquidity applies to the willingness of the company to satisfy short-term
commitments when the liabilities are due. Maintaining favourable liquidity is essential to allow a
company to fund its day to day operations. A cash flow crisis can paralyze activities as it will
endanger the ability to fulfil essential short-term commitments like wages and critical supplies
like raw materials.
Current Ratio: The current proportion is related with total current assets company hold to pay
its current liabilities for a specific time frame. Calculation for this ratio is done by comparing
current assets through current obligations (Shuradze, Bogodistov and Wagner, 2018).
year 201
6
201
7
201
8
current asset 1,46
1
1,72
3
170
0
current
liabilities
2,10
5
2,36
8
240
0
current ratio 0.69 0.73 0.7
2
This demonstrates that company is fulfilling the short-term commitments in case in there
are difficulties. Increasing the current ratio is to 0.73 is an indicator that the company is
introducing solid liquidity situation management measures.
Quick Ratio: The quick proportion offers another viewpoint for an estimation of a firm's
liquidity role. This percentage reflects that stock constitutes a large part of existing assets. Thus,
in the presence of an inventory, it attempts to determine the liquidity situation.
year 2016 2017 2018
Cash, marketable securities, accounts and receivables 505 781 700

current liabilities 2,105 2,368 2030
quick ratio 0.27 0.34 0.29
The quick proportion of the company varies from 0.27 to 0.34 and 0.29 in the respective
firm 2016, 2017 and 2018 which is an indicator of a weak role of liquidity. While the
profitability of the company has increased, there is a flexibility issue which may restrict the
capacity of the company to satisfy short-term obligation.
Working Capital Management Ratios: Working capital management measures are used
to further assess the profitability of the company. However, also takes into consideration whether
a company is invested adequately in its existing assets.
Inventory Turnover: This ratio calculates the amount the product is being consumed
and replaced in respective year. This formula assists in determining inventory quality as the rate
at which product goods are traded varies (Skiera, 2016).
Year 201
6
201
7
201
8
inventory turnover
ratio
7.6
9
8.0
5
8.3
9
The turnover of the firm's assets varies from 8.6 to 7.69 times a year. The turnover is
comparatively stable. It means the disposal of the M&S product takes approximately 45 days.
Capital Structure Ratios: Ratios in capital structure measure the quality of a firm's funding
activities. A business is financed by equity, interest and profits retained. Controlling the structure
of the company aims to achieve the optimum mix of the three components.
Debt to Equity Ratio: This proportion contrasts overall debt with equity. The amount is
achieved by the separation of gross debt by equity of the lender. Debt is beneficial in that it helps
a business to make an income.
year 2016 2017 2018
short-term debt 297 518 530
long-term debt 1,72 1,663 1,663
⊘ This is a preview!⊘
Do you want full access?
Subscribe today to unlock all pages.
Trusted by 1+ million students worldwide
7
total debt 2024 2181 2181
equity 3,44
5
3,156 3,620
debt-equity ratio 0.52 0.54 0.56
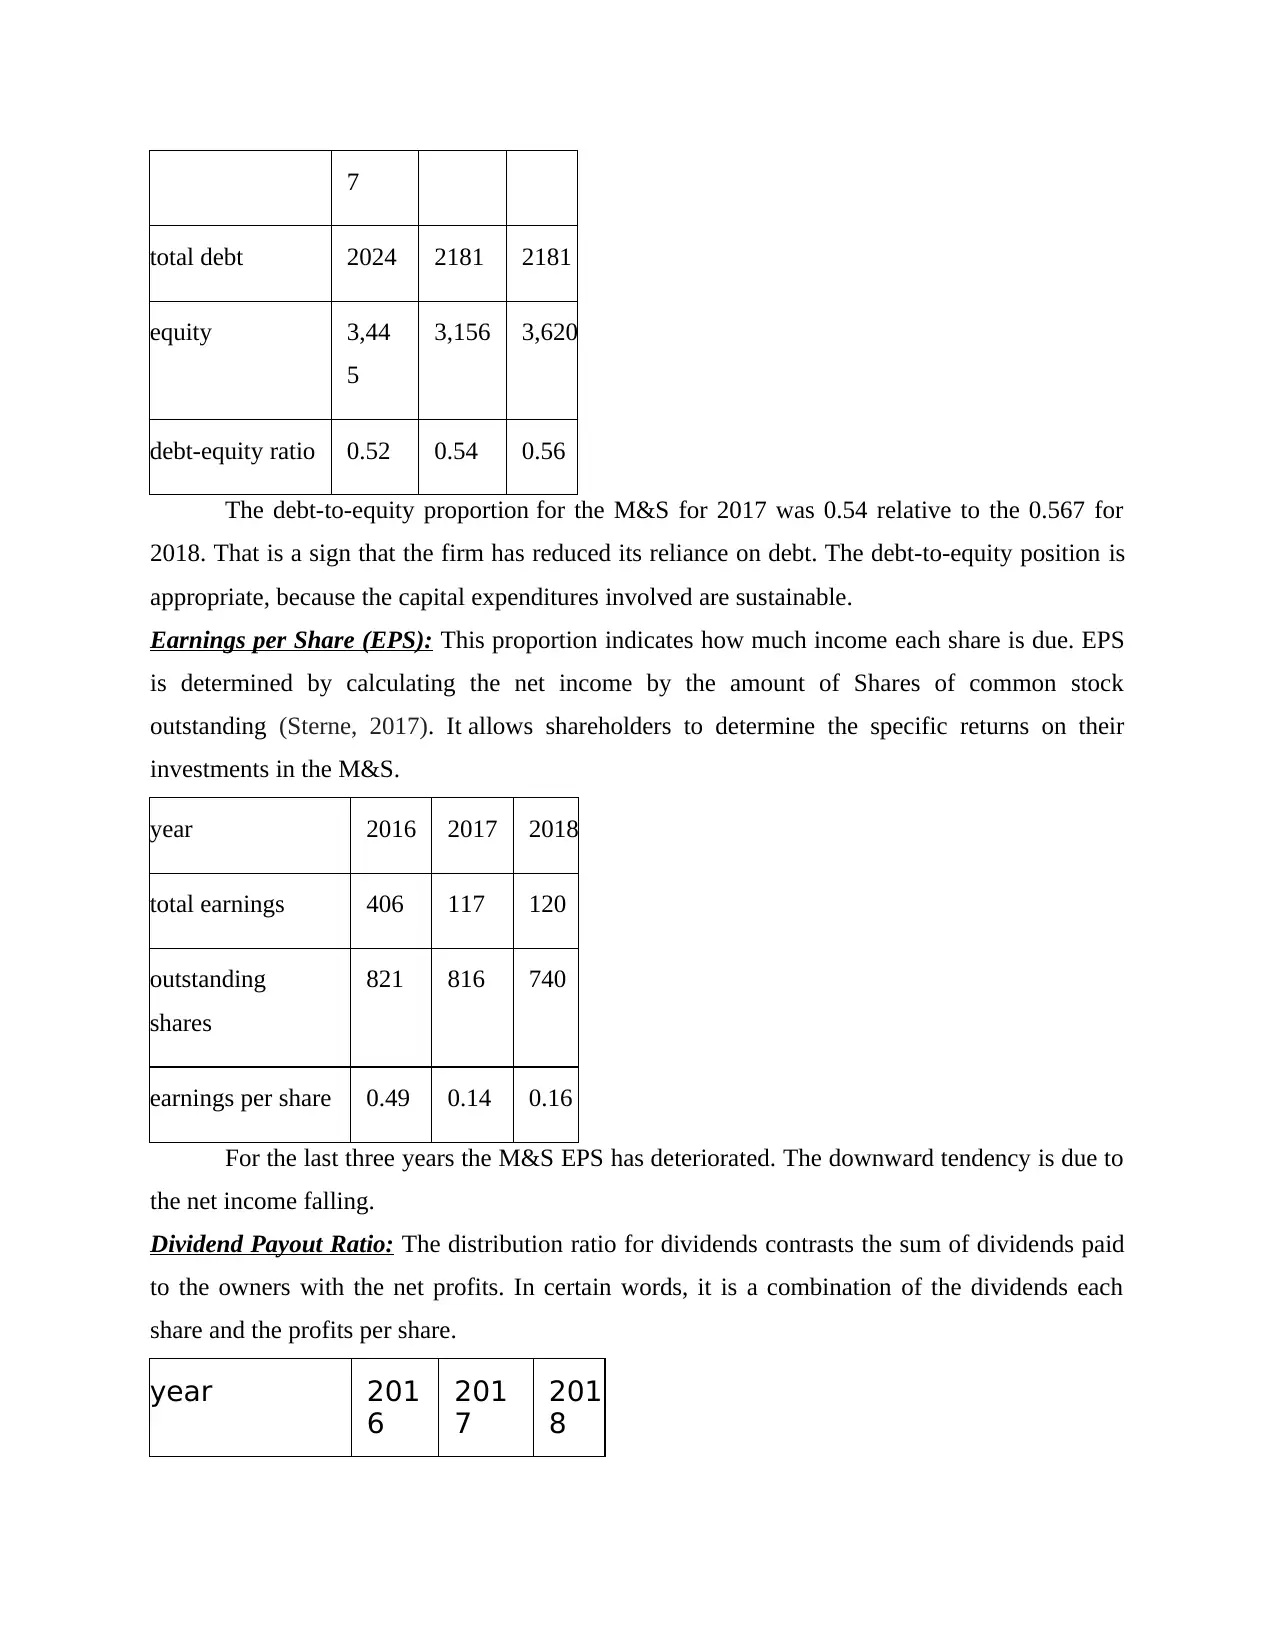
The debt-to-equity proportion for the M&S for 2017 was 0.54 relative to the 0.567 for
2018. That is a sign that the firm has reduced its reliance on debt. The debt-to-equity position is
appropriate, because the capital expenditures involved are sustainable.
Earnings per Share (EPS): This proportion indicates how much income each share is due. EPS
is determined by calculating the net income by the amount of Shares of common stock
outstanding (Sterne, 2017). It allows shareholders to determine the specific returns on their
investments in the M&S.
year 2016 2017 2018
total earnings 406 117 120
outstanding
shares
821 816 740
earnings per share 0.49 0.14 0.16
For the last three years the M&S EPS has deteriorated. The downward tendency is due to
the net income falling.
Dividend Payout Ratio: The distribution ratio for dividends contrasts the sum of dividends paid
to the owners with the net profits. In certain words, it is a combination of the dividends each
share and the profits per share.
year 201
6
201
7
201
8
total debt 2024 2181 2181
equity 3,44
5
3,156 3,620
debt-equity ratio 0.52 0.54 0.56
The debt-to-equity proportion for the M&S for 2017 was 0.54 relative to the 0.567 for
2018. That is a sign that the firm has reduced its reliance on debt. The debt-to-equity position is
appropriate, because the capital expenditures involved are sustainable.
Earnings per Share (EPS): This proportion indicates how much income each share is due. EPS
is determined by calculating the net income by the amount of Shares of common stock
outstanding (Sterne, 2017). It allows shareholders to determine the specific returns on their
investments in the M&S.
year 2016 2017 2018
total earnings 406 117 120
outstanding
shares
821 816 740
earnings per share 0.49 0.14 0.16
For the last three years the M&S EPS has deteriorated. The downward tendency is due to
the net income falling.
Dividend Payout Ratio: The distribution ratio for dividends contrasts the sum of dividends paid
to the owners with the net profits. In certain words, it is a combination of the dividends each
share and the profits per share.
year 201
6
201
7
201
8
Paraphrase This Document
Need a fresh take? Get an instant paraphrase of this document with our AI Paraphraser
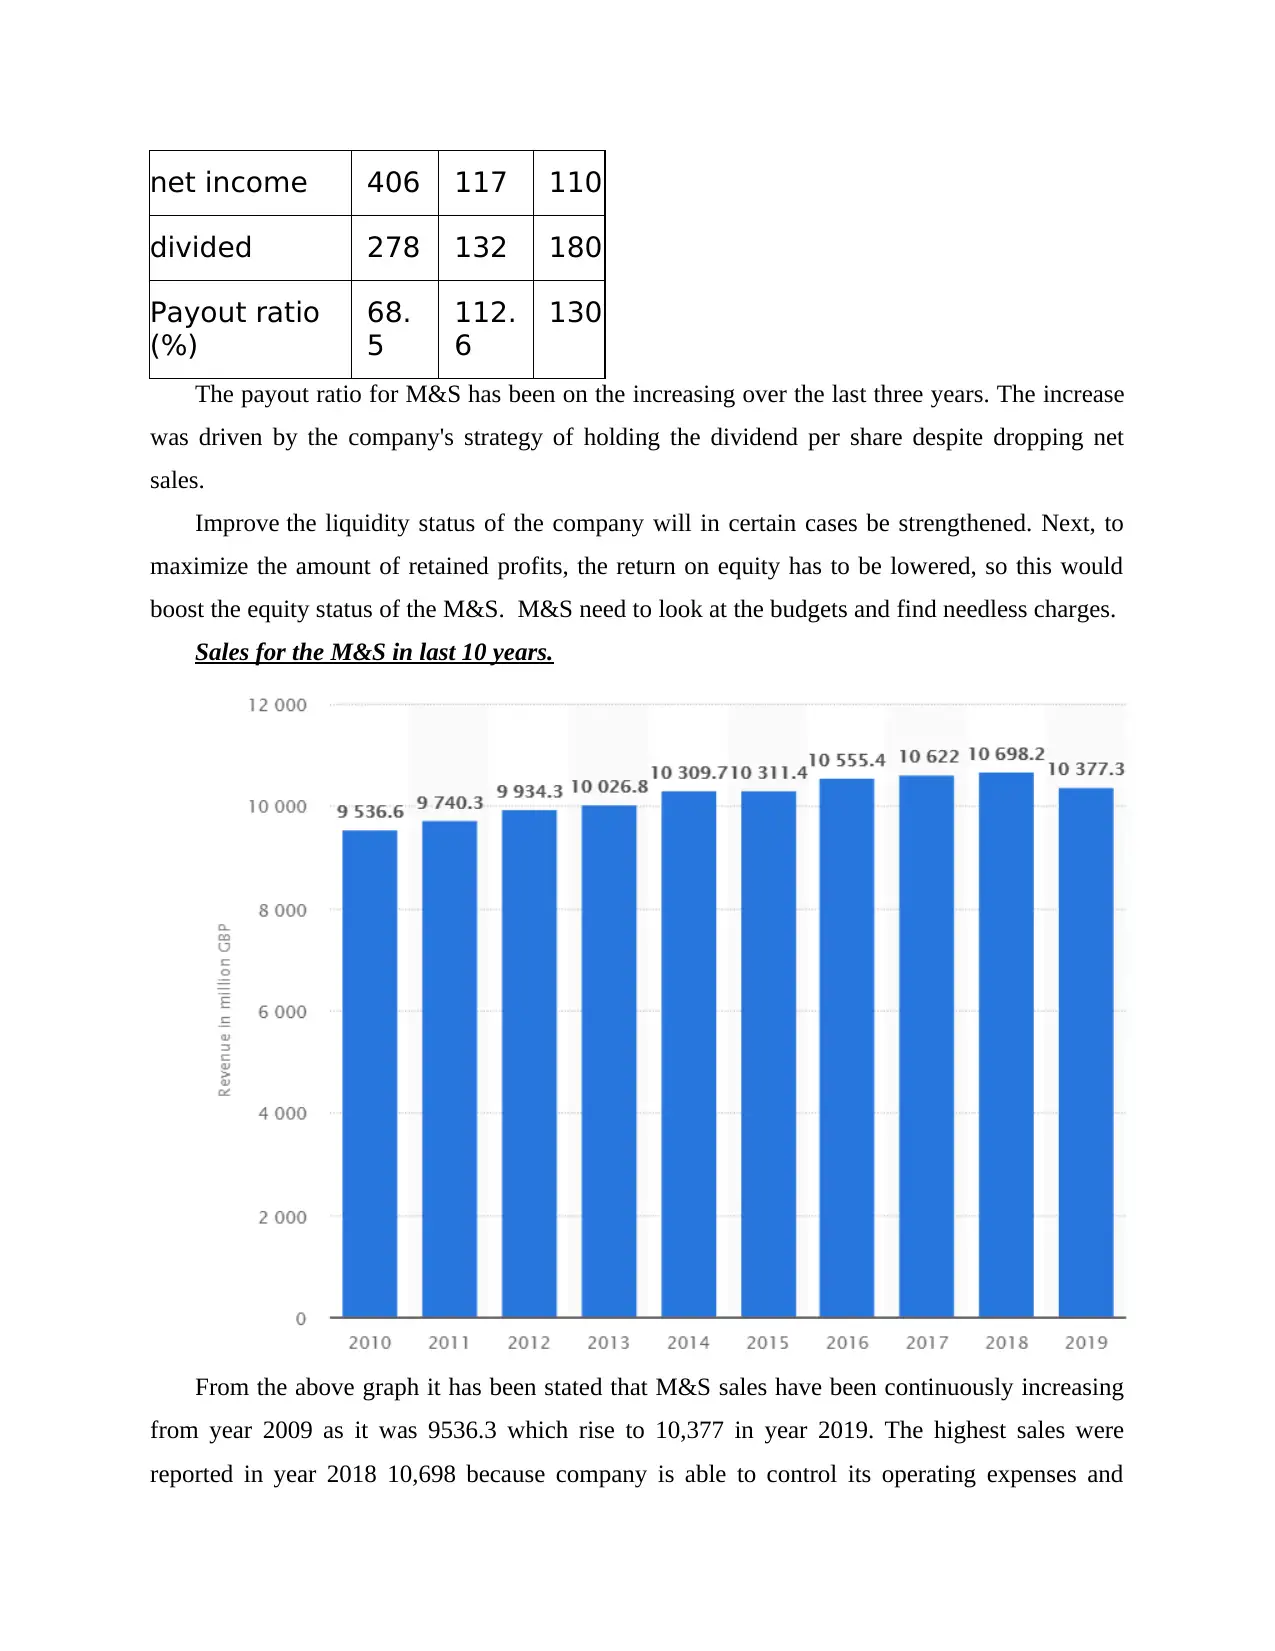
net income 406 117 110
divided 278 132 180
Payout ratio
(%)
68.
5
112.
6
130
The payout ratio for M&S has been on the increasing over the last three years. The increase
was driven by the company's strategy of holding the dividend per share despite dropping net
sales.
Improve the liquidity status of the company will in certain cases be strengthened. Next, to
maximize the amount of retained profits, the return on equity has to be lowered, so this would
boost the equity status of the M&S. M&S need to look at the budgets and find needless charges.
Sales for the M&S in last 10 years.
From the above graph it has been stated that M&S sales have been continuously increasing
from year 2009 as it was 9536.3 which rise to 10,377 in year 2019. The highest sales were
reported in year 2018 10,698 because company is able to control its operating expenses and
increase the overall sales revenue. In the very next year sales for M&S started again declining
due to over-expenses on unproductive business operations (About Marks and Spencer Group
plc, 2020).
Assessment of marks and spencer risk
Superior Customer Service Satisfaction: It is important to come together and make a
place in this growing sector and have outstanding customer relationships. It is really important
that consumers have a strong trust in the M&S. But due to uneven changes in the pricing policy
the customer have significantly a strong bond with other retail stores as compared to M&S.
Product Innovations and Advancement: There is a deficiency of product diversity which
was consider to be a big concern because M&S jammed up with the same thing for a long time.
This seems to be for the moment for company to add or make more choice or option for
customer in the product list.
Competition: It is important that the M&S must be aware of the pressure arising for the
rivals as these companies take urgent corrective measures on the market and that the appropriate
strategy will help to introduced new way of doing business in exiting business situation (Sun,
Sun and Strang, 2018).
Analyse the company’s competitive environment
External environment research helps M&S to consider the developments in the competitive
environment and keep one step forward then its rivals. This also aims to take on the current
world and meet consumer demands. The global world in which M&S works can be established
by an application of PESTEL that reveals just what is occurring beyond the company.
Political: Political judgment and situations are very crucial for M&S. War in Iraq is one of
the key factors of a downturn of the British economy. M&S encountered a difficult position
because of the changes in policy. Change in policy introduces fresh economic strategies that play
a role in the development of companies. Cutting public expenditure is also another political
decision which is also a major obstacle in business development.
Economic: The country's economic condition is the element that can keep the M&S
Company under pressure. The new government has raised the VAT from 17.5 per cent to 20 per
cent, which has triggered the revenue drop in M&S. Recession in last period has assumed a
critical part in the collapse of M&S. M&S is currently trying to regain its best position because
the economic trends are shifting in a favourable direction (Verhoef, Kooge and Walk, 2016).
⊘ This is a preview!⊘
Do you want full access?
Subscribe today to unlock all pages.
Trusted by 1+ million students worldwide
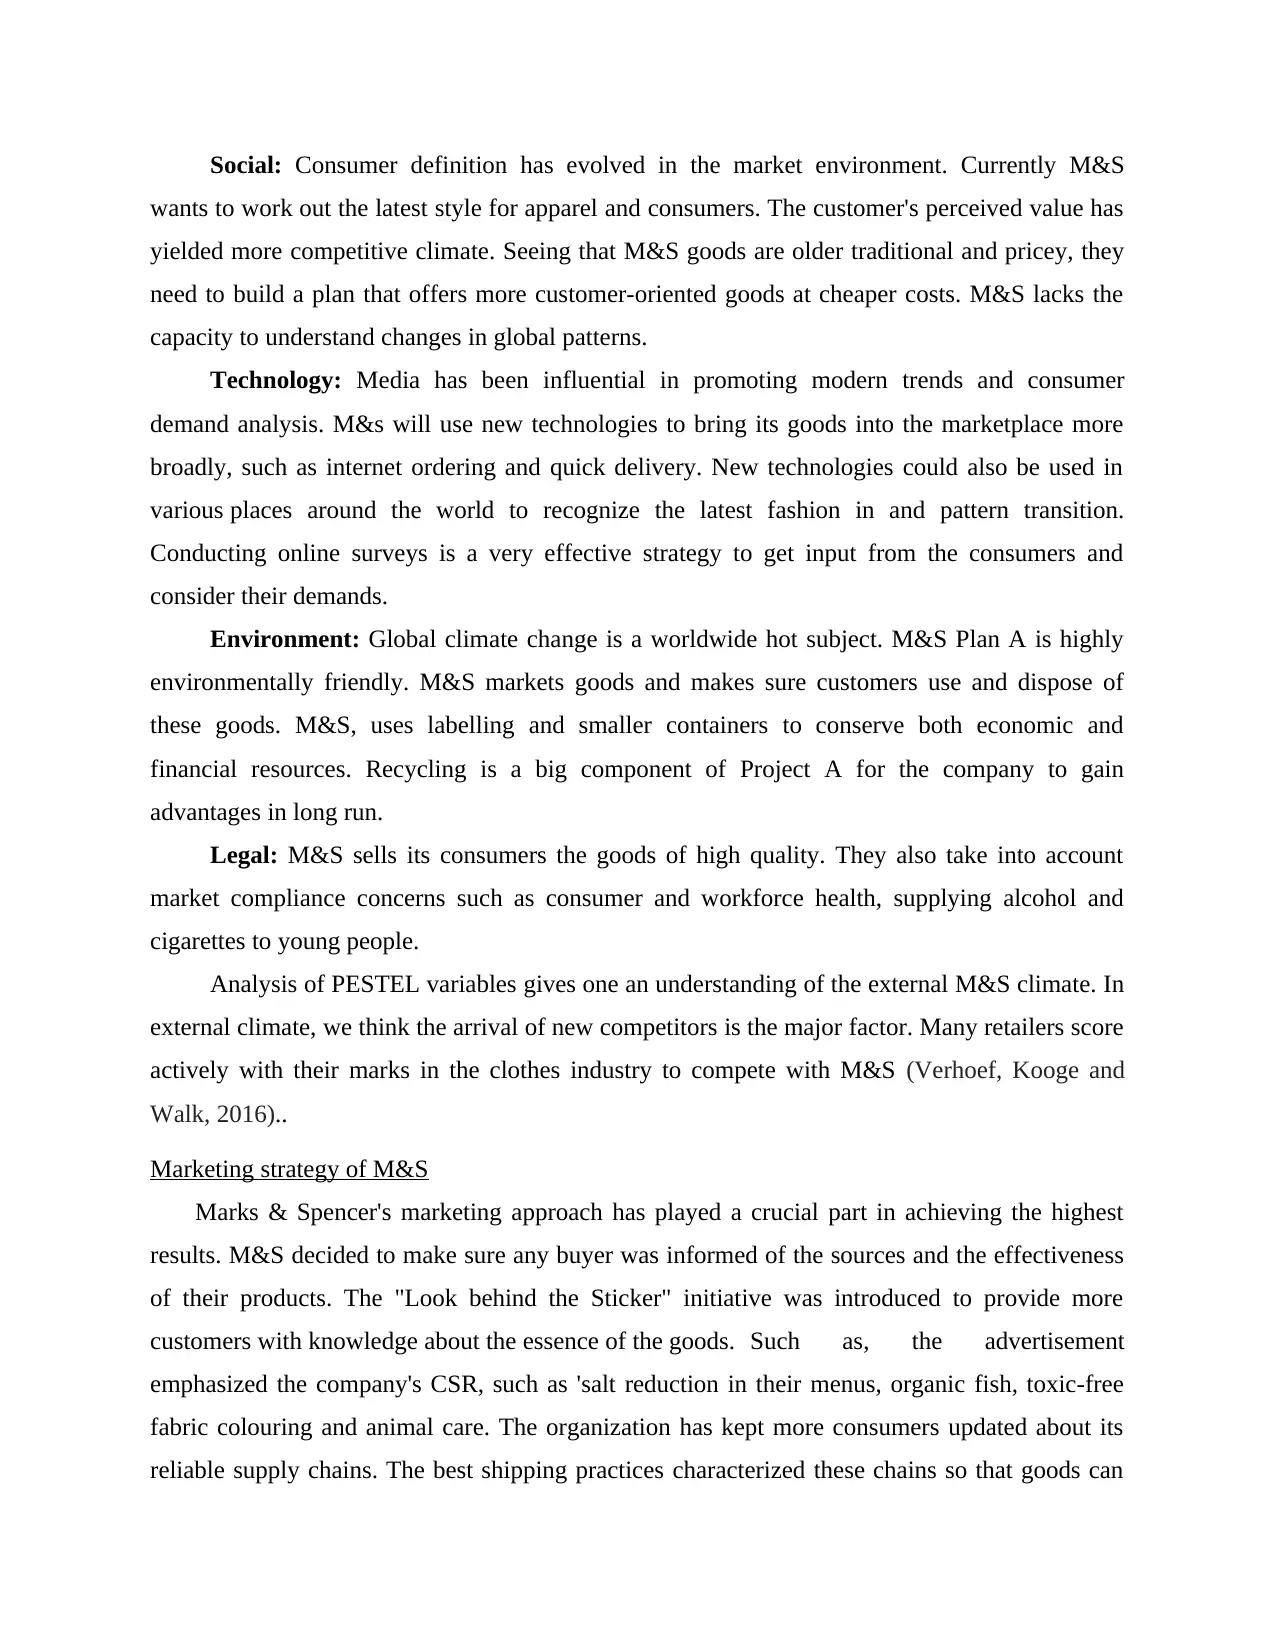
Social: Consumer definition has evolved in the market environment. Currently M&S
wants to work out the latest style for apparel and consumers. The customer's perceived value has
yielded more competitive climate. Seeing that M&S goods are older traditional and pricey, they
need to build a plan that offers more customer-oriented goods at cheaper costs. M&S lacks the
capacity to understand changes in global patterns.
Technology: Media has been influential in promoting modern trends and consumer
demand analysis. M&s will use new technologies to bring its goods into the marketplace more
broadly, such as internet ordering and quick delivery. New technologies could also be used in
various places around the world to recognize the latest fashion in and pattern transition.
Conducting online surveys is a very effective strategy to get input from the consumers and
consider their demands.
Environment: Global climate change is a worldwide hot subject. M&S Plan A is highly
environmentally friendly. M&S markets goods and makes sure customers use and dispose of
these goods. M&S, uses labelling and smaller containers to conserve both economic and
financial resources. Recycling is a big component of Project A for the company to gain
advantages in long run.
Legal: M&S sells its consumers the goods of high quality. They also take into account
market compliance concerns such as consumer and workforce health, supplying alcohol and
cigarettes to young people.
Analysis of PESTEL variables gives one an understanding of the external M&S climate. In
external climate, we think the arrival of new competitors is the major factor. Many retailers score
actively with their marks in the clothes industry to compete with M&S (Verhoef, Kooge and
Walk, 2016)..
Marketing strategy of M&S
Marks & Spencer's marketing approach has played a crucial part in achieving the highest
results. M&S decided to make sure any buyer was informed of the sources and the effectiveness
of their products. The "Look behind the Sticker" initiative was introduced to provide more
customers with knowledge about the essence of the goods. Such as, the advertisement
emphasized the company's CSR, such as 'salt reduction in their menus, organic fish, toxic-free
fabric colouring and animal care. The organization has kept more consumers updated about its
reliable supply chains. The best shipping practices characterized these chains so that goods can
Paraphrase This Document
Need a fresh take? Get an instant paraphrase of this document with our AI Paraphraser
be delivered at exact time and date. The plan sought to ensure that all business systems become
effective. The 'main goals were to become carbon neutral, expand renewable procurement, better
the lives of more people, promote healthy lifestyles for workers and customers, and submit waste
for recycling.' This program encouraged more consumers to purchase the goods from the
company. The method promoted the marketing strategies of the organization and made it more
competitive.
Thus M&S used the CSR principle to help its marketing campaign. The business is
focussing on the growing number of eco-friendly customers in entire world (Verhoef, Kooge and
Walk, 2016). M&S is now focussing on various people's needs and offer them superior quality
goods and services. The business is providing the shoppers correct details. Often, it takes
seriously the collective identity of the intended buyers. The marketing cycle is distinguished by
effective R&D strategies and can produce safe goods. Packaging of goods is performed in a
responsible way. It has to be properly planned and enforced to track and assess within a defined
time-limit. This tests the success and feasibility of the Action plan's intended results. This
performance can be held and tracked by consumer reactions, industry competition and market
share. Evaluation offers an in-depth review of whether or not the delivery plan has reached the
target targets. On the basis of market share customer input, product demand and success in
financial productivity can be measured at the end of the financial year.
CONCLUSION
In the end of report, it is founded that it is difficult to analyse analytics separately from
metrics, but describing the differences is also important with the support of data analysis. The
M&S will be replacing long-term loans with short-term funding. Cost management strategy-the
rising costs of the business are to account for the raising income. M&S works in a highly
competitive setting and its rivals are more consumer-oriented and in line with customer
expectations and business requirements.
REEFRENCES
Books and Journals
Choi, T. M., Wallace, S. W. and Wang, Y., 2018. Big data analytics in operations
management. Production and Operations Management, 27(10), pp.1868-1883.
Liang, T. P. and Liu, Y. H., 2018. Research landscape of business intelligence and big data
analytics: A bibliometrics study. Expert Systems with Applications, 111, pp.2-10.
Shuradze, G., Bogodistov, Y. and Wagner, H. T., 2018. The role of marketing-enabled data
analytics capability and organisational agility for innovation: empirical evidence from
german firms. International Journal of Innovation Management, 22(04), p.1850037.
Skiera, B., 2016. Data, data and even more data: Harvesting insights from the data
jungle. Marketing Intelligence Review, 8(2), pp.10-17.
Sterne, J., 2017. Artificial intelligence for marketing: practical applications. John Wiley & Sons.
Sun, Z., Sun, L. and Strang, K., 2018. Big data analytics services for enhancing business
intelligence. Journal of Computer Information Systems, 58(2), pp.162-169.
Verhoef, P., Kooge, E. and Walk, N., 2016. Creating value with big data analytics: Making
smarter marketing decisions. Routledge.
Online
About Marks and Spencer Group plc. 2020. [Online] Available Through:
<https://www.marksandspencer.com/>
⊘ This is a preview!⊘
Do you want full access?
Subscribe today to unlock all pages.
Trusted by 1+ million students worldwide
1 out of 12
Related Documents


Your All-in-One AI-Powered Toolkit for Academic Success.
+13062052269
info@desklib.com
Available 24*7 on WhatsApp / Email
![[object Object]](/_next/static/media/star-bottom.7253800d.svg)
Unlock your academic potential
Copyright © 2020–2026 A2Z Services. All Rights Reserved. Developed and managed by ZUCOL.