Comparative Financial Analysis: Marks & Spencer vs Sainsbury Plc
VerifiedAdded on 2020/02/12
|15
|4231
|128
Report
AI Summary
This report provides a comprehensive financial analysis of Marks & Spencer (M&S) and Sainsbury Plc, two leading UK retail companies. It examines their financial performance through ratio analysis, including liquidity (current and quick ratios), profitability (net profit margin, ROA, and ROE), and solvency (debt-to-equity and interest-bearing ratios). The analysis covers the years 2015 and 2016, highlighting changes in capital structure and sources of finance (long-term and short-term). The report also explores bond valuation techniques and international bond rating agencies. The findings indicate that M&S has a stronger liquidity position, while both companies maintain sound solvency. The report concludes with an overview of the limitations of ratio analysis and provides valuable insights into the financial management practices of both companies, making it a useful resource for students studying finance.
Financial management
1
1
Paraphrase This Document
Need a fresh take? Get an instant paraphrase of this document with our AI Paraphraser
Executive Summary
Financial management is highly concerned with making optimum use of monetary resources
through the means of continuous monitoring and control. This report is based on M&S and its
competitor firm such as Sainsbury Plc. Both are the leading companies of UK retail sector that
offers quality products or services to the customers at suitable price level. It can be summarized that
M&S has sound liquidity position in comparison to the competitor. Further, it can be presented that
profitability position of M&S is good and generated good return over their sales made. It also has
been concluded that solvency position of both M&S and Sainsbury Plc is sound. It can be seen in
the report that by using bond valuation techniques investors can take suitable decision. Besides this,
it can be inferred that company’s bonds value is highly influences from coupon rate.
2
Table of Contents
INTRODUCTION................................................................................................................................3
(A) Ratio analysis............................................................................................................................3
1. Comment on the liquidity position using current and quick ratio...............................................3
2. Calculation of net profit margin, ROA and ROE.........................................................................4
3. Calculation of capital structure ratios..........................................................................................5
4. Comment on the long-term and short-term sources of finance...................................................5
(B) Bond valuation, international bond rating agencies and reasons for maintaining a given target
rating................................................................................................................................................7
CONCLUSION....................................................................................................................................8
REFERENCES.....................................................................................................................................9
APPENDIX.........................................................................................................................................11
Marks and Spencer’s ratio analysis................................................................................................11
Sainsbury’s ratio analysis...............................................................................................................11
3
⊘ This is a preview!⊘
Do you want full access?
Subscribe today to unlock all pages.
Trusted by 1+ million students worldwide
INTRODUCTION
In the globally connected corporate world, companies started paying special attention on
managing their funds. Certified Financial Manager (CFO) owes liability to procure necessary
capital for running their operations and administrate it in an effective manner to attain the set goals.
Planning, organizing, monitoring and controlling the monetary activities i.e. procurement & fund
utilization and its effective management is called financial management. Profitability and liquidity
management are the two core activities of finance manager. In addition, he also has to determine
various fixed and fluctuating source of capital either long-term debt or equity capital or a
combination of both to finance their long-term assets. The proposed project report emphasizes upon
examining the financial performance of Marks and Spencer Group Plc with its rivalry firm,
Sainsbury Plc. Moreover, lastly, it will make bond valuation of both the companies.
(A) Ratio analysis
Ratio analysis is the quantitative technique that is helpful for analysing the financial
statement using distinctive kind of ratios i.e. solvency, profitability, liquidity and efficiency ratios as
well.
1. Comment on the liquidity position using current and quick ratio
Liquidity ratios are helpful to determine firm’s ability to dispose off their short-term debt
obligations & its margin of safety using current & quick ratio.
Current ratio: It determines working capital (WC) in the business through the comparison
of current assets with the current liabilities. In latest year, 2016, M&S’s CR remains unchanged
from 0.69:1 because of little bit changes in the CA and CL by 0.41% and -0.33%. Fewer increases
in cash by 4m, inventory by 2m, prepaid expense by 10m and decline in other assets by 9m resulted
decline in CA by 6m. However, CL dropped from 2,112m to 2,105m which brought no change in
the liquidity position. In contrast, Sainsbury’s CR gone up from 0.64 to 0.66 because of decline in
inventory and cash to 968m and 1143m. It is below than M&S’s CR which indicates that M&S has
sound liquidity position in comparison to the competitor (Lakshmi, Martin and Venkatesan, 2016).
In comparison to industrial benchmark, 2:1, both the firm’s can be suggested to improve their
liquidity by increasing their resource availability & reduce short-term debt load. Moreover, it must
monitor their accounts receivables to get prompt payments and negotiate with the vendors for the
longer credit terms which help in effective cash management.
Quick ratio: It measures relationship between liquid assets with the current liabilities. In
CY, 2016, M&S’s QR remains fixed to 0.31:1 whilst Sainsbury’s QR gone up from 0.49:1 to 0.52:1.
High ratio of Sainsbury reflects that it has higher availability of liquid assets to dispose off their
4
Paraphrase This Document
Need a fresh take? Get an instant paraphrase of this document with our AI Paraphraser
trade payables and other short-term debt (Goldmann, 2017). Idle industrial quick ratio is 1:1 which
demonstrates that liquid assets and current obligations must be equal for having sound
creditworthiness. Effective cash management plan needs to be designed by negotiating suppliers for
extending the credit duration and receiving cash quickly from the debtors. Profitability
management, reduction in overheads and reduction in unproductive assets also may drive better
liquidity position (Adekola, Samy and Knight, 2017).
2. Calculation of net profit margin, ROA and ROE
M&S and Sainsbury both are profit-centric organization which aims at maximizing their net
return by generating larger revenue at controlled cost so that maximum profitability can be gained.
Net profit margin: This tool measures net margin by dividing the net organizational return
to the total turnover. In CY 2016, M&S’s NM dropped from 4.72% to 3.86% due to increase in cost
of sales and other operational expenditures by 1.49% and 7.76% however turnover gone up by only
2.37%. High cost of selling & administration expenditures to boost sales by driving larger audiences
also result in high overheads and lower return (Bibi and Amjad, 2017). In contrast, Sainsbury’s
NPM converted from loss of 0.70% to 2% profitability because of decline in administrative cost by
24.91% and stronger control over the regular spending. High ratio of M&S indicates that its
profitability position is good and generated good return over their sales made.
Return on assets (ROA): It measures the percentage return on total assets of the firm.
M&S’s ROA grown from 5.94% to 4.80% because of greater assets and decreased net return,
however, Sainsbury’s ROA moved from loss of -1% to 2.77% because of positive net earnings
through controlled overheads. M&S’s ROA is approximately twice to that of Sainsbury reflecting
that it gained better return on their assets (Boyas and Teeter, 2017).
Return on equity (ROE): Du-pont analysis is helpful for determining the profit percentage
on total equity capital invested. It break-down ROE calculation into three different parts that are net
margin, assets turnover and equity multiplier.
Dupont analysis: Net margin*assets turnover*Equity multiplier
In CY 2016, M&S’s ROE came down from 15.23% to 11.87% because of decreased NPM,
assets utilization efficiency and financial leverage to 3.86%, 1.25 times and 2.46 as well. Inefficient
and ineffective use of total assets by the managers to get better revenues resulted downward shifting
in assets turnover (Rakićević and et.al., 2016). However, declined leverage shows that shows more
equity capital in relation to the total business assets. In comparison to this, Sainsbury’s ROE shows
a favourable change from 3% to 7.40% because of increase in NPM to 2%. Unlike it, assets
turnover ratio came down to 1.38 times and equity multiplier to 2.67 due to repayment of long-term
5
borrowings. Comparatively, it is higher in Sainsbury demonstrates that it has generated better return
over their total equity capital invested in the corporation (Sainsbury’s annual report, 2016).
3. Calculation of capital structure ratios
Debt to equity ratio: Capital structure deals with the longer period financial sources which
can be obtained either by the borrowings and shareholder equity. Debt to equity ratio is the best one
that figure out the composition of debt capital and owner’s equity to finance the long-term assets.
M&S’s D/E ratio came down from 0.53:1 to 0.50:1, thus, it reached to the industry benchmark,
whereas Sainsbury’s D/E ratio decreased from 0.42:1 to 0.32:1. Raising higher capital from the
equity source by YOY growth of 7.66% and less borrowed capital by 1.71% reduced leverage in
M&S. On the other side, Sainsbury finance manager raised money only through investors as its
annual financial account reported YOY growth of 14.91% whilst 12.15% debt were repaid this year
to minimize the leverage (Nelson and Gnanapragasam, 2016). Reduction in leverage mainly created
with the purpose of decreasing fixed financial obligations in the terms of interest by raising money
through investors for financing non-current assets.
Interest bearing ratio: This ratio is also essential to be analyze because firm can only take
additional borrowings if it has enough or adequate availability of profit to pay interest on scheduled
date to the lenders. In 2016, M&S’s interest bearing ratio dropped down from 4.87 times to 4.03
times because excessive overheads resulted poor return (Shukla and Roopa, 2017). However,
Sainsbury’s interest bearing ratio improved from -0.92 to 2.82 times due to less interest obligations
and better return worth 471m in current year. However, comparatively, M&S has high capacity to
meet fixed interest obligations on time and able to take borrowings.
Now, as per the scenario, if M&S has requested a loan to satisfy their capital requirement
then although, undoubtedly, it had strengthen its debt bearing ability but still as company has just
reached the idle ratio therefore, it can be suggested to procure capital for longer capital using both
the debt & equity instead of loan only (Marks and Spencer’s annual report, 2016). Receiving
money only through debt brings into greater fixed financial burden and resulted decline in net profit
margin due to heavy finance cost which will have an adverse impact on its performance. Thus, it
can be recommended to the M&S to procure required fund by a combination of equity & debt to
maintain their solvency position by designing a right capital structure.
4. Comment on the long-term and short-term sources of finance
Sources of capital
2015
(In GBPm)
2016
(In GBPm)
%
increase/decrease
Long-term debt 1698 1727 1.71%
6
⊘ This is a preview!⊘
Do you want full access?
Subscribe today to unlock all pages.
Trusted by 1+ million students worldwide
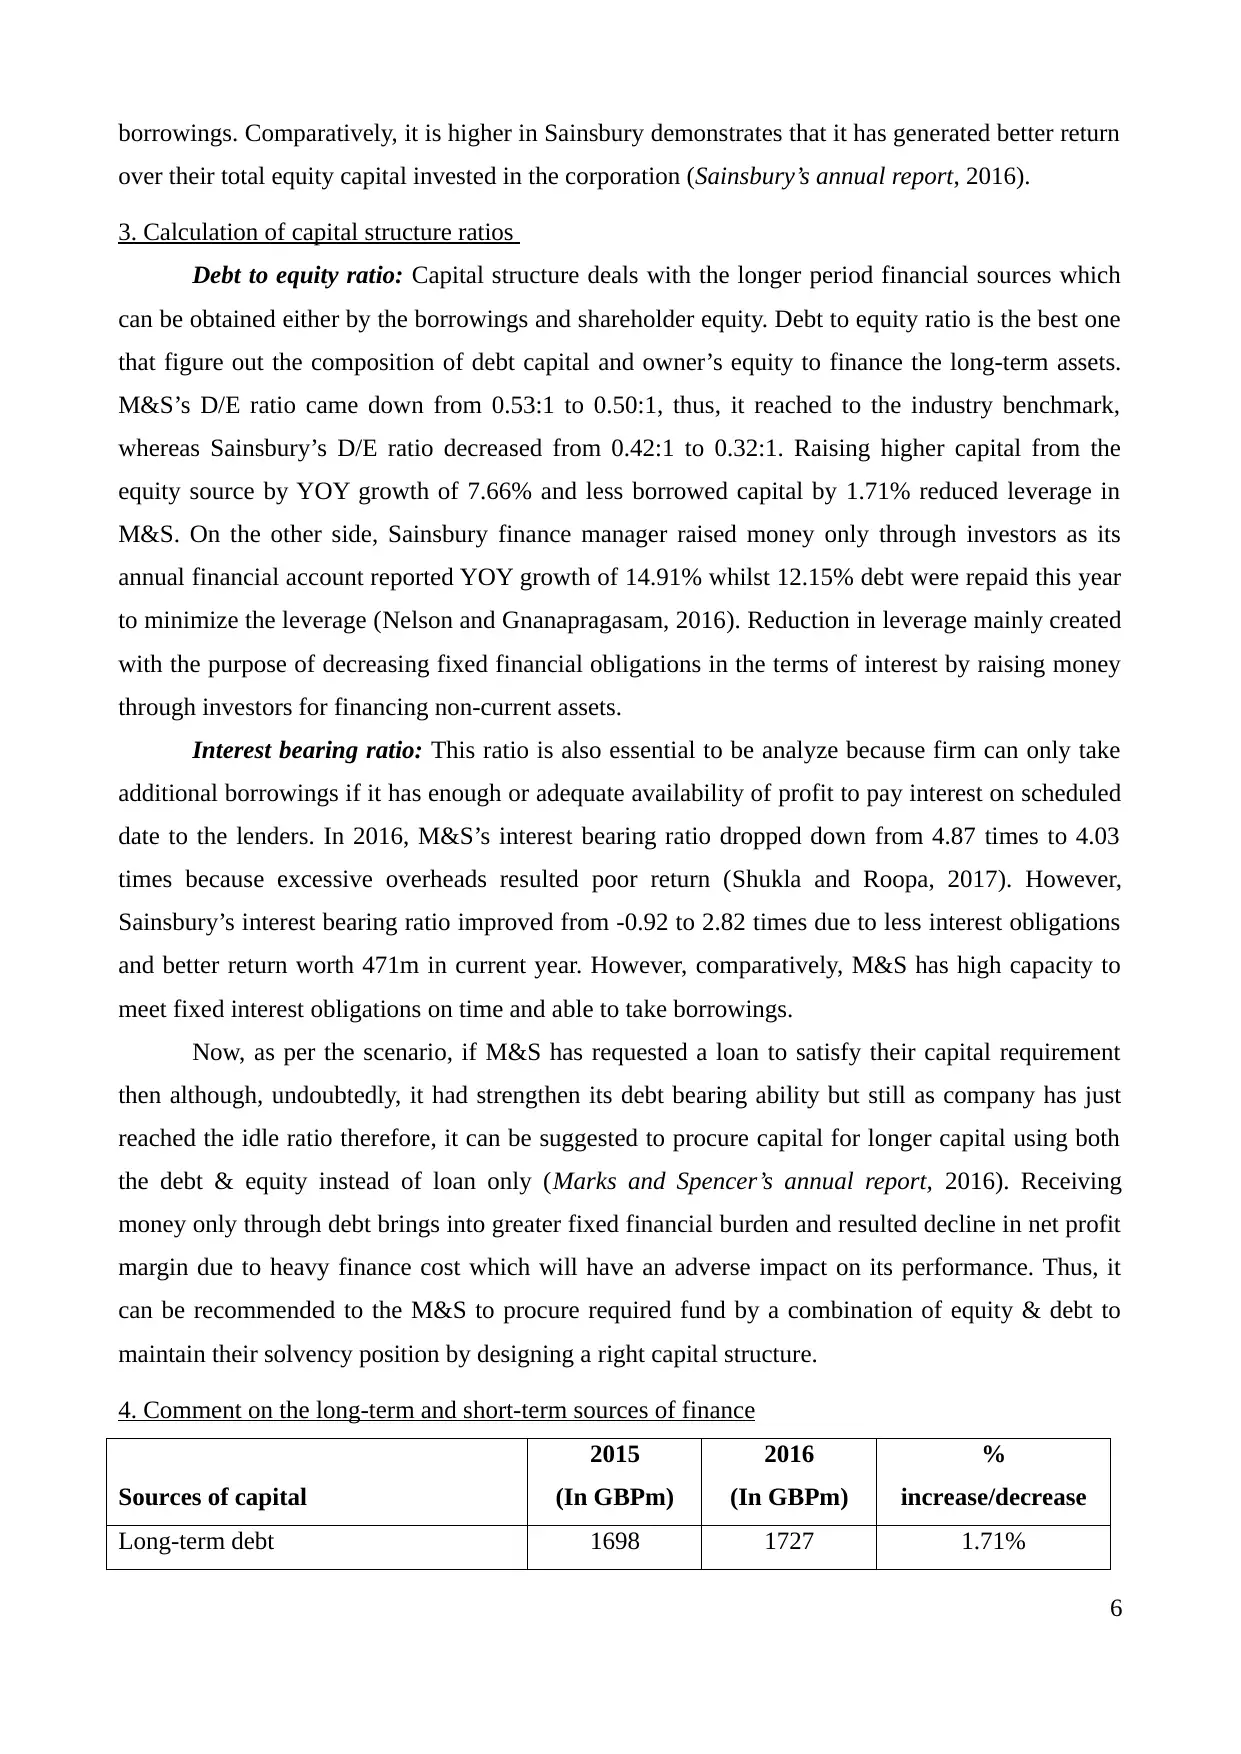
Shareholder's equity 3200 3445 7.66%
Looking to the Marks and Spencer’s annual reports, it can be seen that under the long-term
financial sources, it utilized both the debt borrowings and shareholders’ investment. In the year
2015, M&S’s total debt fund reported to 1,698m GBP which raised to 1,727m by 1.71% in the year
2016 so as to finance their non-current assets, fixture and equipments, property and plant (Room,
2016). However, on the other hand, its investor equity capital in the year 2015 reported to 3,200m
which rose to 3,445m GBP by 7.66% in 2016.
Sources of capital
2015
(In GBPm)
2016
(In GBPm)
%
increase/decrease
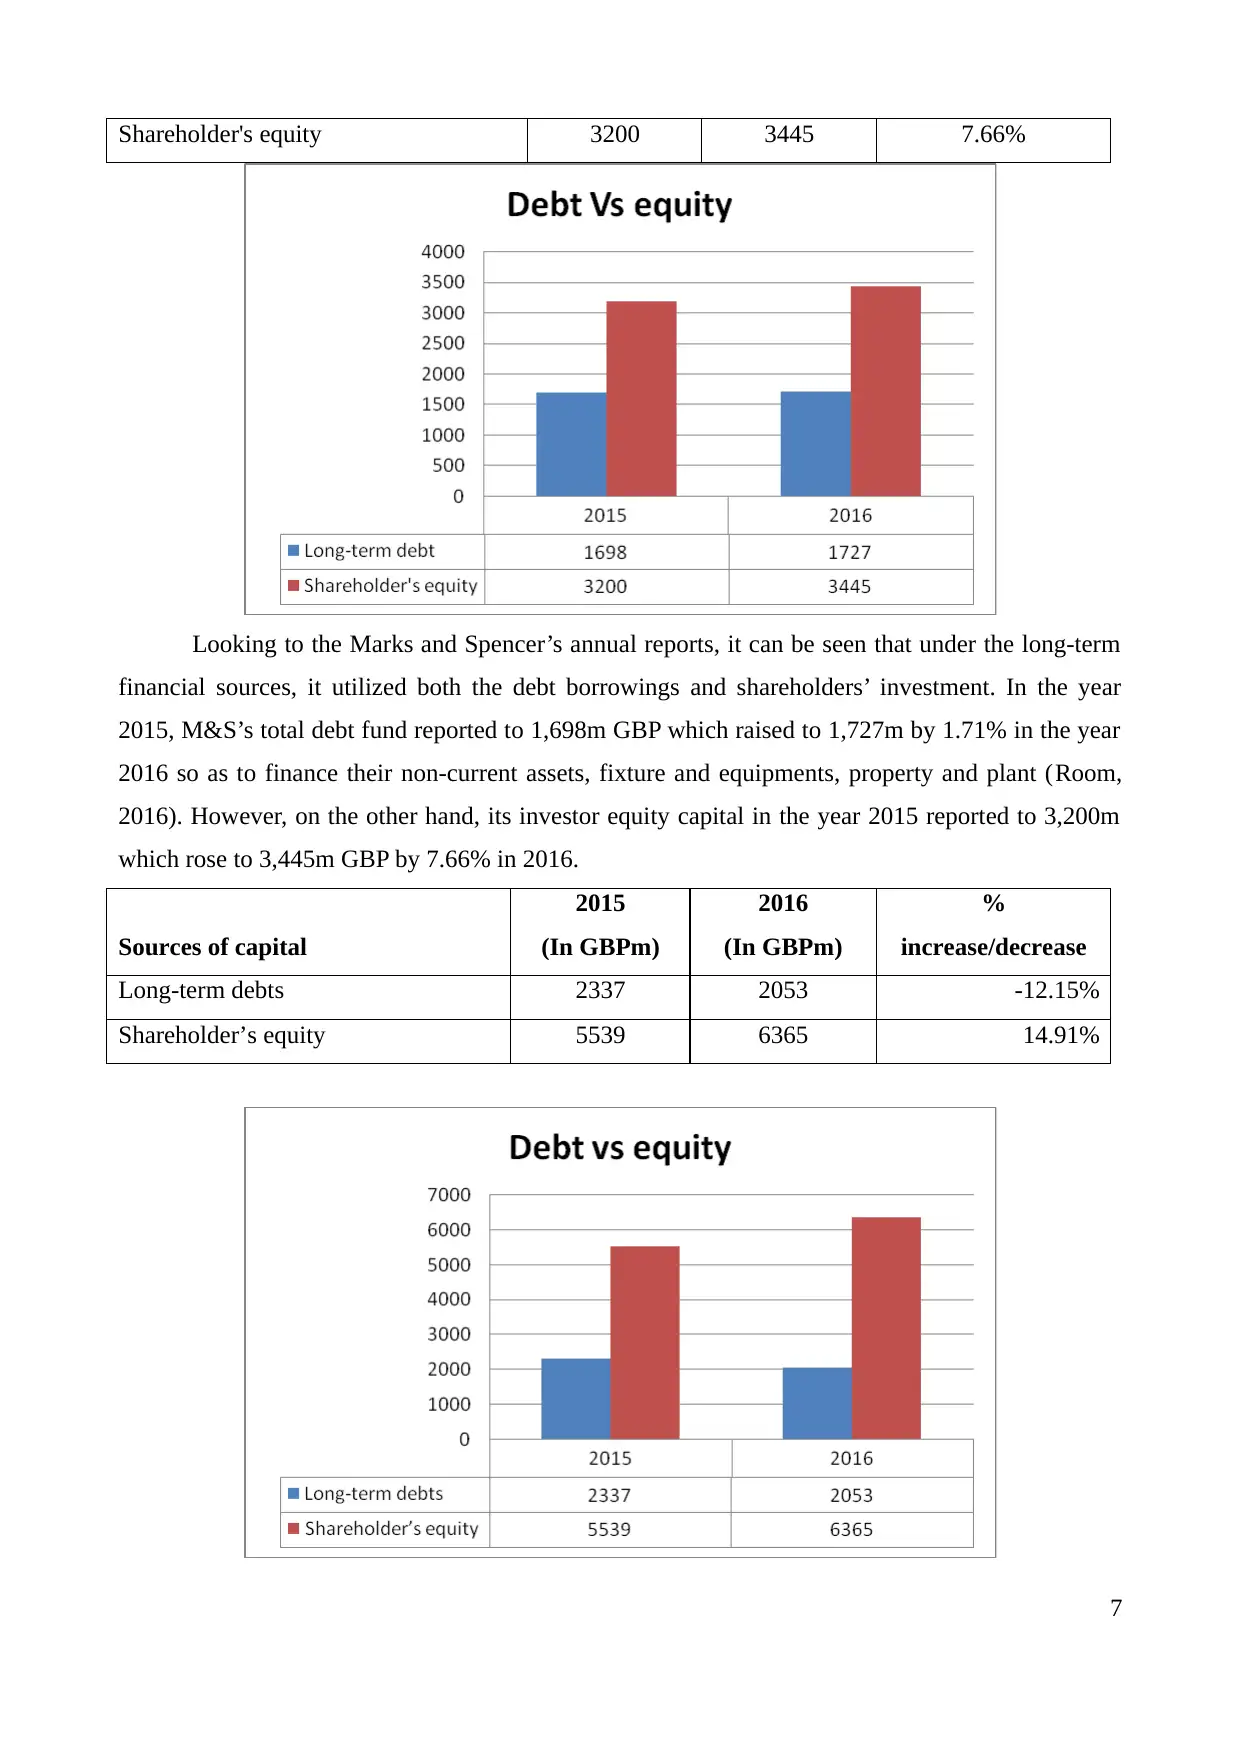
Long-term debts 2337 2053 -12.15%
Shareholder’s equity 5539 6365 14.91%
7
Looking to the Marks and Spencer’s annual reports, it can be seen that under the long-term
financial sources, it utilized both the debt borrowings and shareholders’ investment. In the year
2015, M&S’s total debt fund reported to 1,698m GBP which raised to 1,727m by 1.71% in the year
2016 so as to finance their non-current assets, fixture and equipments, property and plant (Room,
2016). However, on the other hand, its investor equity capital in the year 2015 reported to 3,200m
which rose to 3,445m GBP by 7.66% in 2016.
Sources of capital
2015
(In GBPm)
2016
(In GBPm)
%
increase/decrease
Long-term debts 2337 2053 -12.15%
Shareholder’s equity 5539 6365 14.91%
7
Paraphrase This Document
Need a fresh take? Get an instant paraphrase of this document with our AI Paraphraser
On the other hand, Sainsbury’s long-term debt got improved from 2,337m to 2,053m GBP
decreased by 12.15%. It showcase that firm repaid their long-term debt loan in the current year to
reduce their leverage and minimize finance cost. Net loss in 2015 is the main reason behind this
which brings serious cash difficulty for the firm to meet out their fixed financial obligation exactly
on time mentioned as per repayment schedule. Unlike it, investor’s equity gone up from 5,539m to
6,365m GBP by 14.91% which help to satisfied capital requirement of Sainsbury.
However, under the short-term source of finance, both the M&S and Sainsbury utilized
accounting receivables financing, customer advances, short-term bank loans, overdraft and credit
from the suppliers. It fulfilled its working capital requirement through cash credit, trade financing
and bill discounting as well (Jednak, Parežanin and Kragulj, 2016). Further, outstanding customer
bills have been discounted from the financial institution via using factoring so as to get cash
promptly before maturity date. Besides this, outstanding expenses for which firm owed payment
obligation still not yet paid retain cash to the company for repayment of their short-term liabilities
on time.
Limitations of ratio analysis
Useful in only quantitative analysis and do not examine qualitative performance i.e. human
talent, retention, consumer satisfaction, technological growth, competitive strength & others.
It is based on past performance analysis hence not useful in anticipating future year’s results
about which investors are more concerned to make rationalized decision whether to put
investment or not (Bekaert and et.al., 2016).
It is very difficult to say that a particular ratio is good or bad because target ratios are not
available in all the cases. Referring above analysis, there is no standards set regarding assets
utilization efficiency.
Difference in accounting policies, rules and regulations by both the companies figure out
different results and may results in taking misleading decisions (Qin and Linetsky, 2017).
Ratios do not consider change in external market environment i.e. inflation and others which
affect the quality of financial decisions.
(B) Bond valuation, international bond rating agencies and reasons for maintaining a given target
rating
The three international bond rating agencies are Standards & poor, Fitch Group and Moody.
Fitch Group is a New-York based whereas Standard & Poor and Moody’s are US based. It is
essential for the M&S to maintain a given target rating on their outstanding debt, because it, direct
affects the investment decisions of investors, which in turn, have an impact on long-term capital
8
procurement. Investors wish to put their fund in the best credit rating company because of high fund
security and do not invest in poor credit rating company. Moreover, it create negative brand image
in the mind of investors, as a result, they will not be ready to put their capital due to high risk.
PART B
Computation of selling price of bond and yield to maturity
On the basis of cited case situation, credit rating of M&S is A+, whereas rating level of
Sainsbury is A. Hence, by taking into consideration such aspect it can be stated that M&S offers
highly secured debt instruments as compared to Sainsbury Plc. Companies which offer less interest
on debt are usually highly secured as compared to others. Given case situation presents that both
the companies are planning to issue bonds with the motive to fulfil monetary requirements. The
rationale behind the selection of such source is that usually investors are ready to invest money in
fixed income instruments. Hence, by offering bonds to the investors M&S and Sainsbury Plc can
attract large number of investors.
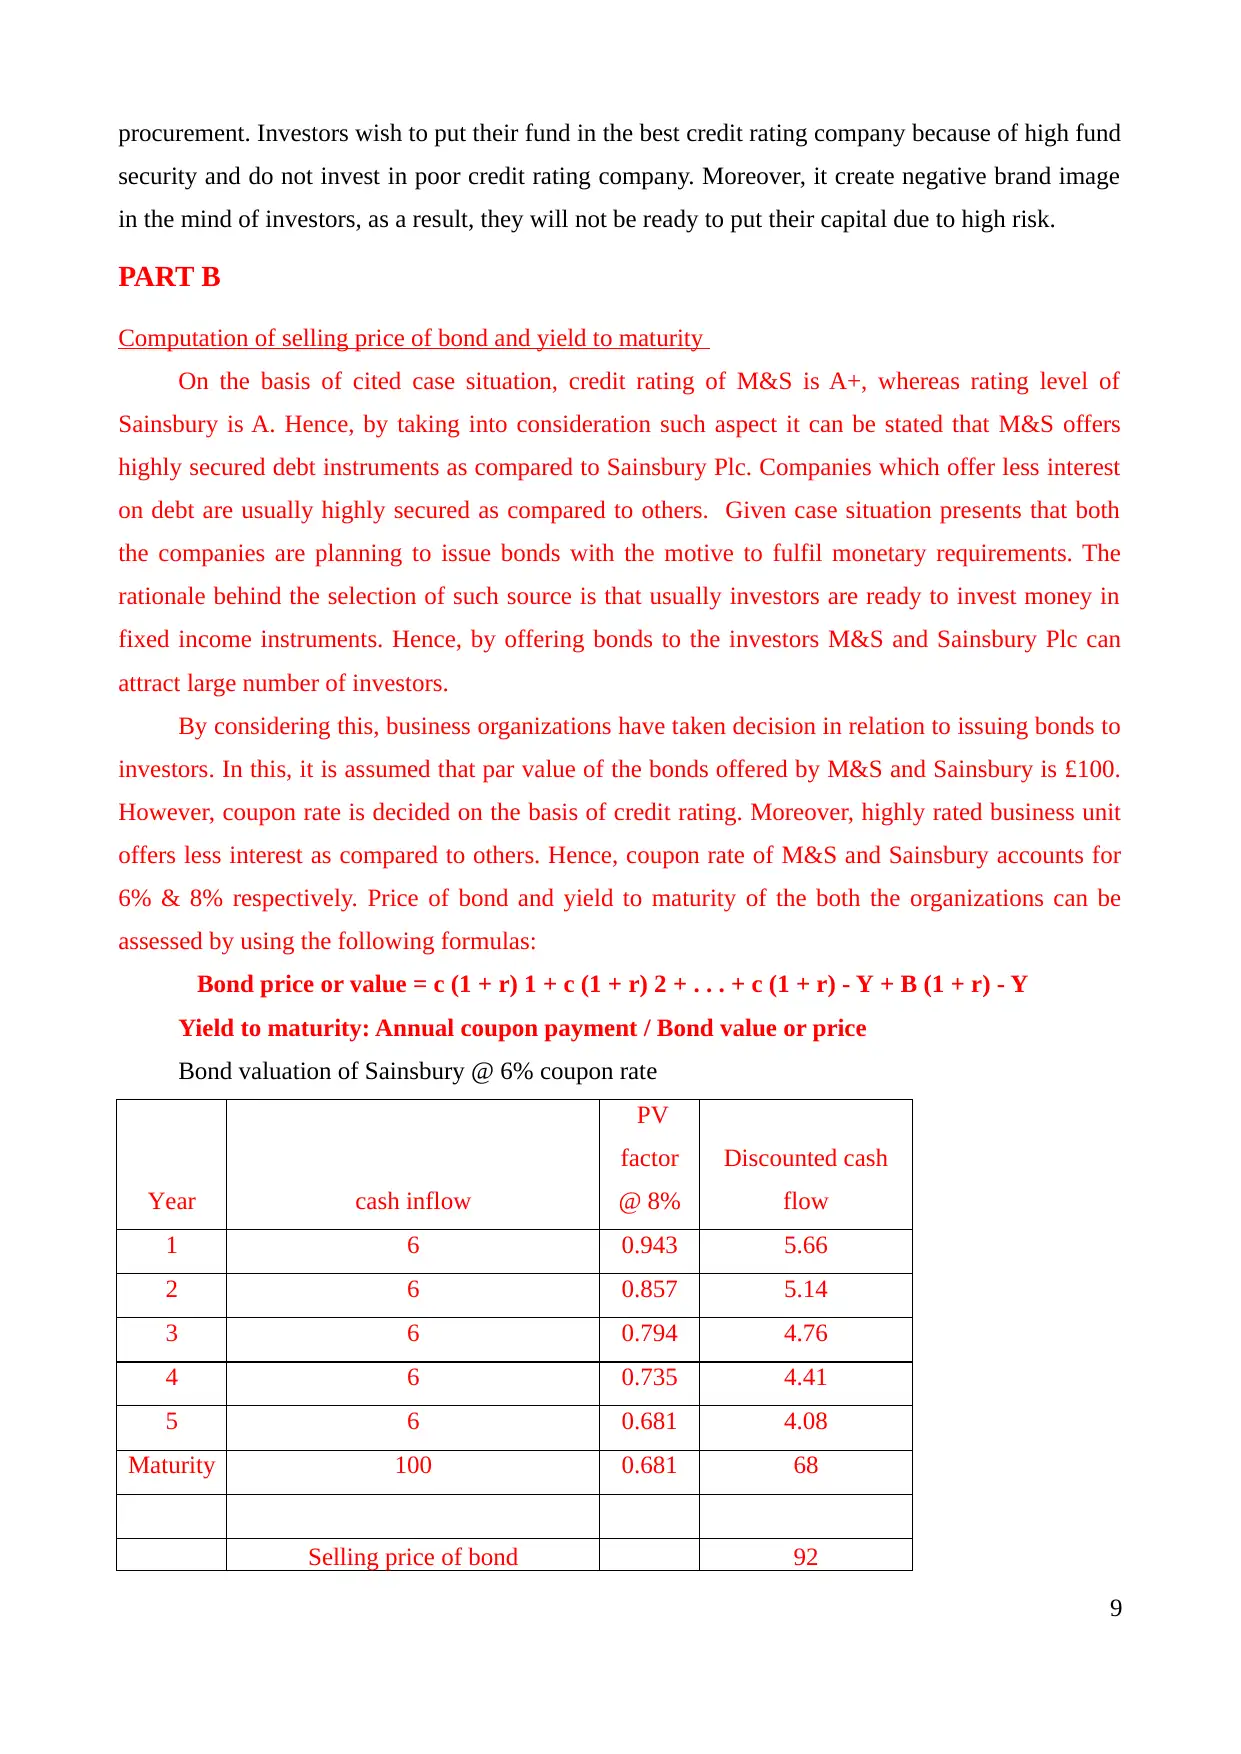
By considering this, business organizations have taken decision in relation to issuing bonds to
investors. In this, it is assumed that par value of the bonds offered by M&S and Sainsbury is £100.
However, coupon rate is decided on the basis of credit rating. Moreover, highly rated business unit
offers less interest as compared to others. Hence, coupon rate of M&S and Sainsbury accounts for
6% & 8% respectively. Price of bond and yield to maturity of the both the organizations can be
assessed by using the following formulas:
Bond price or value = c (1 + r) 1 + c (1 + r) 2 + . . . + c (1 + r) - Y + B (1 + r) - Y
Yield to maturity: Annual coupon payment / Bond value or price
Bond valuation of Sainsbury @ 6% coupon rate
Year cash inflow
PV
factor
@ 8%
Discounted cash
flow
1 6 0.943 5.66
2 6 0.857 5.14
3 6 0.794 4.76
4 6 0.735 4.41
5 6 0.681 4.08
Maturity 100 0.681 68
Selling price of bond 92
9
security and do not invest in poor credit rating company. Moreover, it create negative brand image
in the mind of investors, as a result, they will not be ready to put their capital due to high risk.
PART B
Computation of selling price of bond and yield to maturity
On the basis of cited case situation, credit rating of M&S is A+, whereas rating level of
Sainsbury is A. Hence, by taking into consideration such aspect it can be stated that M&S offers
highly secured debt instruments as compared to Sainsbury Plc. Companies which offer less interest
on debt are usually highly secured as compared to others. Given case situation presents that both
the companies are planning to issue bonds with the motive to fulfil monetary requirements. The
rationale behind the selection of such source is that usually investors are ready to invest money in
fixed income instruments. Hence, by offering bonds to the investors M&S and Sainsbury Plc can
attract large number of investors.
By considering this, business organizations have taken decision in relation to issuing bonds to
investors. In this, it is assumed that par value of the bonds offered by M&S and Sainsbury is £100.
However, coupon rate is decided on the basis of credit rating. Moreover, highly rated business unit
offers less interest as compared to others. Hence, coupon rate of M&S and Sainsbury accounts for
6% & 8% respectively. Price of bond and yield to maturity of the both the organizations can be
assessed by using the following formulas:
Bond price or value = c (1 + r) 1 + c (1 + r) 2 + . . . + c (1 + r) - Y + B (1 + r) - Y
Yield to maturity: Annual coupon payment / Bond value or price
Bond valuation of Sainsbury @ 6% coupon rate
Year cash inflow
PV
factor
@ 8%
Discounted cash
flow
1 6 0.943 5.66
2 6 0.857 5.14
3 6 0.794 4.76
4 6 0.735 4.41
5 6 0.681 4.08
Maturity 100 0.681 68
Selling price of bond 92
9
⊘ This is a preview!⊘
Do you want full access?
Subscribe today to unlock all pages.
Trusted by 1+ million students worldwide
Yield to maturity = 6 / 92 * 100
= 7%
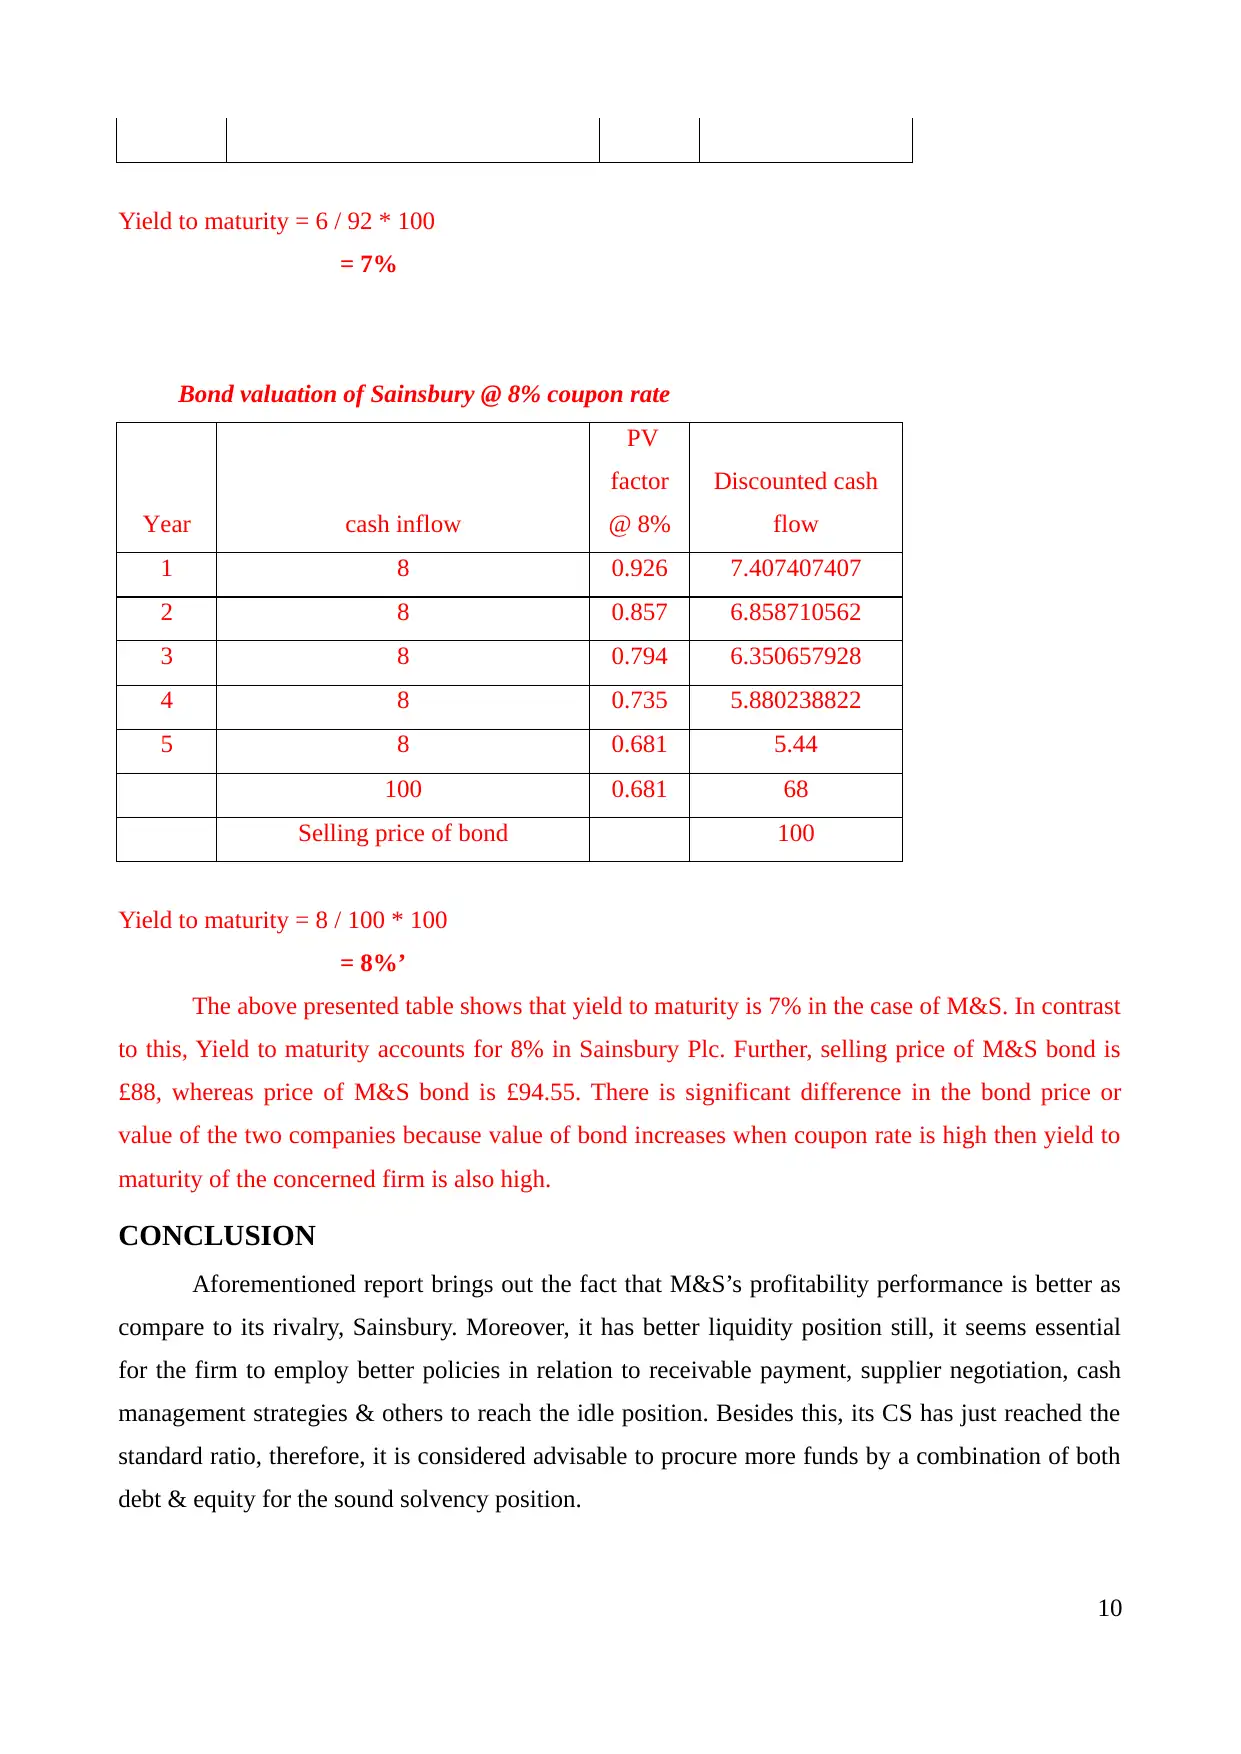
Bond valuation of Sainsbury @ 8% coupon rate
Year cash inflow
PV
factor
@ 8%
Discounted cash
flow
1 8 0.926 7.407407407
2 8 0.857 6.858710562
3 8 0.794 6.350657928
4 8 0.735 5.880238822
5 8 0.681 5.44
100 0.681 68
Selling price of bond 100
Yield to maturity = 8 / 100 * 100
= 8%’
The above presented table shows that yield to maturity is 7% in the case of M&S. In contrast
to this, Yield to maturity accounts for 8% in Sainsbury Plc. Further, selling price of M&S bond is
£88, whereas price of M&S bond is £94.55. There is significant difference in the bond price or
value of the two companies because value of bond increases when coupon rate is high then yield to
maturity of the concerned firm is also high.
CONCLUSION
Aforementioned report brings out the fact that M&S’s profitability performance is better as
compare to its rivalry, Sainsbury. Moreover, it has better liquidity position still, it seems essential
for the firm to employ better policies in relation to receivable payment, supplier negotiation, cash
management strategies & others to reach the idle position. Besides this, its CS has just reached the
standard ratio, therefore, it is considered advisable to procure more funds by a combination of both
debt & equity for the sound solvency position.
10
= 7%
Bond valuation of Sainsbury @ 8% coupon rate
Year cash inflow
PV
factor
@ 8%
Discounted cash
flow
1 8 0.926 7.407407407
2 8 0.857 6.858710562
3 8 0.794 6.350657928
4 8 0.735 5.880238822
5 8 0.681 5.44
100 0.681 68
Selling price of bond 100
Yield to maturity = 8 / 100 * 100
= 8%’
The above presented table shows that yield to maturity is 7% in the case of M&S. In contrast
to this, Yield to maturity accounts for 8% in Sainsbury Plc. Further, selling price of M&S bond is
£88, whereas price of M&S bond is £94.55. There is significant difference in the bond price or
value of the two companies because value of bond increases when coupon rate is high then yield to
maturity of the concerned firm is also high.
CONCLUSION
Aforementioned report brings out the fact that M&S’s profitability performance is better as
compare to its rivalry, Sainsbury. Moreover, it has better liquidity position still, it seems essential
for the firm to employ better policies in relation to receivable payment, supplier negotiation, cash
management strategies & others to reach the idle position. Besides this, its CS has just reached the
standard ratio, therefore, it is considered advisable to procure more funds by a combination of both
debt & equity for the sound solvency position.
10
Paraphrase This Document
Need a fresh take? Get an instant paraphrase of this document with our AI Paraphraser

11
REFERENCES
Books and Journals
Adekola, A., Samy, M. and Knight, D., 2017. Efficient working capital management as the tool for
driving profitability and liquidity: a correlation analysis of Nigerian companies.
International Journal of Business and Globalisation. 18(2). pp.251-275.
Bekaert, G. and et.al., 2016. Political risk and international valuation. Journal of Corporate Finance,
37(12). pp.1-23.
Bibi, N. and Amjad, S., 2017. The Relationship between Liquidity and Firms’ Profitability: A Case
Study of Karachi Stock Exchange. Asian Journal of Finance & Accounting. 9(1). pp.54-67.
Boyas, E. and Teeter, R., 2017. Teaching Financial Ratio Analysis using XBRL. Developments in
Business Simulation and Experiential Learning. 44(1). pp.15-38.
Goldmann, K., 2017. Financial Liquidity and Profitability Management in Practice of Polish
Business. In Financial Environment and Business Development. Springer International
Publishing. 9(2). pp.103-112.
Jednak, S., Parežanin, M. and Kragulj, D., 2016. Domestic and international sources of funding
economic development of Serbia. Info M. 15(59). pp.4-11.
Lakshmi, T.M., Martin, A. and Venkatesan, V.P., 2016. A Genetic Bankrupt Ratio Analysis Tool
Using a Genetic Algorithm to Identify Influencing Financial Ratios. IEEE Transactions on
Evolutionary Computation. 20(1). pp.38-51.
Nelson, A.W. and Gnanapragasam, V.J., 2016. Applying for research funding. Part 1–sources of
funding. Journal of Clinical Urology. 9(3). pp.201-204.
Qin, L. and Linetsky, V., 2017. Long‐Term Risk: A Martingale Approach. Econometrica. 85(1).
pp.299-312.
Rakićević, A. and et.al., 2016. DuPont Financial Ratio Analysis Using Logical Aggregation. In Soft
Computing Application. Springer International Publishing. 12(4). pp.727-739.
Room, R., 2016. Sources of funding as an influence on alcohol studies. The International Journal of
Alcohol and Drug Research. 5(1). pp.15-16.
Shukla, S. and Roopa, T.N., 2017. Financial behaviour of selected telecom companies in India: a
comparative analysis. International Journal of Indian Culture and Business Management.
14(2). pp.141-161.
Online
Marks and Spencer’s annual report. 2016. [PDF]. Available through:
https://finance.yahoo.com/quote/MKS.L/financials?p=MKS.L. [Accessed on 6th April
12
⊘ This is a preview!⊘
Do you want full access?
Subscribe today to unlock all pages.
Trusted by 1+ million students worldwide
1 out of 15
Related Documents


Your All-in-One AI-Powered Toolkit for Academic Success.
+13062052269
info@desklib.com
Available 24*7 on WhatsApp / Email
![[object Object]](/_next/static/media/star-bottom.7253800d.svg)
Unlock your academic potential
Copyright © 2020–2026 A2Z Services. All Rights Reserved. Developed and managed by ZUCOL.