MSc Financial Management: NPV vs IRR Analysis of Project Appraisal

Verified

Added on Ā 2023/04/22

|13
|1756
|427
Report
AI Summary
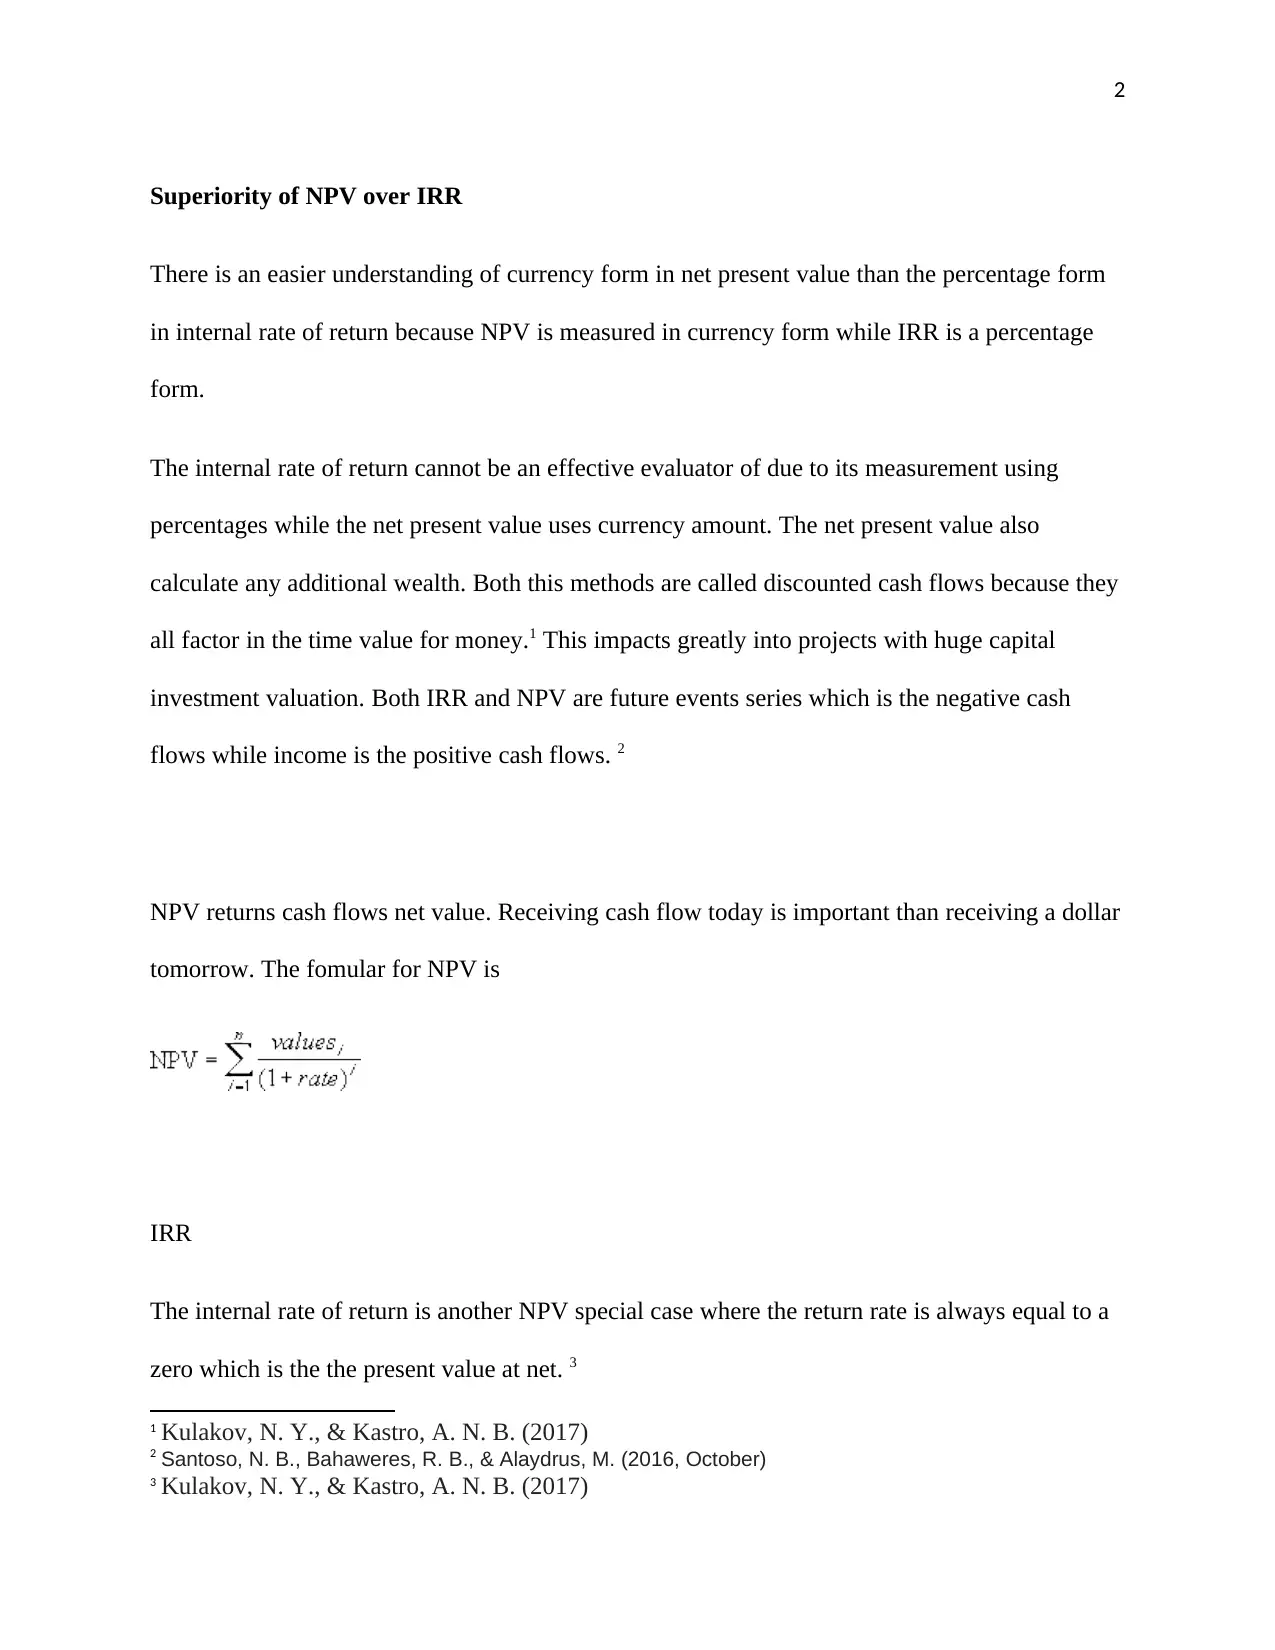
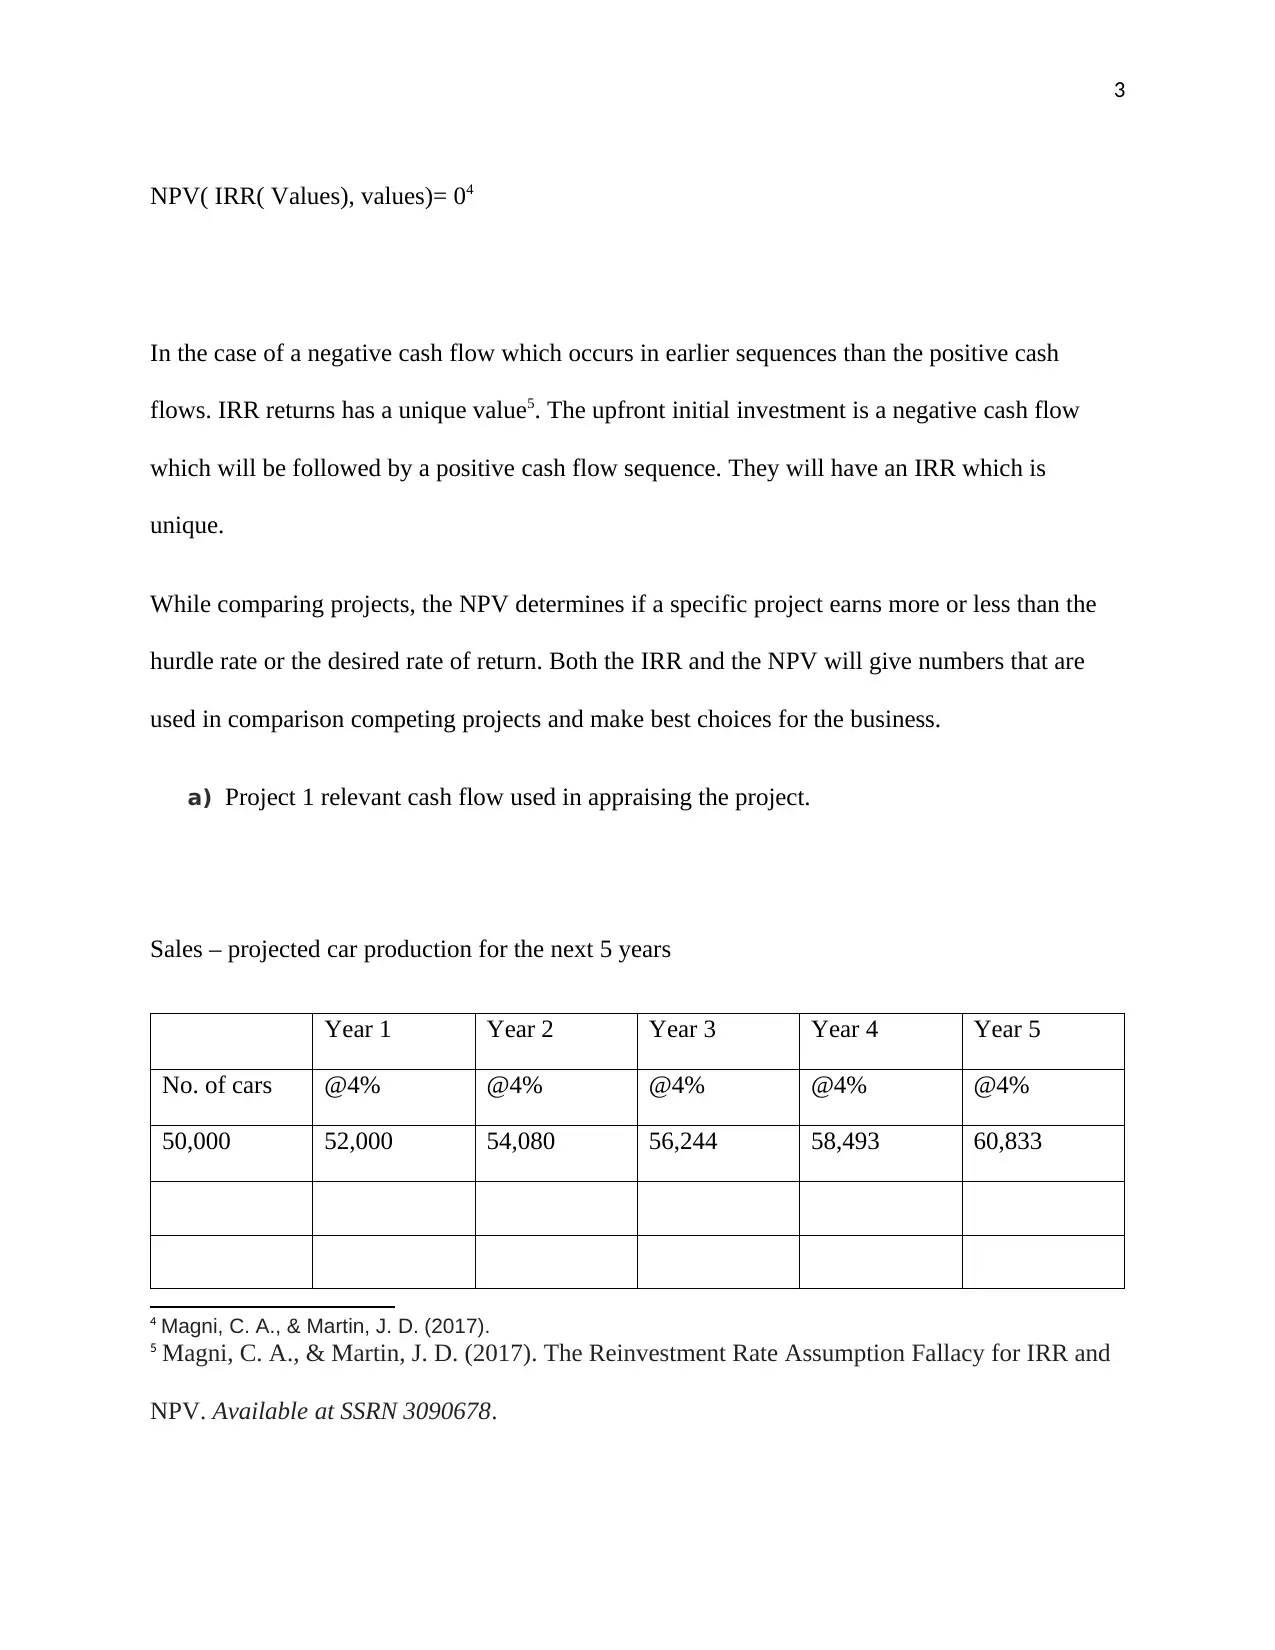
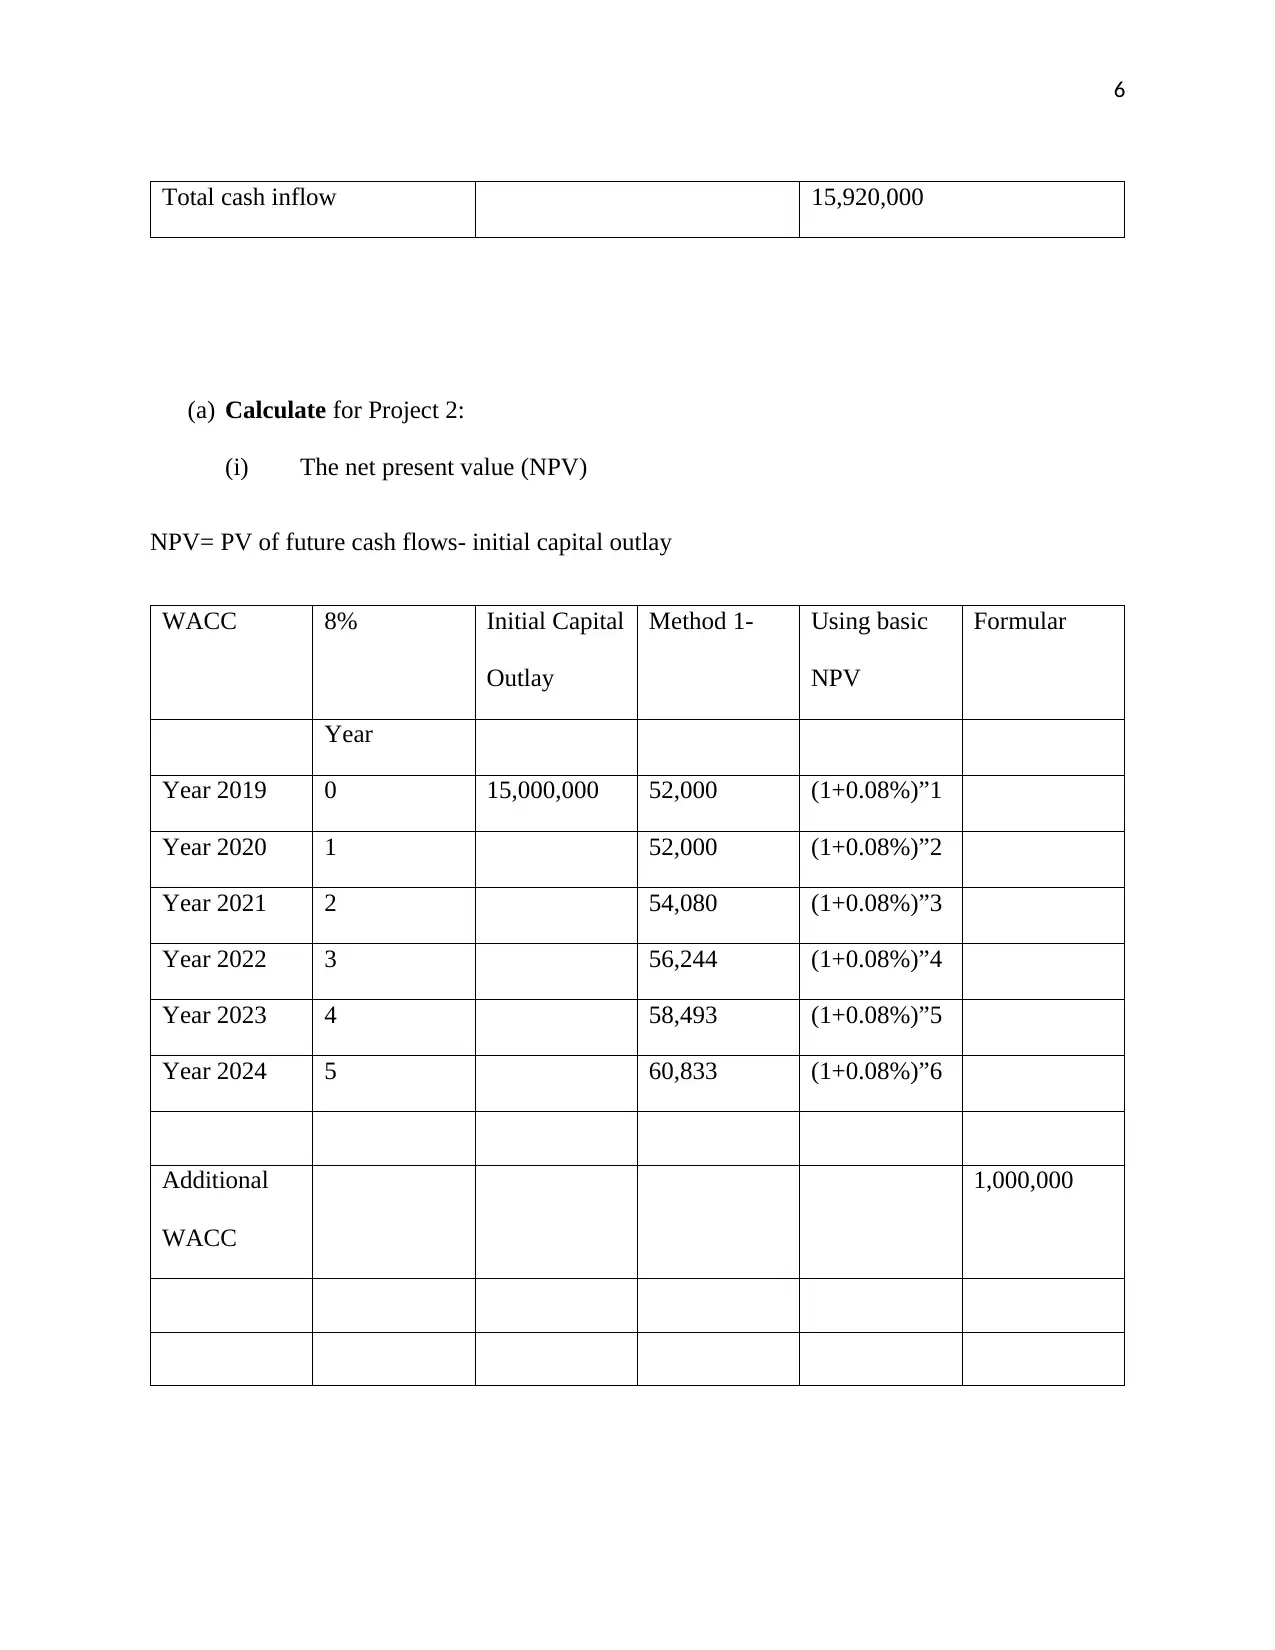
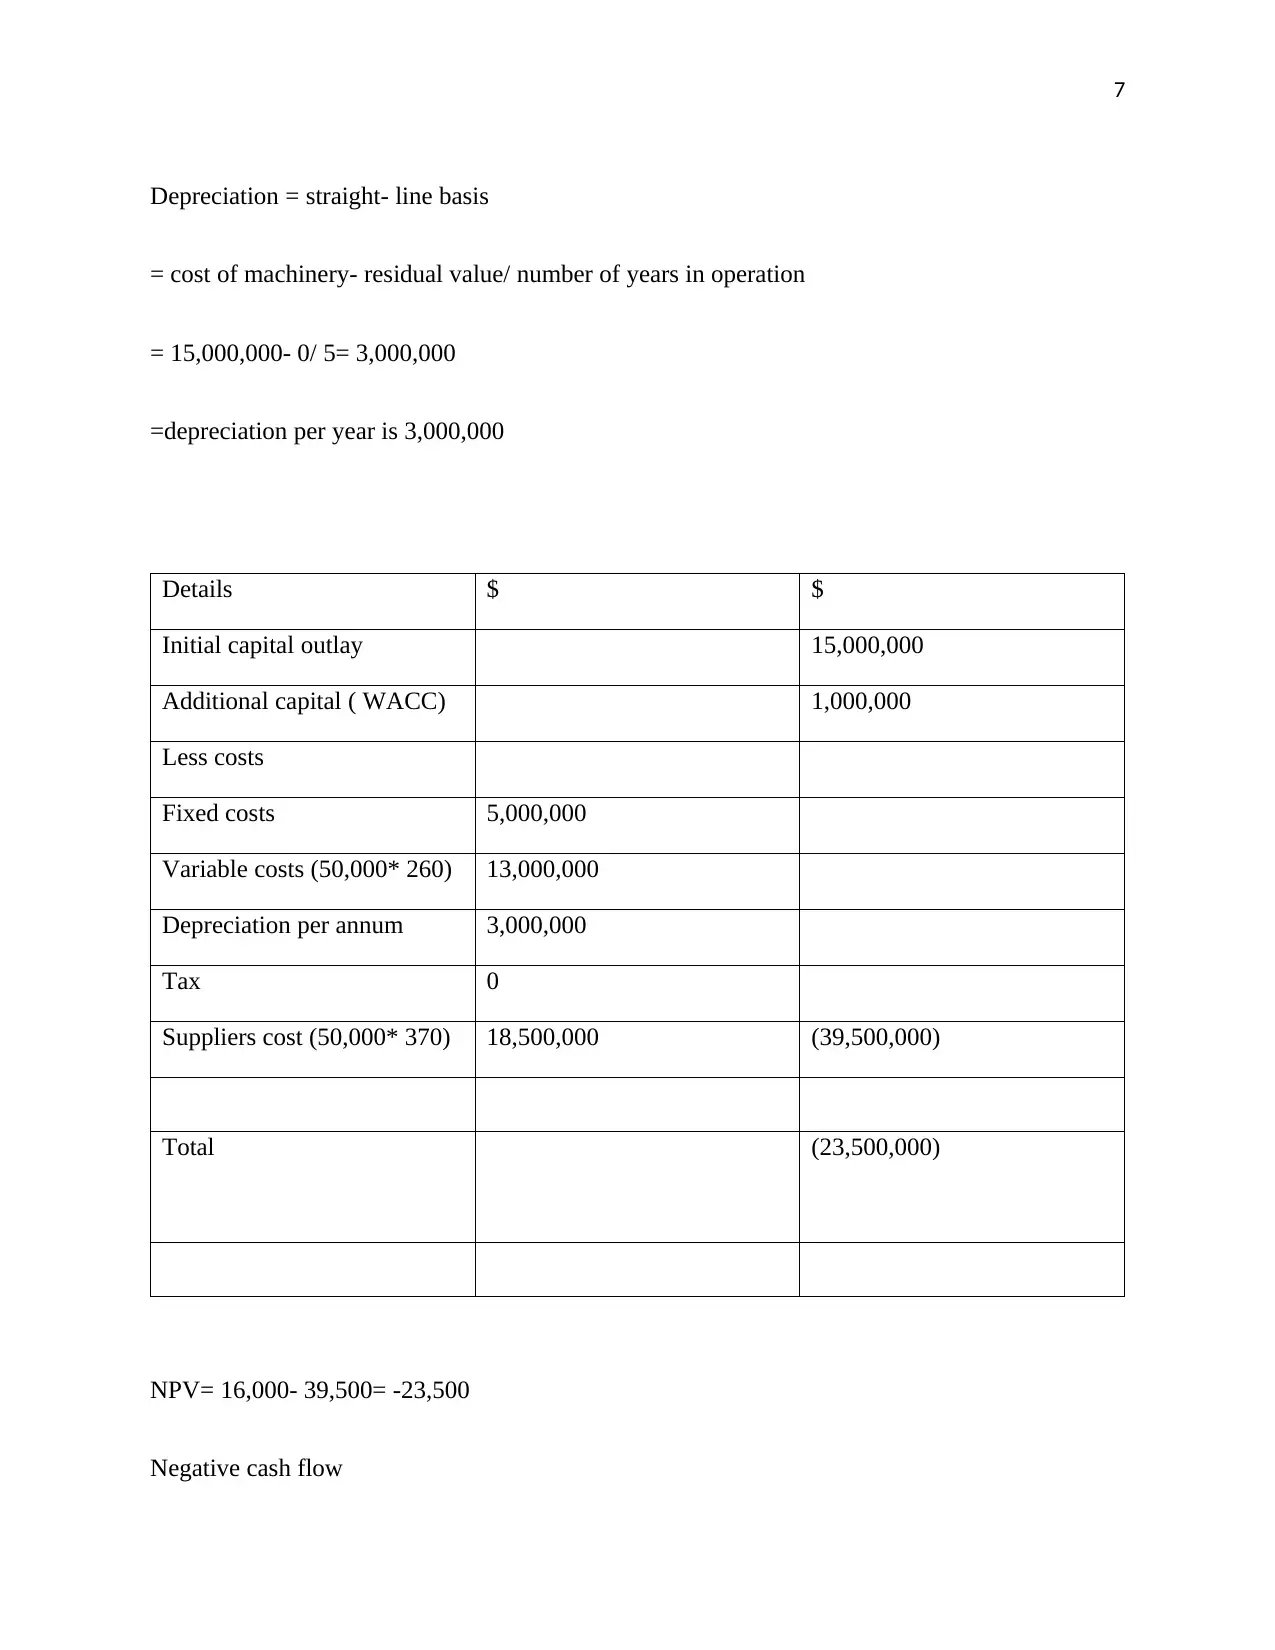
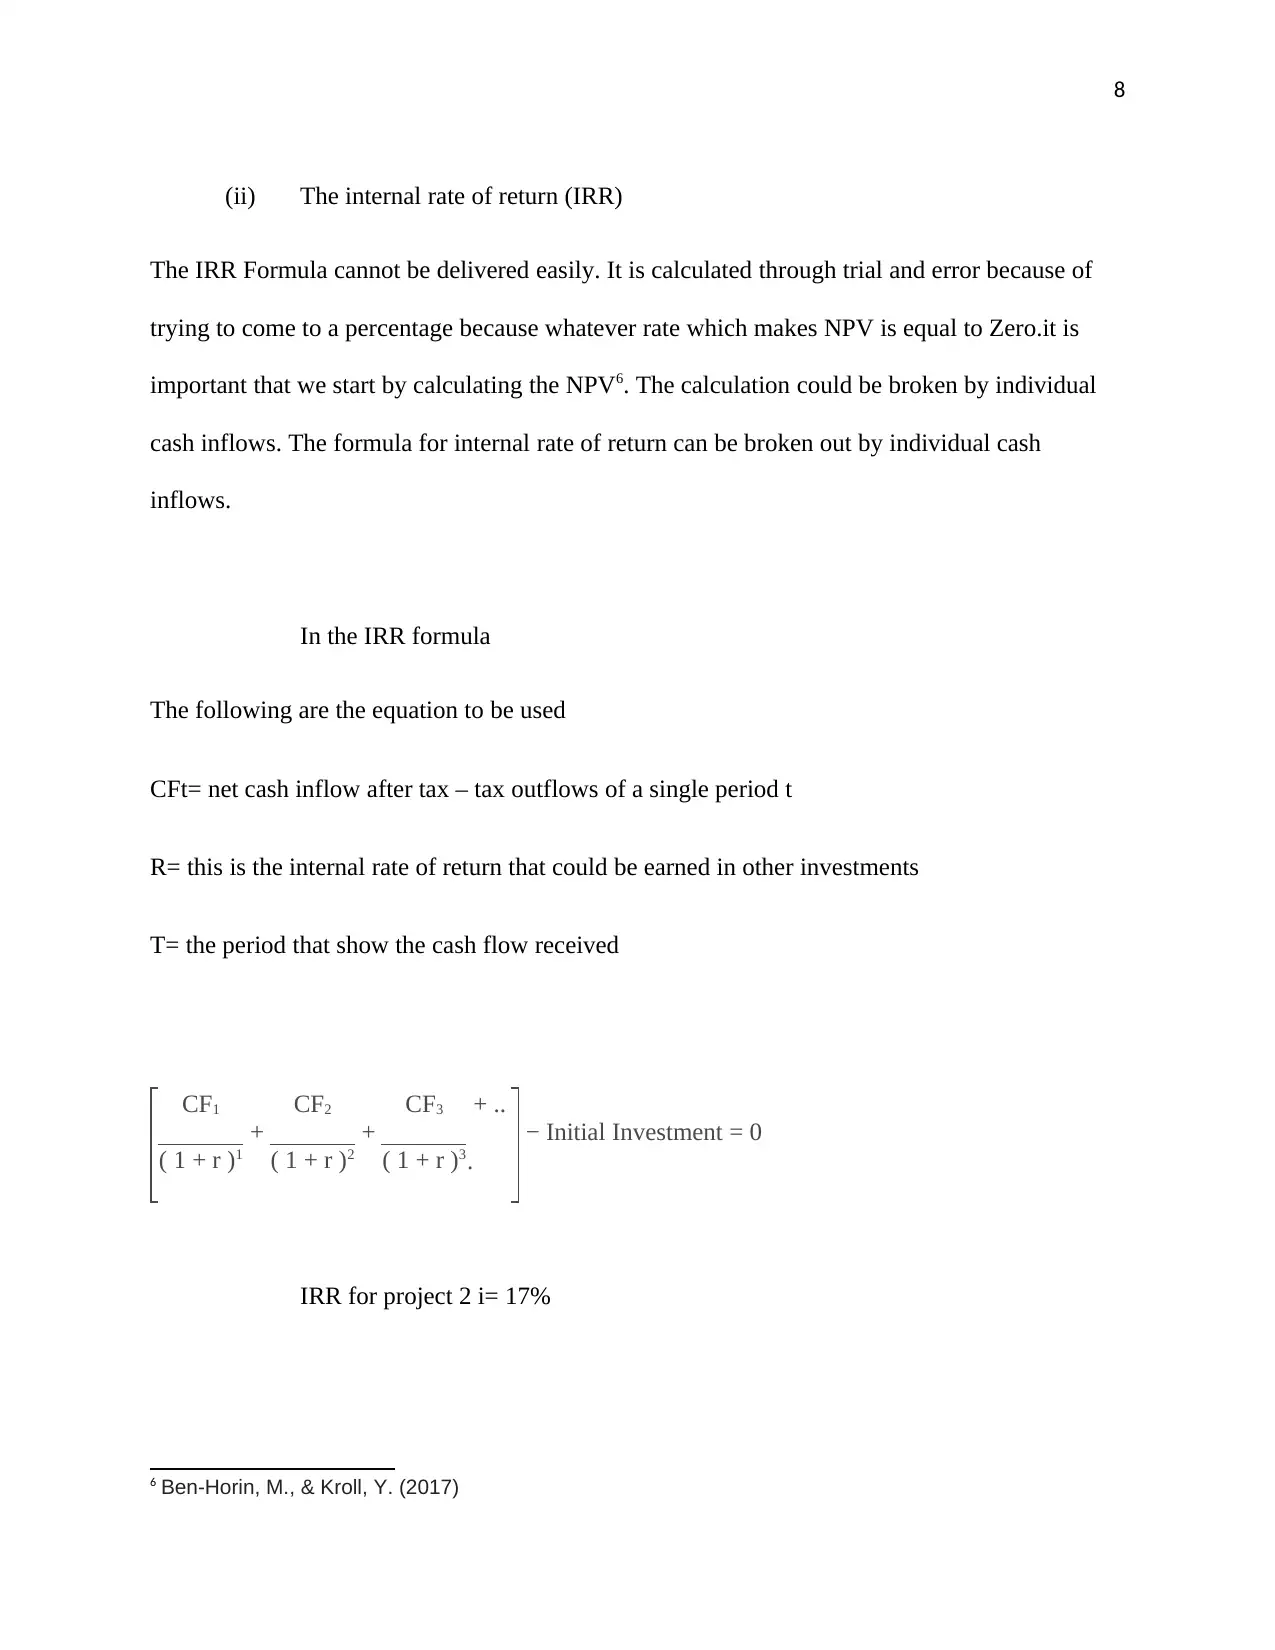
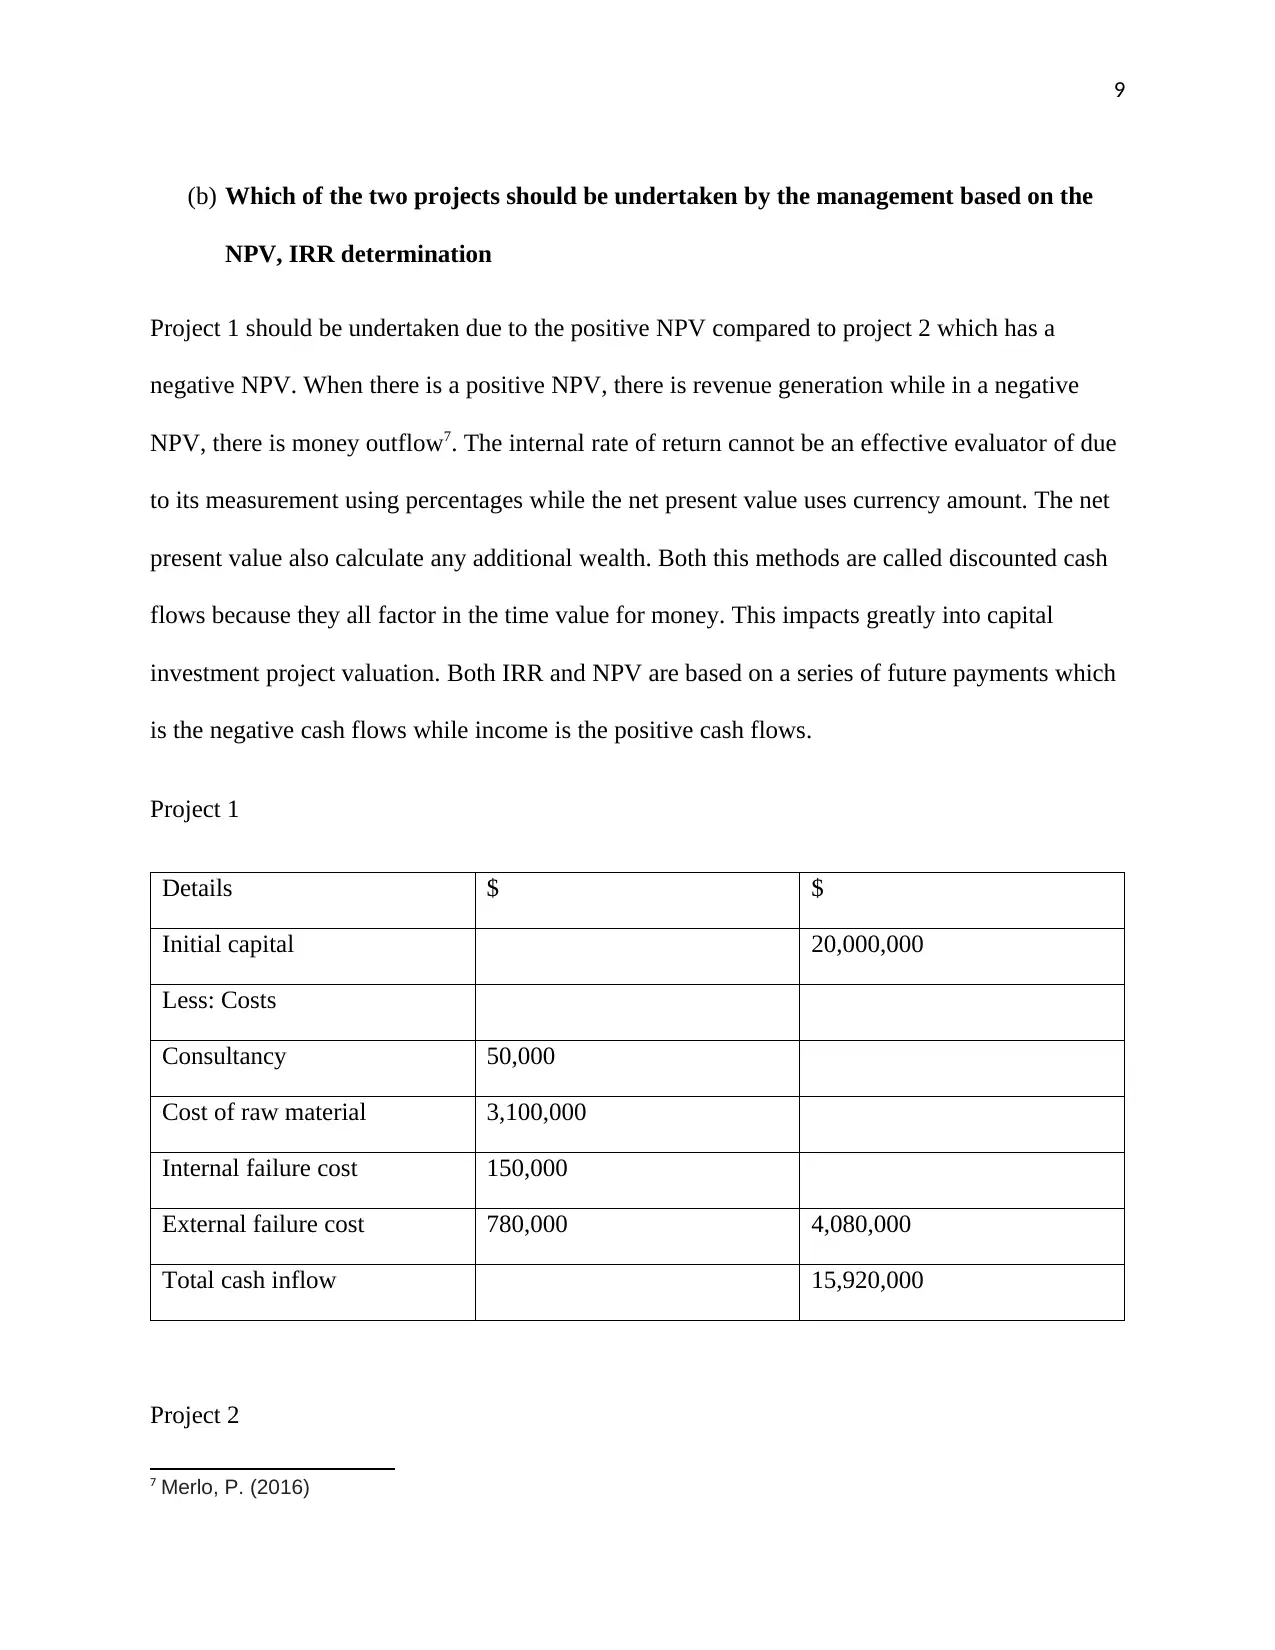
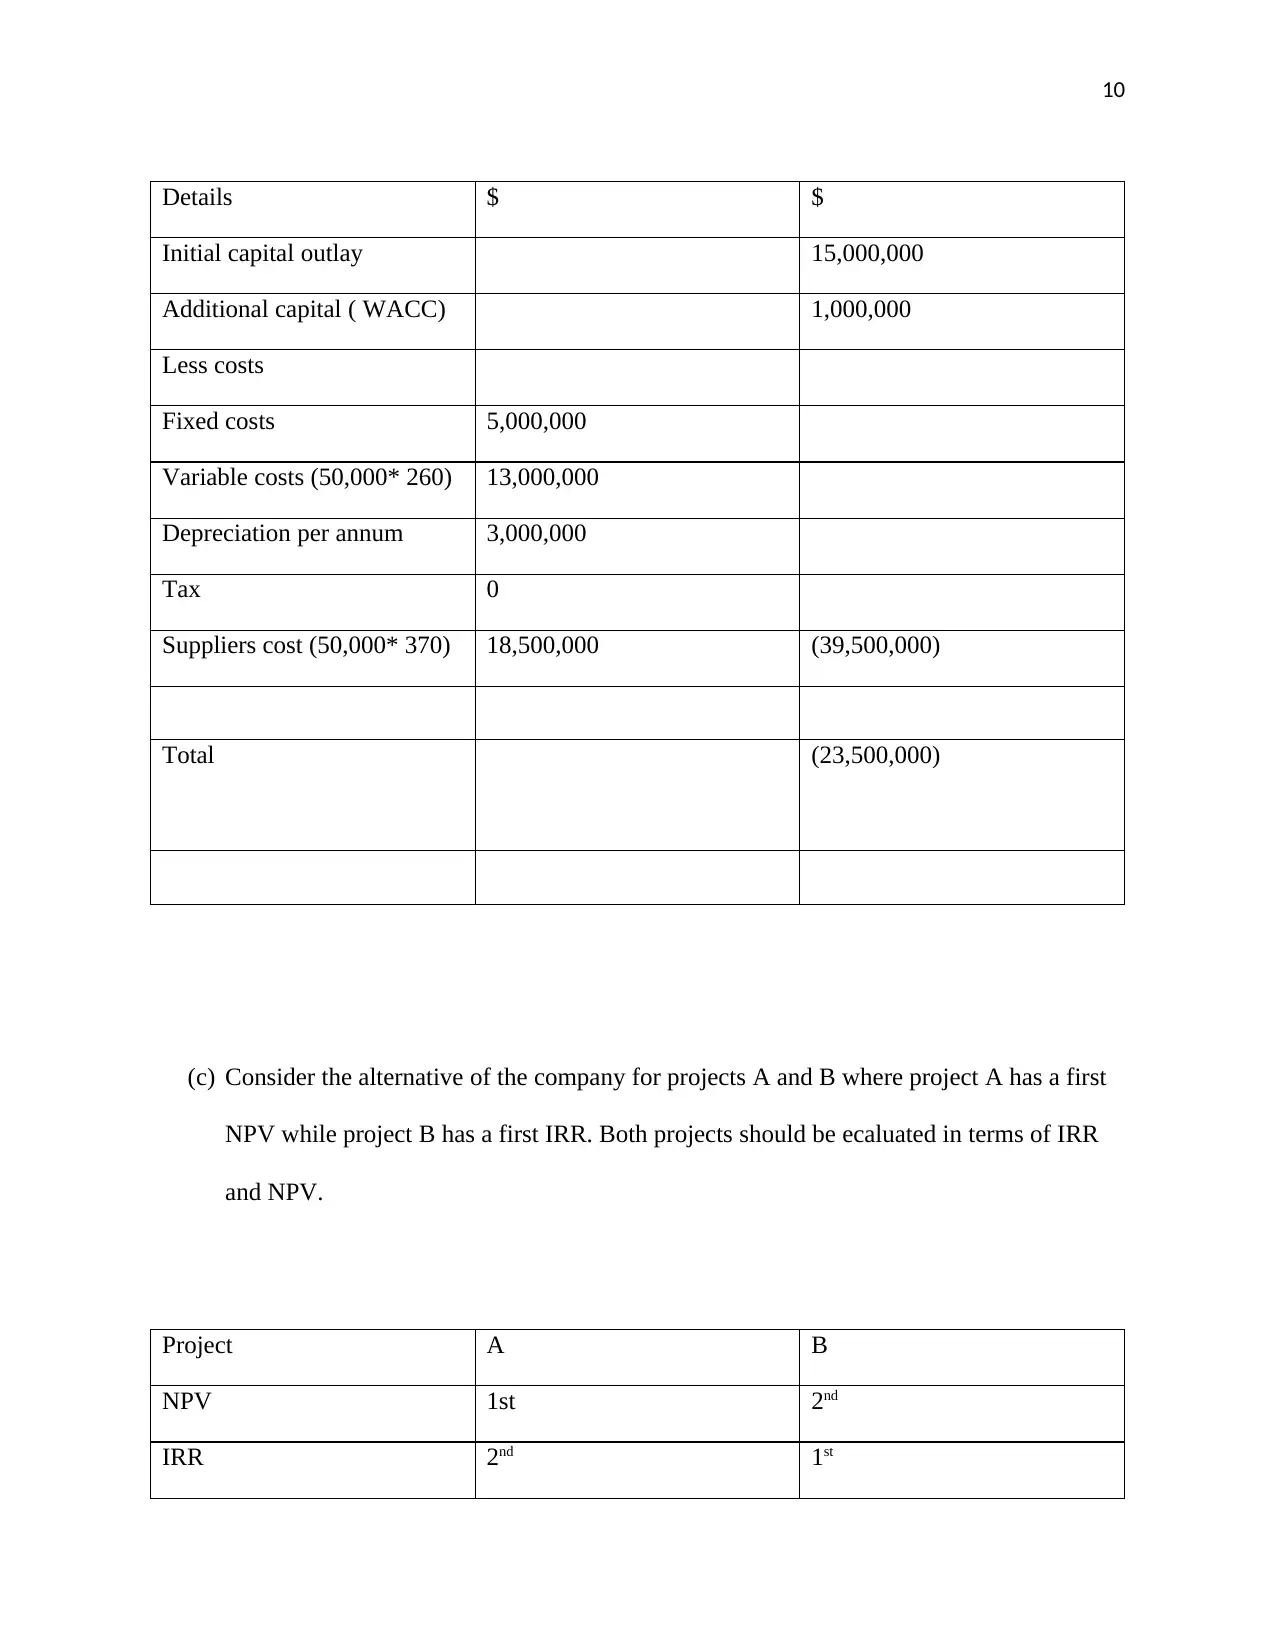
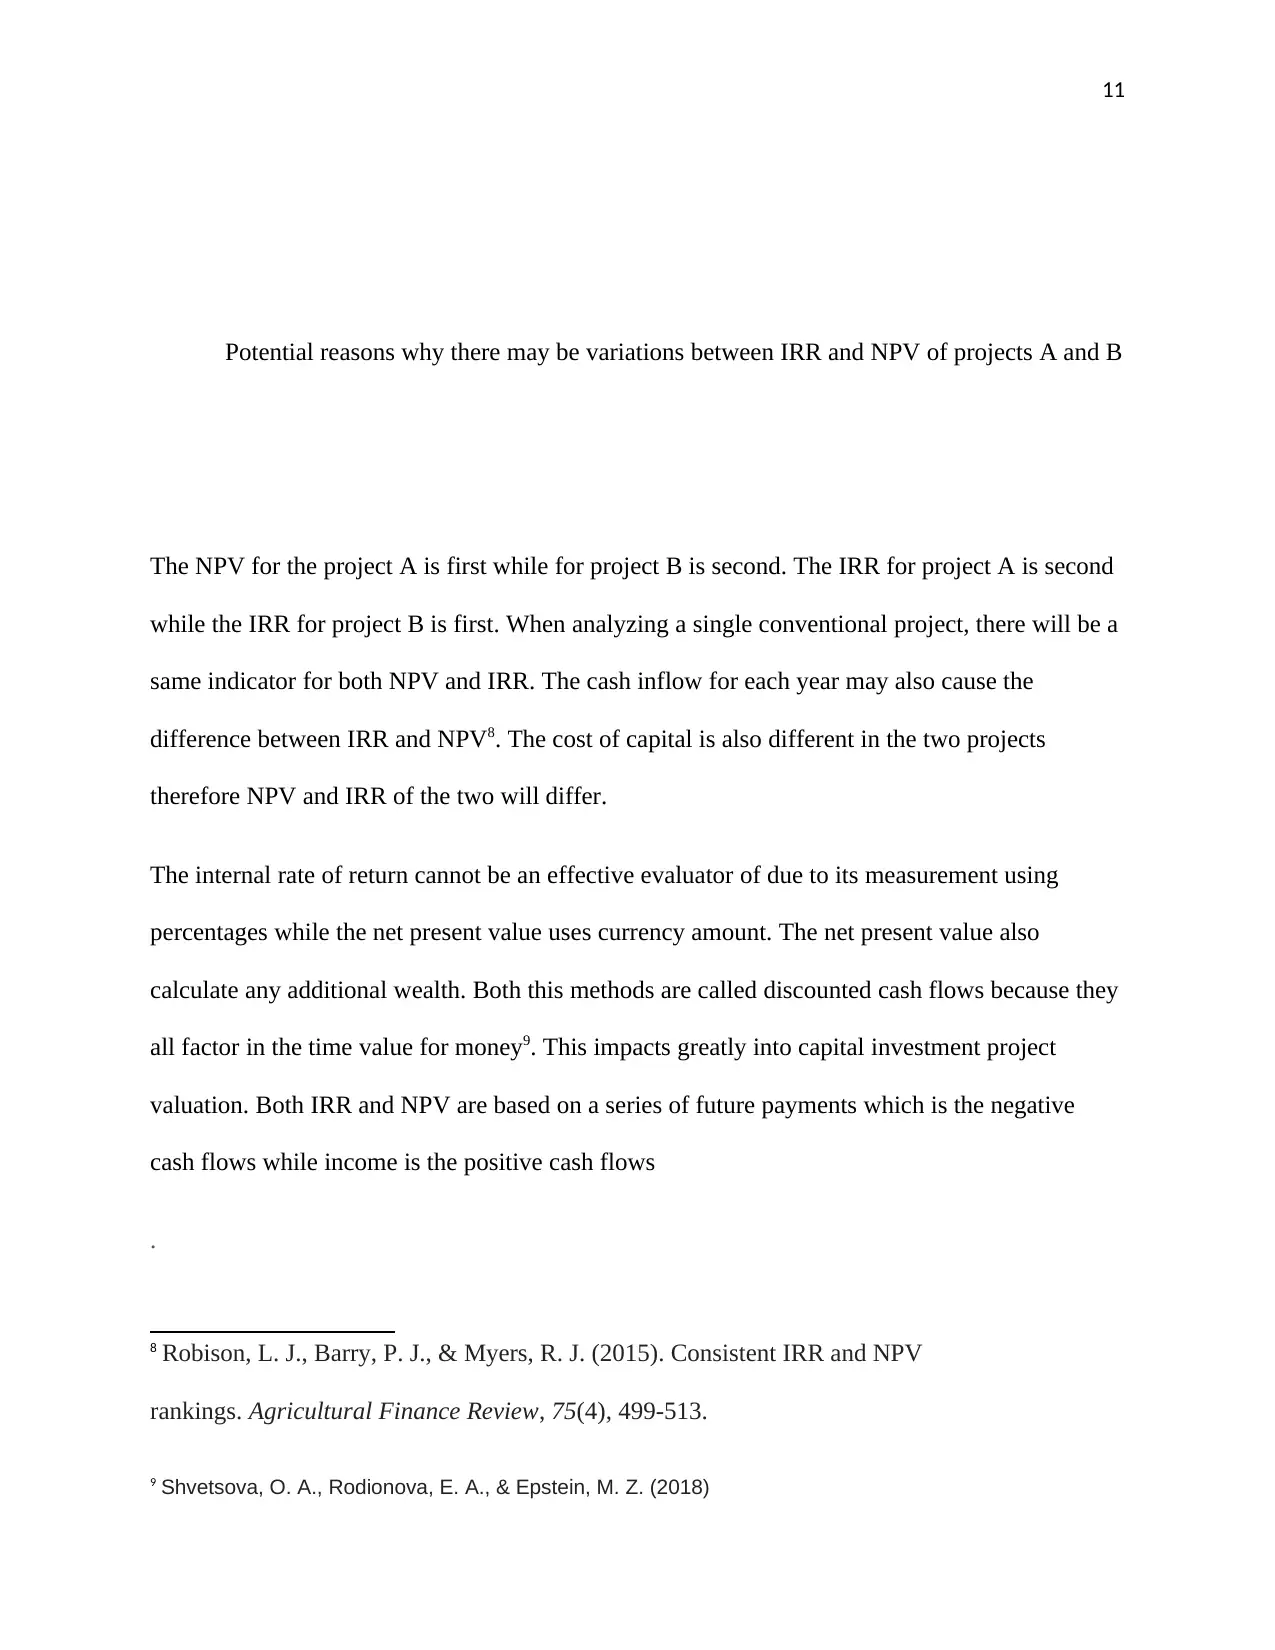
This report evaluates the superiority of Net Present Value (NPV) over Internal Rate of Return (IRR) in investment appraisal, particularly within the context of financial management. It highlights that NPV, measured in currency, offers a more straightforward understanding compared to IRR, which is expressed as a percentage. The report analyzes two potential investment projects for a car manufacturer facing financial challenges, calculating the NPV and IRR for each project. Project 1, involving a new quality control process, is recommended due to its positive NPV, unlike Project 2, which exhibits a negative NPV. Furthermore, the report explores potential variations between IRR and NPV rankings for projects A and B, attributing these differences to factors like cash inflow patterns and differing costs of capital. The analysis emphasizes the importance of considering both NPV and IRR when making investment decisions, while also acknowledging the limitations of IRR in certain scenarios. Desklib provides solved assignments and past papers for students.
Document Page
1
Name:
Course
Professor’s name
University name
City, State
Date of submission
tabler-icon-diamond-filled.svg

Paraphrase This Document

Need a fresh take? Get an instant paraphrase of this document with our AI Paraphraser
Document Page
2
Superiority of NPV over IRR
There is an easier understanding of currency form in net present value than the percentage form
in internal rate of return because NPV is measured in currency form while IRR is a percentage
form.
The internal rate of return cannot be an effective evaluator of due to its measurement using
percentages while the net present value uses currency amount. The net present value also
calculate any additional wealth. Both this methods are called discounted cash flows because they
all factor in the time value for money.1 This impacts greatly into projects with huge capital
investment valuation. Both IRR and NPV are future events series which is the negative cash
flows while income is the positive cash flows. 2
NPV returns cash flows net value. Receiving cash flow today is important than receiving a dollar
tomorrow. The fomular for NPV is
IRR
The internal rate of return is another NPV special case where the return rate is always equal to a
zero which is the the present value at net. 3
1 Kulakov, N. Y., & Kastro, A. N. B. (2017)
2 Santoso, N. B., Bahaweres, R. B., & Alaydrus, M. (2016, October)
3 Kulakov, N. Y., & Kastro, A. N. B. (2017)
Document Page
3
NPV( IRR( Values), values)= 04
In the case of a negative cash flow which occurs in earlier sequences than the positive cash
flows. IRR returns has a unique value5. The upfront initial investment is a negative cash flow
which will be followed by a positive cash flow sequence. They will have an IRR which is
unique.
While comparing projects, the NPV determines if a specific project earns more or less than the
hurdle rate or the desired rate of return. Both the IRR and the NPV will give numbers that are
used in comparison competing projects and make best choices for the business.
a) Project 1 relevant cash flow used in appraising the project.
Sales – projected car production for the next 5 years
Year 1 Year 2 Year 3 Year 4 Year 5
No. of cars @4% @4% @4% @4% @4%
50,000 52,000 54,080 56,244 58,493 60,833
4 Magni, C. A., & Martin, J. D. (2017).
5 Magni, C. A., & Martin, J. D. (2017). The Reinvestment Rate Assumption Fallacy for IRR and
NPV. Available at SSRN 3090678.
Document Page
4
Project 1
Initial capital( Io) =$ 20,000,000
Useful life = 5 years
Residual value= 0.
Internal failure costs
Internal failure cost($) Percentage (%) probability total
300,000 50% 150,000
500,000 50% 250,000
700,000 50% 350,000
External failure costs
External failure cost($) Percentage (%) probability total
1,300,000 60% 780,000
1,900,000 30% 570,000
3,000,000 10% 300,000
tabler-icon-diamond-filled.svg

Paraphrase This Document

Need a fresh take? Get an instant paraphrase of this document with our AI Paraphraser
Document Page
5
WACC 10% Initial Capital
Outlay
Method 1- Using basic
NPV
Formular
Year
Year 2019 0 20,000,000 52,000 (1+10.5%)ā€1
Year 2020 1 52,000 (1+10.5%)ā€2
Year 2021 2 54,080 (1+10.5%)ā€3
Year 2022 3 56,244 (1+10.5%)ā€4
Year 2023 4 58,493 (1+10.5%)ā€5
Year 2024 5 60,833 (1+10.5%)ā€6
Relevant cash flow for year 1
Details $ $
Initial capital 20,000,000
Less: Costs
Consultancy 50,000
Cost of raw material 3,100,000
Internal failure cost 150,000
External failure cost 780,000 4,080,000
Document Page
6
Total cash inflow 15,920,000
(a) Calculate for Project 2:
(i) The net present value (NPV)
NPV= PV of future cash flows- initial capital outlay
WACC 8% Initial Capital
Outlay
Method 1- Using basic
NPV
Formular
Year
Year 2019 0 15,000,000 52,000 (1+0.08%)ā€1
Year 2020 1 52,000 (1+0.08%)ā€2
Year 2021 2 54,080 (1+0.08%)ā€3
Year 2022 3 56,244 (1+0.08%)ā€4
Year 2023 4 58,493 (1+0.08%)ā€5
Year 2024 5 60,833 (1+0.08%)ā€6
Additional
WACC
1,000,000
Document Page
7
Depreciation = straight- line basis
= cost of machinery- residual value/ number of years in operation
= 15,000,000- 0/ 5= 3,000,000
=depreciation per year is 3,000,000
Details $ $
Initial capital outlay 15,000,000
Additional capital ( WACC) 1,000,000
Less costs
Fixed costs 5,000,000
Variable costs (50,000* 260) 13,000,000
Depreciation per annum 3,000,000
Tax 0
Suppliers cost (50,000* 370) 18,500,000 (39,500,000)
Total (23,500,000)
NPV= 16,000- 39,500= -23,500
Negative cash flow
tabler-icon-diamond-filled.svg

Paraphrase This Document

Need a fresh take? Get an instant paraphrase of this document with our AI Paraphraser
Document Page
8
(ii) The internal rate of return (IRR)
The IRR Formula cannot be delivered easily. It is calculated through trial and error because of
trying to come to a percentage because whatever rate which makes NPV is equal to Zero.it is
important that we start by calculating the NPV6. The calculation could be broken by individual
cash inflows. The formula for internal rate of return can be broken out by individual cash
inflows.
In the IRR formula
The following are the equation to be used
CFt= net cash inflow after tax – tax outflows of a single period t
R= this is the internal rate of return that could be earned in other investments
T= the period that show the cash flow received
CF1
+
CF2
+
CF3 + ..
.
āˆ’ Initial Investment = 0
( 1 + r )1 ( 1 + r )2 ( 1 + r )3
IRR for project 2 i= 17%
6 Ben-Horin, M., & Kroll, Y. (2017)
Document Page
9
(b) Which of the two projects should be undertaken by the management based on the
NPV, IRR determination
Project 1 should be undertaken due to the positive NPV compared to project 2 which has a
negative NPV. When there is a positive NPV, there is revenue generation while in a negative
NPV, there is money outflow7. The internal rate of return cannot be an effective evaluator of due
to its measurement using percentages while the net present value uses currency amount. The net
present value also calculate any additional wealth. Both this methods are called discounted cash
flows because they all factor in the time value for money. This impacts greatly into capital
investment project valuation. Both IRR and NPV are based on a series of future payments which
is the negative cash flows while income is the positive cash flows.
Project 1
Details $ $
Initial capital 20,000,000
Less: Costs
Consultancy 50,000
Cost of raw material 3,100,000
Internal failure cost 150,000
External failure cost 780,000 4,080,000
Total cash inflow 15,920,000
Project 2
7 Merlo, P. (2016)
Document Page
10
Details $ $
Initial capital outlay 15,000,000
Additional capital ( WACC) 1,000,000
Less costs
Fixed costs 5,000,000
Variable costs (50,000* 260) 13,000,000
Depreciation per annum 3,000,000
Tax 0
Suppliers cost (50,000* 370) 18,500,000 (39,500,000)
Total (23,500,000)
(c) Consider the alternative of the company for projects A and B where project A has a first
NPV while project B has a first IRR. Both projects should be ecaluated in terms of IRR
and NPV.
Project A B
NPV 1st 2nd
IRR 2nd 1st
tabler-icon-diamond-filled.svg

Paraphrase This Document

Need a fresh take? Get an instant paraphrase of this document with our AI Paraphraser
Document Page
11
Potential reasons why there may be variations between IRR and NPV of projects A and B
The NPV for the project A is first while for project B is second. The IRR for project A is second
while the IRR for project B is first. When analyzing a single conventional project, there will be a
same indicator for both NPV and IRR. The cash inflow for each year may also cause the
difference between IRR and NPV8. The cost of capital is also different in the two projects
therefore NPV and IRR of the two will differ.
The internal rate of return cannot be an effective evaluator of due to its measurement using
percentages while the net present value uses currency amount. The net present value also
calculate any additional wealth. Both this methods are called discounted cash flows because they
all factor in the time value for money9. This impacts greatly into capital investment project
valuation. Both IRR and NPV are based on a series of future payments which is the negative
cash flows while income is the positive cash flows
.
8 Robison, L. J., Barry, P. J., & Myers, R. J. (2015). Consistent IRR and NPV
rankings. Agricultural Finance Review, 75(4), 499-513.
9 Shvetsova, O. A., Rodionova, E. A., & Epstein, M. Z. (2018)
Document Page
12
References
Ben-Horin, M., & Kroll, Y. (2017). A simple intuitive NPV-IRR consistent ranking. The
Quarterly Review of Economics and Finance, 66, 108-114.
Magni, C. A., & Martin, J. D. (2017). The Reinvestment Rate Assumption Fallacy for IRR and
NPV. Available at SSRN 3090678.
Merlo, P. (2016). Consequences of the absence of monotonicity of the NPV function to the
assessment of effectiveness of investment projects. Engineering Economics, 27(1), 39-46.
chevron_up_icon
1 out of 13
circle_padding
hide_on_mobile
zoom_out_icon
[object Object]