Research Methods & Analysis A ON: SPSS Data Analysis, MSc Psychology

Verified

Added on  2023/06/18

|39
|6007
|402
Homework Assignment
AI Summary
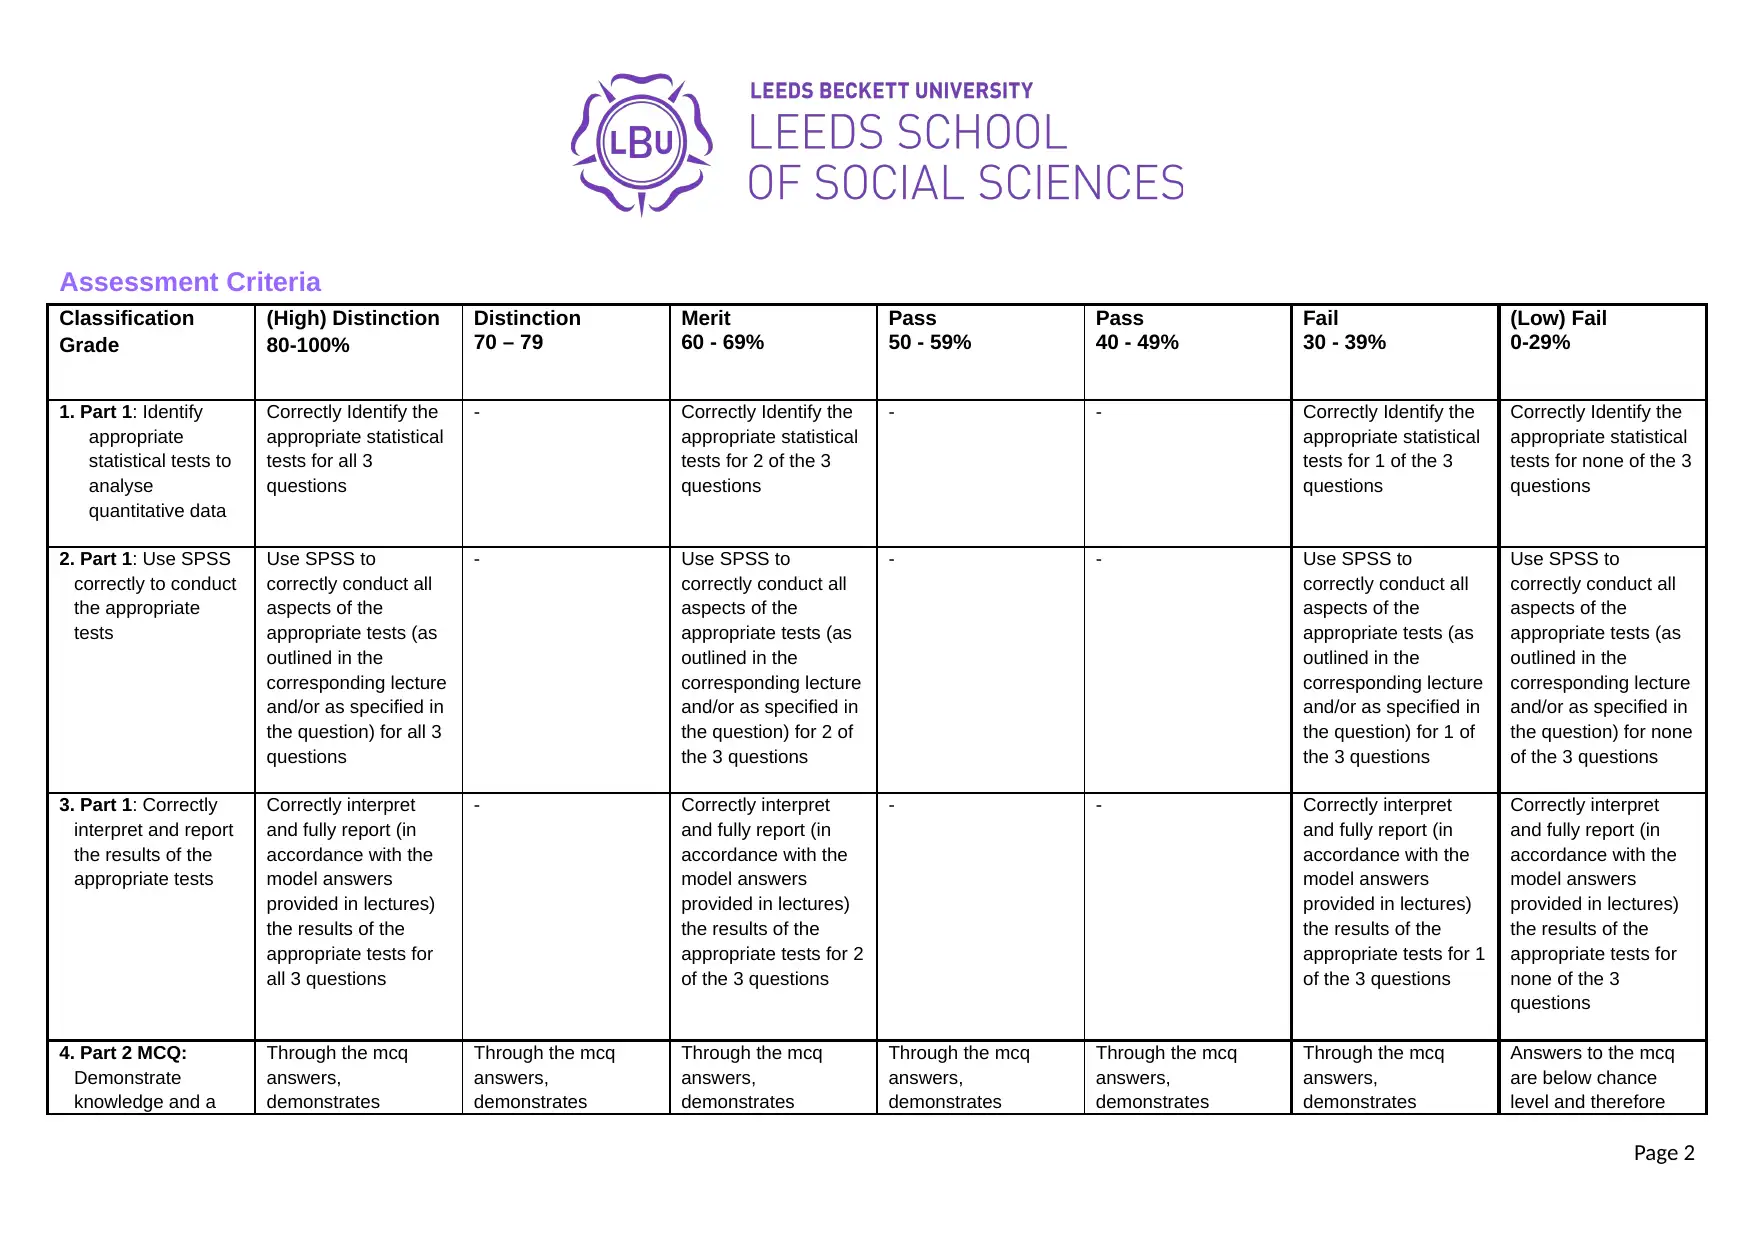
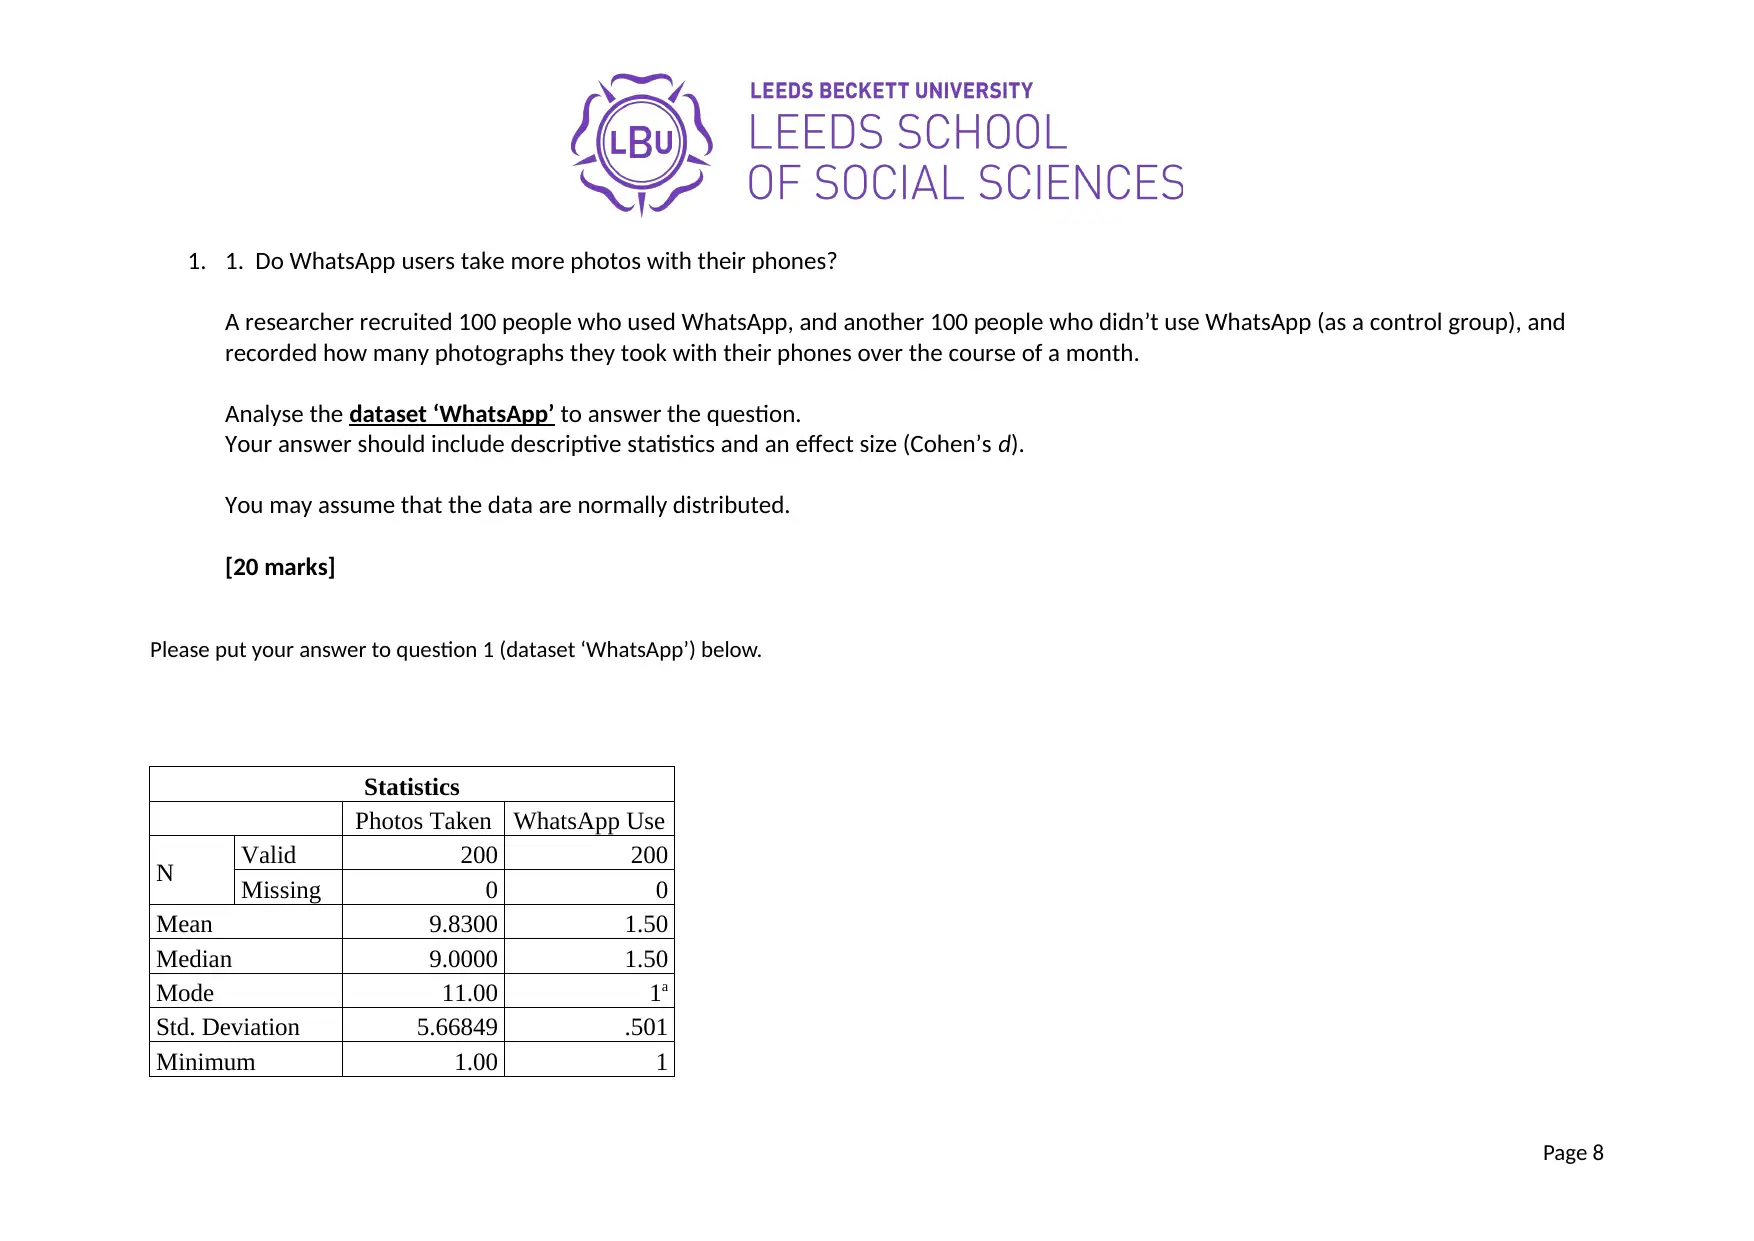
This assignment focuses on applying statistical tests using SPSS to analyze quantitative data. It includes solutions to questions related to WhatsApp usage and photo-taking habits, as well as the impact of different types of feedback on student learning. The assignment demonstrates how to conduct appropriate statistical tests, interpret the SPSS output, and report the findings in a standard research format. The document also includes an assessment feedback template and exam paper details for the Research Methods & Analysis A ON module at Leeds Beckett University, making it a comprehensive resource for students studying research methods and data analysis. Desklib provides this and many other solved assignments to help students excel in their studies.
Document Page
Assessment Feedback Template – Research Methods & Analysis A ON
– August 2021 Re-Sit
________________________________________________________________________
Instructions
Please download and save this file
Please answer all 3 questions in the form below.
Then begin your assessment on final page
When completed submit this document to the MyBeckett assessment submission link on
your exam assessment page
PLEASE SEE MARKING CRITERIA FOR THIS WORK ON PAGE 2 before YOU
SUBMIT YOUR WORK ON PAGE 6
_________________________________________________________________________
Questions to answer BEFORE you submit your work
Q1. I understand that by submitting my work online I agree and am stating that this work is
my own and has been completed within the University regulations:
(Please type YES in box)
Q2. I agree for my work to be shown to future students if this is anonymised:
(Please type YES or NO in box)
Q3. I would like some feedback specifically on:
(Please type answer in box)
_________________________________________________________________________
Marker to complete (students can ignore):
Marker name:
Second Marker (if relevant)
On time?
Page 1
Yes/No (mark penalty)
tabler-icon-diamond-filled.svg

Paraphrase This Document

Need a fresh take? Get an instant paraphrase of this document with our AI Paraphraser
Document Page
Assessment Criteria
Classification
Grade
(High) Distinction
80-100%
Distinction
70 – 79
Merit
60 - 69%
Pass
50 - 59%
Pass
40 - 49%
Fail
30 - 39%
(Low) Fail
0-29%
1. Part 1: Identify
appropriate
statistical tests to
analyse
quantitative data
Correctly Identify the
appropriate statistical
tests for all 3
questions
- Correctly Identify the
appropriate statistical
tests for 2 of the 3
questions
- - Correctly Identify the
appropriate statistical
tests for 1 of the 3
questions
Correctly Identify the
appropriate statistical
tests for none of the 3
questions
2. Part 1: Use SPSS
correctly to conduct
the appropriate
tests
Use SPSS to
correctly conduct all
aspects of the
appropriate tests (as
outlined in the
corresponding lecture
and/or as specified in
the question) for all 3
questions
- Use SPSS to
correctly conduct all
aspects of the
appropriate tests (as
outlined in the
corresponding lecture
and/or as specified in
the question) for 2 of
the 3 questions
- - Use SPSS to
correctly conduct all
aspects of the
appropriate tests (as
outlined in the
corresponding lecture
and/or as specified in
the question) for 1 of
the 3 questions
Use SPSS to
correctly conduct all
aspects of the
appropriate tests (as
outlined in the
corresponding lecture
and/or as specified in
the question) for none
of the 3 questions
3. Part 1: Correctly
interpret and report
the results of the
appropriate tests
Correctly interpret
and fully report (in
accordance with the
model answers
provided in lectures)
the results of the
appropriate tests for
all 3 questions
- Correctly interpret
and fully report (in
accordance with the
model answers
provided in lectures)
the results of the
appropriate tests for 2
of the 3 questions
- - Correctly interpret
and fully report (in
accordance with the
model answers
provided in lectures)
the results of the
appropriate tests for 1
of the 3 questions
Correctly interpret
and fully report (in
accordance with the
model answers
provided in lectures)
the results of the
appropriate tests for
none of the 3
questions
4. Part 2 MCQ:
Demonstrate
knowledge and a
Through the mcq
answers,
demonstrates
Through the mcq
answers,
demonstrates
Through the mcq
answers,
demonstrates
Through the mcq
answers,
demonstrates
Through the mcq
answers,
demonstrates
Through the mcq
answers,
demonstrates
Answers to the mcq
are below chance
level and therefore
Page 2
Document Page
critical
understanding of
different research
designs, data
collection methods
and sampling
techniques, and of
the principles of
ethical research.
knowledge and a
critical understanding
of different research
designs, data
collection methods
and sampling
techniques, and of the
principles of ethical
research to an
extremely high level.
knowledge and a
critical understanding
of different research
designs, data
collection methods
and sampling
techniques, and of the
principles of ethical
research to a very
high level.
knowledge and a
critical understanding
of different research
designs, data
collection methods
and sampling
techniques, and of the
principles of ethical
research to a high
level.
knowledge and a
critical understanding
of different research
designs, data
collection methods
and sampling
techniques, and of the
principles of ethical
research to a
moderate level.
knowledge and a
critical understanding
of different research
designs, data
collection methods
and sampling
techniques, and of the
principles of ethical
research to a low but
threshold level.
knowledge and a
critical understanding
of different research
designs, data
collection methods
and sampling
techniques, and of the
principles of ethical
research to a below
threshold level.
show little or no
evidence of
knowledge and a
critical understanding
of different research
designs, data
collection methods
and sampling
techniques, and of the
principles of ethical
research.
NOTE: It is of course possible for your mark to fall in any of the above grade categories for criteria 1-3 broadly assessed (e.g., you could score 78 on criteria 3 for fully and correctly reporting on 2 of
the 3 statistical analysis questions but only partially reporting on the other one).
Page 3
Document Page
One main way to improve your mark and feedback on the specific area identified in question 3:
Marker to complete
Page 4
tabler-icon-diamond-filled.svg

Paraphrase This Document

Need a fresh take? Get an instant paraphrase of this document with our AI Paraphraser
Document Page
LEEDS BECKETT UNIVERSITY
LEEDS SCHOOL OF SOCIAL SCIENCES
EXAMINATION PAPER
MODULE TITLE: Research Methods & Analysis A ON (RMAn A) First Re-Sit
CRN: 16396
COURSE(S): MSc Psychology (Conversion) onsite
DATE OF EXAMINATION: Tuesday 3rd August 2021
START TIME: 10.00am.
FINISH TIME: 10.00am Wednesday 4th August 2021
DURATION: Part 1: 24 hours
Part 2: 1 hour plus 15 mins for reading (to be completed in one session at any time in the same 24 hour period as Part 1)
APPROXIMATION OF TIME REQUIRED TO COMPLETE THE EXAM (excluding reading time):
Part 1: 2 hours
Part 2: 1 hour
EXAMINER(S): Dr Neil Dugdale
Page 5
Document Page
Notes for candidates:
This is a 24 hour open-book exam. You must answer all 3 questions in Part 1 and all mcq questions in Part 2.
Part 1: You must put your answers to each question underneath the corresponding question, and submit this template by the end of the exam (i.e. within
the 24 hours) using the link entitled ‘Part 1 submission’. The link is in the ‘Examination Submission August 2021’ folder accessed via the ‘COMPUTER EXAM’
tab in the RMAn A Module on MyBeckett, along with the datasets for each question and a copy of this template.
Part 2: The mcq questions can be accessed and answered via the Part 2 link in the ‘Examination Submission August 2021’ folder
Part 1 and Part 2 of the exam are in exactly the same format as they would have been had you been examined under standard conditions (e.g. for Part 1,
answer 3 scenario -based questions via SPSS and report the outcomes in the standard format given in the online material and workshops). For this reason,
we would not expect you to take longer than the 2 hours set to complete Part 1 and 1 hour set to complete Part 2 in the original exam. However, in
recognition of the fact that you would be taking the exam at home and may therefore encounter difficulties other than those that might be encountered on
University premises, you are allowed up to 24 hours from the start of the exam to submit your answers to Part 1 via this template. Part 2 can be started any
time within the 24 hour period but must be completed within 1 hour and 15 minutes (or longer for students with an exam adjustment plan) of starting it.
There are no expected word counts for the Part 1 questions below. This was because it was not deemed necessary to provide word counts in this instance
given that your answers should follow the model formats for reporting the outcomes of statistical tests as provided in the online material and as practiced
by you in the accompanying computer lab workshops (with model answers additionally provided after each lab).
PART 1
Part 1 is worth 70 marks in total.
Page 6
Document Page
Answer all three Part 1 questions below.
[The marks per question are indicated in square brackets at the end of each question].
For each question, you should:
determine the appropriate statistical test
run the test using SPSS
interpret the output
report your findings as you would in the results section of a report (in accordance with the model answers given in the workshops and
online material).
Please proceed to the next page for your first question.
Page 7
tabler-icon-diamond-filled.svg

Paraphrase This Document

Need a fresh take? Get an instant paraphrase of this document with our AI Paraphraser
Document Page
1. 1. Do WhatsApp users take more photos with their phones?
A researcher recruited 100 people who used WhatsApp, and another 100 people who didn’t use WhatsApp (as a control group), and
recorded how many photographs they took with their phones over the course of a month.
Analyse the dataset ‘WhatsApp’ to answer the question.
Your answer should include descriptive statistics and an effect size (Cohen’s d).
You may assume that the data are normally distributed.
[20 marks]
Please put your answer to question 1 (dataset ‘WhatsApp’) below.
Statistics
Photos Taken WhatsApp Use
N Valid 200 200
Missing 0 0
Mean 9.8300 1.50
Median 9.0000 1.50
Mode 11.00 1a
Std. Deviation 5.66849 .501
Minimum 1.00 1
Page 8
Document Page
Maximum 50.00 2
a. Multiple modes exist. The smallest value is
shown
Frequency Table
Photos Taken
Frequency Percent
Valid 1.00 3 1.5
2.00 10 5.0
3.00 7 3.5
4.00 5 2.5
5.00 12 6.0
6.00 13 6.5
7.00 11 5.5
8.00 26 13.0
9.00 22 11.0
10.00 13 6.5
11.00 28 14.0
12.00 15 7.5
Page 9
Document Page
14.00 6 3.0
15.00 3 1.5
16.00 3 1.5
17.00 8 4.0
19.00 4 2.0
20.00 2 1.0
21.00 3 1.5
22.00 1 .5
24.00 1 .5
25.00 3 1.5
50.00 1 .5
Total 200 100.0
Page 10
tabler-icon-diamond-filled.svg

Paraphrase This Document

Need a fresh take? Get an instant paraphrase of this document with our AI Paraphraser
Document Page
WhatsAppUse
Page 11
Document Page
Frequency Percent
Valid
people who used
WhatsApp 100 50.0
people who didn’t use
WhatsApp 100 50.0
Total 200 100.0
Page 12
chevron_up_icon
1 out of 39
circle_padding
hide_on_mobile
zoom_out_icon
[object Object]