Case Study: Risk Analysis with FMEA, FTA, and RBD Tools
VerifiedAdded on 2022/08/26
|23
|5038
|22
Report
AI Summary
This report presents a detailed analysis of risk prioritization methodologies, focusing on the application of Failure Mode and Effects Analysis (FMEA), Fault Tree Analysis (FTA), and Reliability Block Diagram (RBD). It explores the integration of these tools to enhance the objectivity and effectiveness of risk assessment, particularly in the context of equipment maintenance within an electric power facility. The study introduces a quantitative approach that incorporates factors such as downtime percentage, failure costs, and occurrence rates to prioritize failure modes. A case study is analyzed to demonstrate the practical application of this three-step ranking strategy, offering insights into the identification and mitigation of critical failures. The report also reviews literature on risk identification and prioritization, comparing traditional FMEA approaches with cost-based FMEA methods. It emphasizes the importance of data-driven decision-making for improving reliability and optimizing maintenance functions within an organization, aligning with industry standards such as ISO 9001 and ISO/TS 16949.

Risk Priority Number 1
Name of the Class
Professor
Name of the School
City and State
Date
Name of the Class
Professor
Name of the School
City and State
Date
Paraphrase This Document
Need a fresh take? Get an instant paraphrase of this document with our AI Paraphraser
Risk Priority Number 2
Abstract
There is numerous literature work that has documented the use of FMEA, FTA and RBD as in
the implementation of failure and risk analysis. However, most of the studies have usually
focused in analyzing one of the above strategies of risk analysis and prioritization in their
managerial methodology. On the other side, a combination of the three tools will greatly reduce
the degree of drawbacks associated with the risk analysis and prioritization. The failure mode
and effect analysis (FMEA) using the risk priority numbers (RPN) has been used vastly for
proper identification and prioritization of failure modes with the primary view of creating a
mitigation mechanism to the overall impact they will have on the equipment failure. However, in
the traditional setup, the risk prioritization strategy using the RNP is short of the objectivity that
is needed to ensure a robust risk assessment most importantly where the equipment data is
available which can be used to achieve objectivity. This study will cover extensively analyze the
combination of the three tools in a quantitative approach that is used in prioritizing failure mode
and the various failure components in a firm narrowly making the required leverages in the
equipment maintenance data available in the firm. To increase the objectivity of the prioritization
process, the adopted approach takes into account 3 main objective measures- percentage
downtime effect of the failure, the total cost of the failure and various failure occurrences and
their occurrence rate. The three measures use integrated measures are shown to be more robust
for risk prioritization unlike the ordinal indices given in the case of FMEA strategy approach.
Using the available recorded data, the study adopts a three-step ranking strategy in prioritizing
severe and critical failures in an electric power facility where a case study is analyzed to explain
the effects. This approach is largely described as intuitive, insightful and generalizable to the
maintenance practitioners of the plant.
Risk Priority Number 3
Keywords: risk prioritization, FMEA, maintenance strategy, design of reliability, cost-based
FMEA, failure mode, Reliability Block Diagram, Fault tree Analysis
Keywords: risk prioritization, FMEA, maintenance strategy, design of reliability, cost-based
FMEA, failure mode, Reliability Block Diagram, Fault tree Analysis
⊘ This is a preview!⊘
Do you want full access?
Subscribe today to unlock all pages.
Trusted by 1+ million students worldwide
Risk Priority Number 4
Table of Contents
Abstract............................................................................................................................................2
Introduction......................................................................................................................................6
Literature review..............................................................................................................................9
Risk identification and prioritization...........................................................................................9
Fault Tree Analysis....................................................................................................................12
Reliability Block Diagram.........................................................................................................12
Case study......................................................................................................................................12
Alternative maintenance approaches.....................................................................................15
Preventive maintenance approach.........................................................................................15
Corrective maintenance.........................................................................................................16
Opportunistic maintenance approach....................................................................................16
Condition-based approach.....................................................................................................16
Predictive maintenance approach..........................................................................................16
Machinery where the problems have raised..............................................................................17
Oil coolers..............................................................................................................................17
Machinery shaft vibration......................................................................................................17
Bearing temperature...............................................................................................................17
Discussion......................................................................................................................................18
Paraphrase This Document
Need a fresh take? Get an instant paraphrase of this document with our AI Paraphraser
Risk Priority Number 5
Conclusion.....................................................................................................................................19
References......................................................................................................................................21
Conclusion.....................................................................................................................................19
References......................................................................................................................................21
Risk Priority Number 6
Introduction
FMEA is a popular prioritization strategy in relation to risk assessment and has been widely been
used in assisting in the maintenance decision-making process. The analysis adopted by the
approach is anchored on the reliability-centered maintenance and helps in the provision of
crucial logical framework to the decision-makers to identify, conduct a thorough analysis and
prioritize various failure modes and the components associated with failure in the assets of an
organization, (Chemweno, Pintelon, and Wakiru, 2016b). In addition, FMEA helps the decision-
makers with the necessary tools for analyzing the causative agents of equipment failure and
possible consequences that might be suffered due to failures in the plant, (Panchal, Mangla,
Tyagi, and Ram, 2018). The approach also allows the prioritization of all the potential failures
faced by the firm according to the severity of the associated effects. Therefore, critical failures
that can be faced by the organization are identified, which provides the maintenance decision-
makers with the required information to create effective mitigation measures through the
implementation of various maintenance actions that are targeted in the critical failure modes,
(Du, Mo, and Deng, 2014).
Fault Tree Analysis (FTA) has been viewed as the most exhaustive use of risk analysis and
prioritization technique. Most managers have concluded that the use FTA as a risk amangement
tool is a good alternative in managing and analyzing hazards in the firms. This is minly because
of the ability of the tool to give relevant suggestions and conclusins that can be used in
decreasing similar risk frequency.
⊘ This is a preview!⊘
Do you want full access?
Subscribe today to unlock all pages.
Trusted by 1+ million students worldwide
Risk Priority Number 7
On the other hand, reliability block diagram is a risk amangement tool that is used in monitoring
various risks related traits including risk reliability, dependability, maintainability and
availability on a wide range of management exercises. The primary idea of the management tool
is illustrated in RBD. Based on the RBD, the risks can be correctly judged according to their
failure rates of each single component whereas the whole system is considered to have failed if
all the components in the RBD have failed. The reliability block diagram is critical in analysisng
overall reliability of the system which is important in assessing the trade-offs of various risks in
the organization.
The above illustrations have shown all the risk prioritization tools are reliable in the application
in risk management. each management tool comes with its own range of advantages and also
come loaded with a set of disadvantages which are always associated to the difficulty of use.
In order to effectively utilize risk priority numbers in assessing the risks the plant is exposed to,
the decision-making team is supposed to rate the various risks according to their levels of
severity, rate the likelihood of the risk occurring and calculate the RPN by determining the
product of the three factors. It simply translates to RPN = severity level x occurrence likelihood
x detection. The comparison of issues can thus be possible by using RPN corrective actions to be
taken, (Panchal and Kumar 2017). This is important as it can lead to the improvement of plant
designs for the products and processes conducted in the firm which will lead to the realization of
improved quality, reliability, increased safety, increased customer satisfaction and reduces costs
of operations.
These approaches provide relevant knowledge that is useful in tackling failure issues and
corrections initiated that can be highly resourceful in troubleshooting efforts in the future as a
tool to be used in training engineers. In addition to the use of FMEA, it is always a requirement
Paraphrase This Document
Need a fresh take? Get an instant paraphrase of this document with our AI Paraphraser
Risk Priority Number 8
for the firm to comply with the requirements of charters such as ISO 9001 and ISO/TS 16949,
(Panchal and Srivastava, 2018). The practical application of FMEA involves designing flaws and
identifying possible risks. The approach bases on plant maintenance and troubleshooting. The
approach is made of two analyses; failure model and effects analysis as well as critical analysis.
The FMEA analysis focuses on two different failure modes and the effect they have on the
system while the critical analysis focuses on prioritizing the level of importance of the failure
modes based on their rate of failure and severity of their failure effect. The ranking process of the
critical analysis depends on the available data or through the use of a procedure conducted by the
decision-making team of experts with vast knowledge about the ranking system. Although, the
ranking system can be sued in any analysis system this paper will focus on analyzing the use of
risk priority number in a power distributing facility.
The approach is initiated immediately the preliminary data is available, an update of the analysis
is done so as to provide the maximum benefits. The information obtained is highly critical to the
top management with the main concern being the obtaining of good levels of system
dependability. The management is allowed to:
a. Identify the important variables- components and functions
b. Identify, analyze and rank the failures and weaknesses and the identified system
malfunction
c. Manage the failure critical point
d. Identify and clarify the corrective mechanisms needed
e. Evaluate the effectiveness of corrective actions identified.
This points out the importance of FMEA in optimizing maintenance functions in the plant.
Ideally, the approach increases the reliability of the system which crucial in reducing the
Risk Priority Number 9
instances of failures witnessed in the plant and makes the management easily maintaining
various components as it makes it easy to control failure components and functions, (Fakher,
Nourelfath, and Gendreau, 2018).
Literature review
Risk identification and prioritization
Risk management involves four steps, risk identification, analysis, management and monitoring.
According to Rios et al., (2019), the first two steps are essential in conducting successful risk
management. numerous methods have been used in various literature focusing on the specific
type of risk identification process. the methods include a checklist, task analysis, Delphi method,
what-if analysis, risk studies and operability, risk decomposition techniques, brainstorming and
structured interviews, (Rios et al., 2019).
Failure criticality in FMEA is analyzed by determining the risk priority number (RPN) which is a
product of three metrics of risk; occurrence, detectability and risk occurrence. In an equation
form, RPN = O x D x S. The occurrence metric in the equation covers the likelihood of risk
occurrence, severity shows the severity of the risk and the detectability metric showing
likelihood for the experts to discover the risks, (Castro-Santos, Martins, and Guedes Soares,
2016). various scholars have criticized the conventional application of FMEA. The following
points have been put forward by most of the scholars:
i. Importance of the metrics, detectability, severity and occurrence has not been fully
considered, (Zammori and Gabbrielli 2012; Sharma and Sharma 2012; Liu et al.
2015). For example, risks with varying severity might give the same priority number
⊘ This is a preview!⊘
Do you want full access?
Subscribe today to unlock all pages.
Trusted by 1+ million students worldwide
Risk Priority Number 10
when calculated using the FMEA equation. Thus, the decision-makers may arrive at a
misleading conclusion of the risk criticality.
ii. The numbers used in the RPN metrics are normally ordinal numbers with values
assigned from 1 to 10 which makes it challenging to precisely evaluate the plant
failure, (Chemweno, Morag, and Sheikhalishahi, 2016a). Furthermore, the numbers
are assigned based on the experience of the expert in charge or expert judgment
which lacks empirical analysis of the event failure.
iii. Most scholars have found the formula used to compute RPN questionable. The reason
for multiplying ordinal numbers for determining the RPN which leads to determining
the criticality of the failure with indexes ranging from 1 – 1000 makes the derivation
of failure criticality not precise and straight forward.
Over the years, different scholars have conducted extensive studies on the RPN approach; Feili
et al. (2013), Du et al. (2014), Gaula and Sharma (2015), Karthikeyan M, Naikan VNA, Narayan
(2015), Li et al. (2016), Karthikeyan et al. (2017). Thus, to tackle the issue of demerits present in
the RPN, several propositions have been advanced by different authors in their bid of prioritizing
failure. Some of the scholars have suggested the use of outage, (Bhangu et al. 2017), Vala et al
(2018) has suggested the use of failure frequency and downtown while Panchal and Kumar
(2017) emphasized on the use of missed fault direction.
In their argument, the scholars hold the view that the cost measure is important to consider for
the prioritizing failure modes which will ensure accurate assigning of the maintenance strategies.
When a cost-based FMEA approach is used, there are considerable advantages as compared to
the traditional RPN-FMEA prioritization approach, (Linne´usson, Galar, and Wickelgren, 2016).
For instance, the adoption of cost ensures more accuracy since the costs of the failure can be
Paraphrase This Document
Need a fresh take? Get an instant paraphrase of this document with our AI Paraphraser
Risk Priority Number 11
quantified, computed and has a direct relationship with risks and their severity. In addition, the
use of cost as one of the metrics helps in the identification of the possible critical failures in the
plant, which will lead to a direct decrease of the failure exposure, (Bhangu et al 2017).
Therefore, this narrative makes the cost-based FMEA approach a credible strategy for analyzing
the failure of a facility with divergent sections such as the power distribution facility.
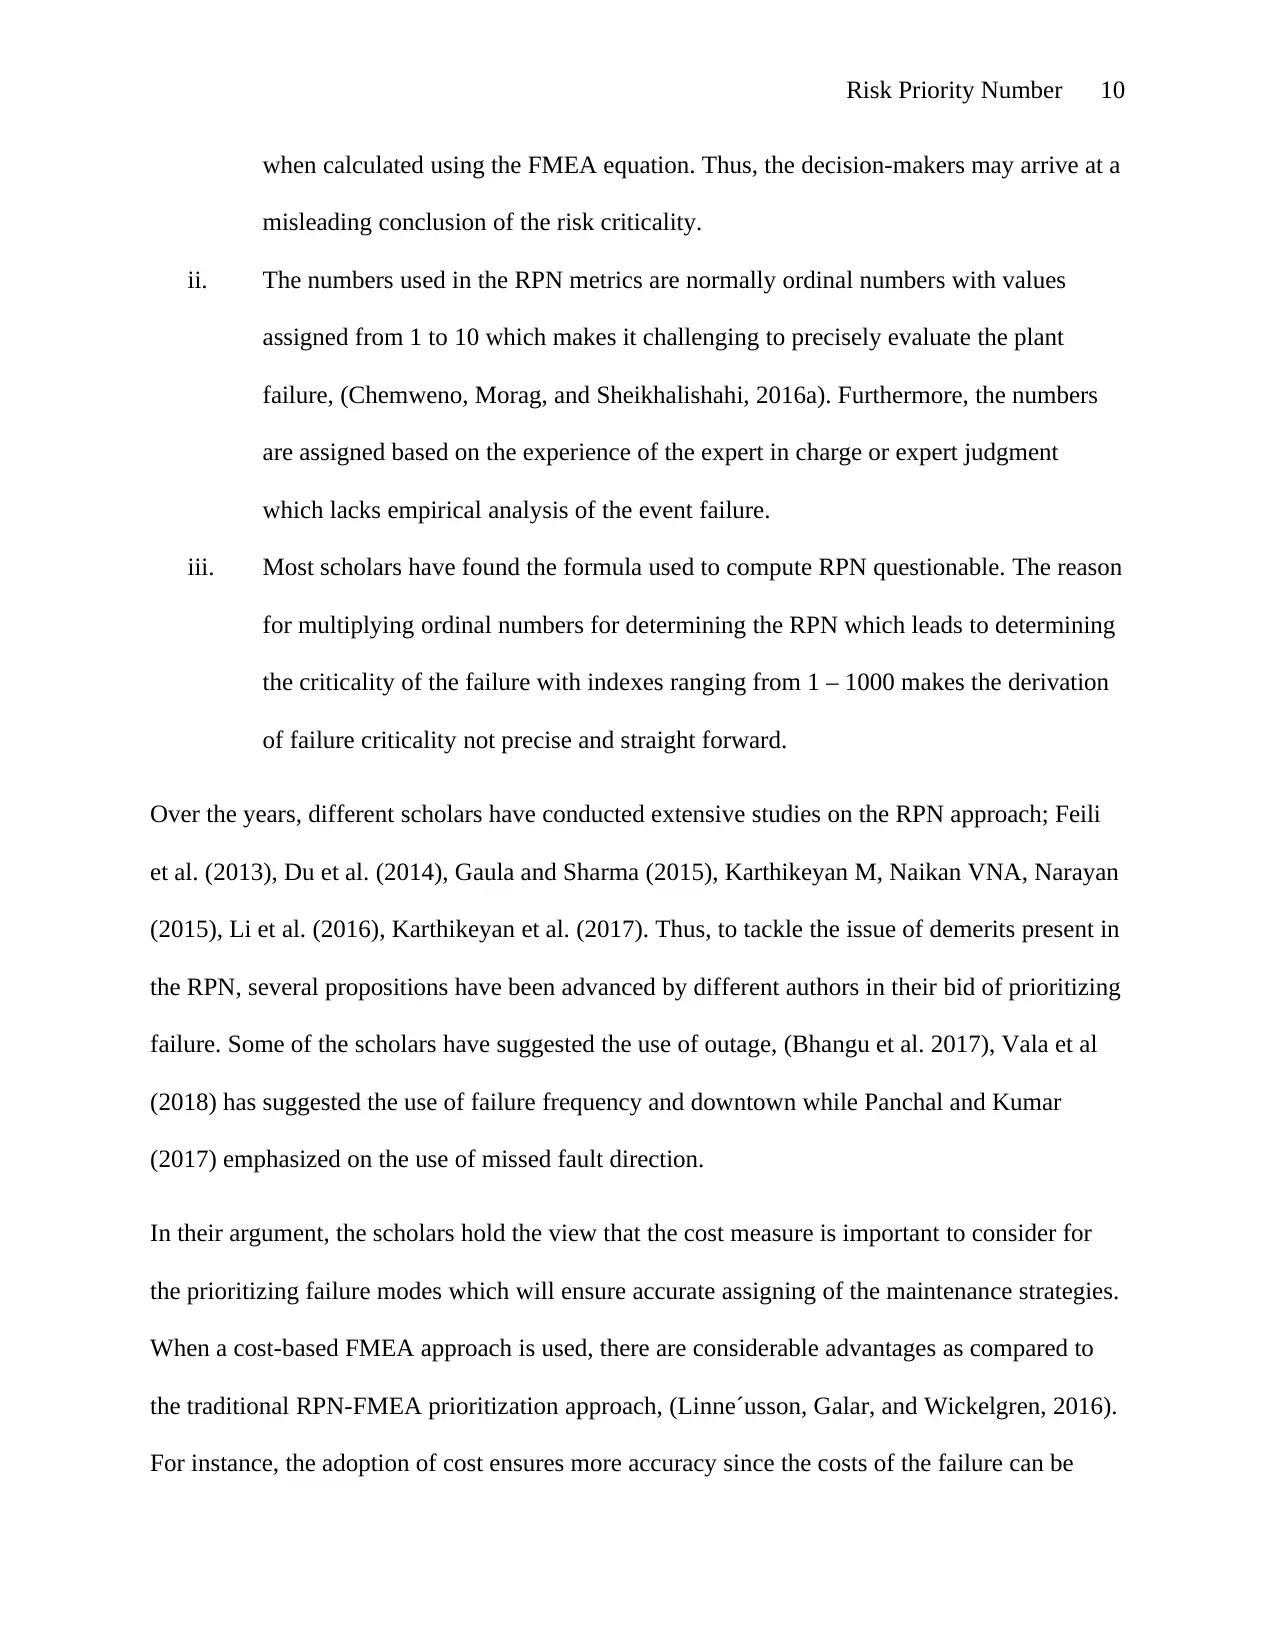
FMEA has a primary focus on the safety measures in the firm, although it has developed to
become one of the reliable tools used in risk management. Application of this tools involves ten
steps presented in the following checklist table.
Step Description
1 Product or process review
2 Brainstorming likely failure
3 Listing of possible impacts of the failure
4 Assigning severity metric to the listed failures
5 Assign occurrence metric to the likely failures
6 Assign rate of detection to each failure
7 Calculate risk priority
8 Prioritize the various failure modes and their actions
9 Take action to minimize risk impact
10 Calculate the RPN result
quantified, computed and has a direct relationship with risks and their severity. In addition, the
use of cost as one of the metrics helps in the identification of the possible critical failures in the
plant, which will lead to a direct decrease of the failure exposure, (Bhangu et al 2017).
Therefore, this narrative makes the cost-based FMEA approach a credible strategy for analyzing
the failure of a facility with divergent sections such as the power distribution facility.
FMEA has a primary focus on the safety measures in the firm, although it has developed to
become one of the reliable tools used in risk management. Application of this tools involves ten
steps presented in the following checklist table.
Step Description
1 Product or process review
2 Brainstorming likely failure
3 Listing of possible impacts of the failure
4 Assigning severity metric to the listed failures
5 Assign occurrence metric to the likely failures
6 Assign rate of detection to each failure
7 Calculate risk priority
8 Prioritize the various failure modes and their actions
9 Take action to minimize risk impact
10 Calculate the RPN result
Risk Priority Number 12
Fault Tree Analysis
The FTA refers to the analytical strategy that performs deductively when a risk occurs which
leads to the identification of the root cause of the event. The tool itself is a graphical tool that
contains several parallels and a sequence of various combinations of failures that will lead in the
occurrence of the risk. The failures might be events that are associated with human errors,
hardware and system failures or any component in the firm that can lead to the occurrence of the
risk. Development of the FTA involves six steps:
i. Definition of the risk
ii. Understand the system
iii. Construction of the fault tree
iv. Collection of the quantitative data
v. Evaluation of the probability
vi. Analysis of the computer results
Reliability Block Diagram
This risk management and prioritization strategy involves three steps:
i. Segmentation of the system into equal RNDs
ii. Assessment of each segment reliability
iii. Evaluation of availability, reliability, maintainability and reliability traits of the whole
system according to the RBD
Case study
In power distributing plant, reciprocating compressors are critical and form the heart of the plant.
The reciprocating compressors are among the most reliable machines in the world designed to
⊘ This is a preview!⊘
Do you want full access?
Subscribe today to unlock all pages.
Trusted by 1+ million students worldwide
1 out of 23
Related Documents


Your All-in-One AI-Powered Toolkit for Academic Success.
+13062052269
info@desklib.com
Available 24*7 on WhatsApp / Email
![[object Object]](/_next/static/media/star-bottom.7253800d.svg)
Unlock your academic potential
Copyright © 2020–2026 A2Z Services. All Rights Reserved. Developed and managed by ZUCOL.