MSIN0023 Project: K-NN Algorithm for Early Breast Cancer Diagnosis
VerifiedAdded on 2024/04/18
|21
|4482
|281
Project
AI Summary
This project addresses the critical issue of delayed cancer treatment by leveraging the k-Nearest Neighbors (k-NN) algorithm for early and precise breast cancer diagnosis. The algorithm predicts the classification of a 'test point' based on similarities with neighboring data points from a dataset of breast mass characteristics. The code includes data preprocessing steps such as normalization and conversion of categorical values to numerical representations. It calculates Manhattan distances between data points, identifies the nearest neighbors, and determines a diagnosis based on weighted distances. The project emphasizes modularity, readability, and user-friendliness, incorporating an interactive user interface for input. The algorithm's complexity is analyzed in relation to the value of k and the dataset size, and the code's generalization allows for adaptation to various datasets. The project concludes with a discussion of potential improvements and considerations for diverse datasets to enhance its effectiveness. Desklib offers a wealth of similar solved assignments and resources for students.

WORD COUNT : 1970
cANDIDATE NUMBER : JBZH7
MSIN0023
cANDIDATE NUMBER : JBZH7
MSIN0023
Paraphrase This Document
Need a fresh take? Get an instant paraphrase of this document with our AI Paraphraser
I/ System Requirements and Your Algorithm:
"Every month delayed in cancer treatment can raise risk of death by around 10%" (BMJ, 2020)
The statement above, emphasizes a 10% increase in the risk of death for each month of delayed
cancer treatment, stems from a study initiated in 2020. Consequently, the presented issue extends
beyond the specific context and encompasses the broader landscape of healthcare. Indeed, the
complexity of categorizing cancer in patients exhibiting general symptoms, is causing immediate
implications for the care of those potential diseased people. For women, breast cancer is known to be
one of the cancers detected very late or often not detected at all. Therefore, the core problem our
algorithm seeks to address can be articulated as follows:
How can we facilitate early and precise diagnoses of breast cancer, even in cases that occasionally
surpass human knowledge, by leveraging the study of similarities between potential and previous
patients?
The proposed solution for this problem relies on the use of the k-Nearest Neighbors (k-NN)
algorithm. Indeed, this algorithm is a type of machine learning algorithm used for data classification,
or in our case, for predicting the classification of data. The relevance of k-NN lies in its ability to
make predictions about the classification of a called 'test point' based on the study of similarities to its
neighbouring data points, which belong to an existing database. This phenomenon makes sense in our
context, where we study the characteristics of a breast mass in a patient in comparison to these same
characteristics within a database of individuals who either were diagnosed with breast cancer or did
not.
Functional Requirements are defined as the requirements the system needs to assure a appropriate and
efficient behaviours. Here are the following for this case:
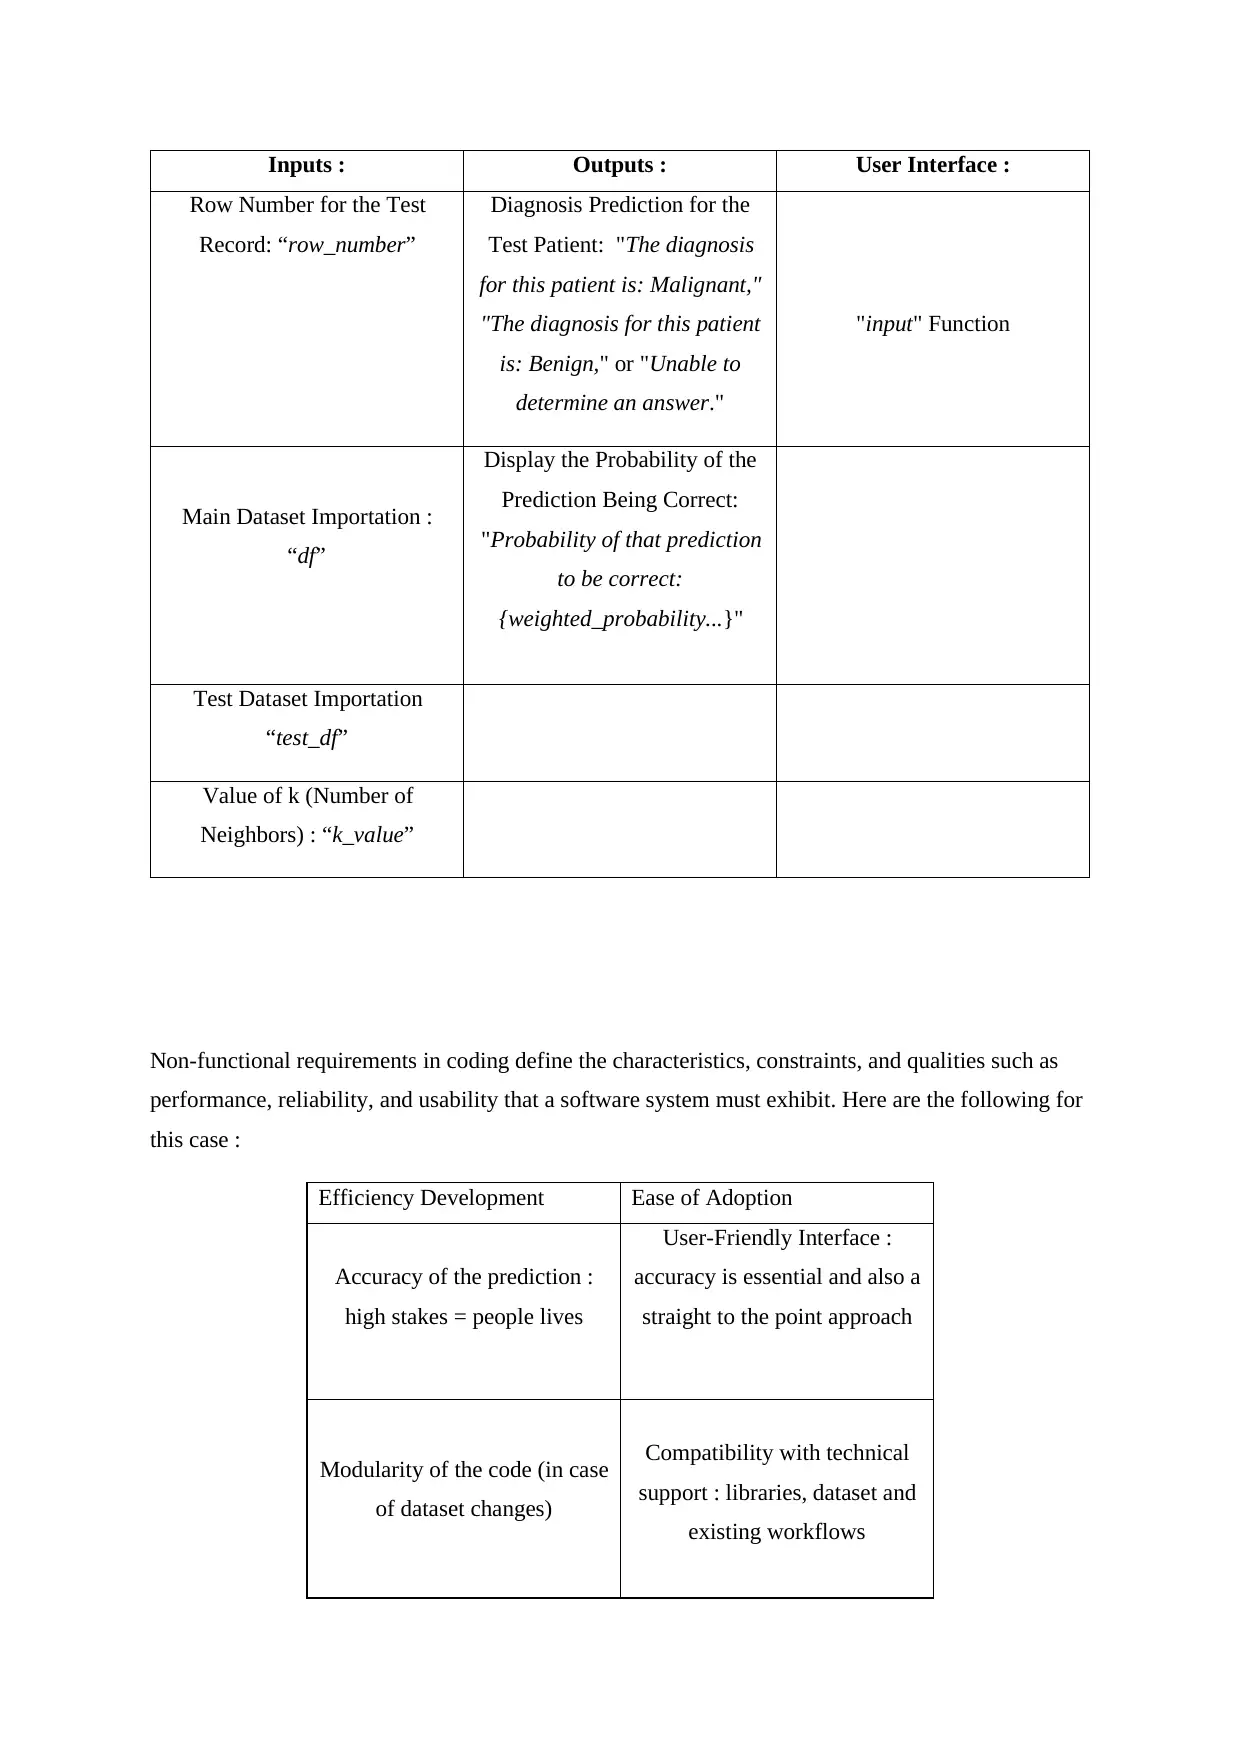
Inputs : Outputs : User Interface :
Row Number for the Test
Record: “row_number”
Diagnosis Prediction for the
Test Patient: "The diagnosis
for this patient is: Malignant,"
"The diagnosis for this patient
is: Benign," or "Unable to
determine an answer."
"input" Function
Main Dataset Importation :
“df”
Display the Probability of the
Prediction Being Correct:
"Probability of that prediction
to be correct:
{weighted_probability...}"
Test Dataset Importation
“test_df”
Value of k (Number of
Neighbors) : “k_value”
Non-functional requirements in coding define the characteristics, constraints, and qualities such as
performance, reliability, and usability that a software system must exhibit. Here are the following for
this case :
Efficiency Development Ease of Adoption
Accuracy of the prediction :
high stakes = people lives
User-Friendly Interface :
accuracy is essential and also a
straight to the point approach
Modularity of the code (in case
of dataset changes)
Compatibility with technical
support : libraries, dataset and
existing workflows
⊘ This is a preview!⊘
Do you want full access?
Subscribe today to unlock all pages.
Trusted by 1+ million students worldwide
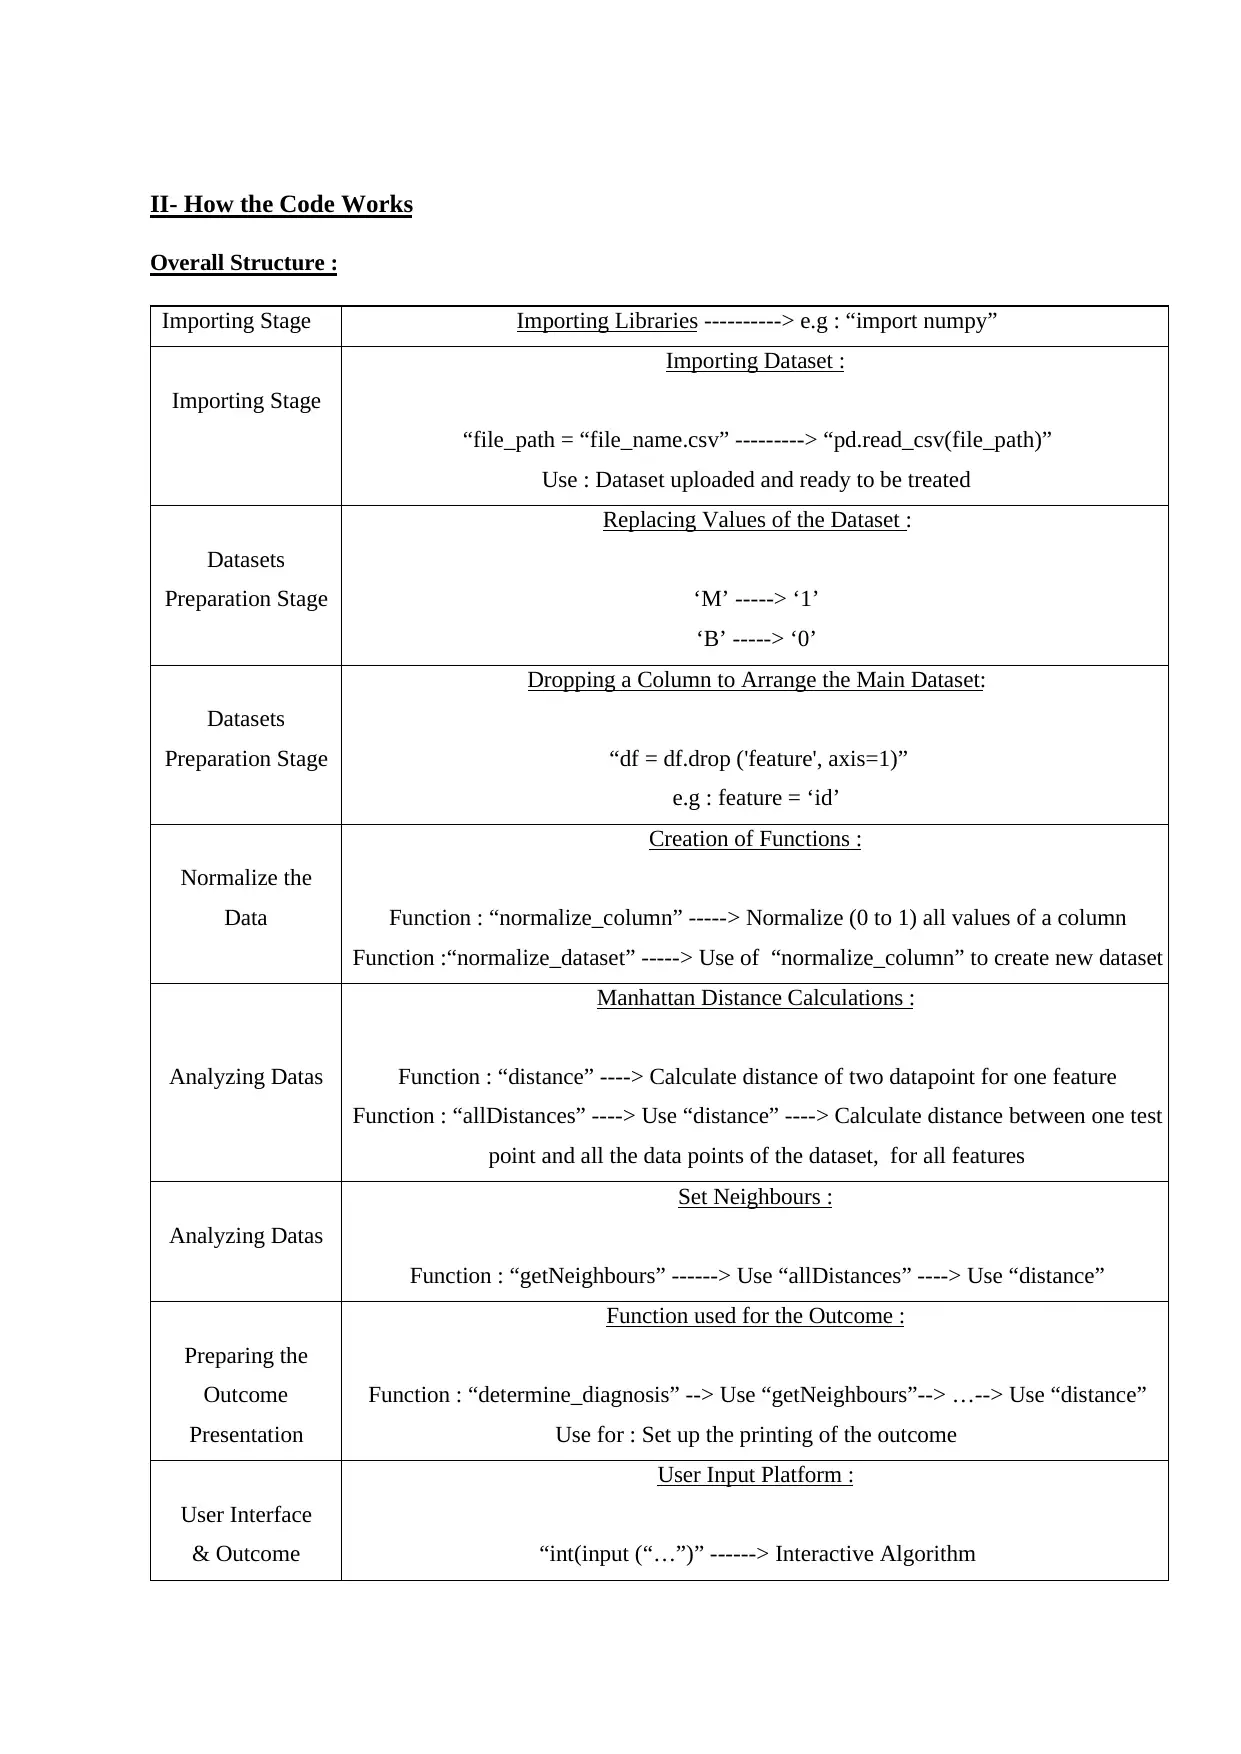
II- How the Code Works
Overall Structure :
Importing Stage Importing Libraries ----------> e.g : “import numpy”
Importing Stage
Importing Dataset :
“file_path = “file_name.csv” ---------> “pd.read_csv(file_path)”
Use : Dataset uploaded and ready to be treated
Datasets
Preparation Stage
Replacing Values of the Dataset :
‘M’ -----> ‘1’
‘B’ -----> ‘0’
Datasets
Preparation Stage
Dropping a Column to Arrange the Main Dataset:
“df = df.drop ('feature', axis=1)”
e.g : feature = ‘id’
Normalize the
Data
Creation of Functions :
Function : “normalize_column” -----> Normalize (0 to 1) all values of a column
Function :“normalize_dataset” -----> Use of “normalize_column” to create new dataset
Analyzing Datas
Manhattan Distance Calculations :
Function : “distance” ----> Calculate distance of two datapoint for one feature
Function : “allDistances” ----> Use “distance” ----> Calculate distance between one test
point and all the data points of the dataset, for all features
Analyzing Datas
Set Neighbours :
Function : “getNeighbours” ------> Use “allDistances” ----> Use “distance”
Preparing the
Outcome
Presentation
Function used for the Outcome :
Function : “determine_diagnosis” --> Use “getNeighbours”--> …--> Use “distance”
Use for : Set up the printing of the outcome
User Interface
& Outcome
User Input Platform :
“int(input (“…”)” ------> Interactive Algorithm
Paraphrase This Document
Need a fresh take? Get an instant paraphrase of this document with our AI Paraphraser
determine_diagnosis(neighbours, k_value) ---> Treatment of the Inputs --> Outcome
Dataset Preparation Stage : Coded by ‘Louis Dayen’
Normalize the Dat : Coded by ‘Louis Dayen’ ‘IgnacioCazorla’
Analyzing the data : Coded by ‘Louis Dayen’ , ‘Sun_Mars’
Preparing the Outcome Presentation : Coded by ‘Louis Dayen’
User Interface & Outcome : Coded by ‘Juan_Zhu’
Flow of the Code:
1. Importation and Preprocess of the Data:
a) Importing libraries
b) Importing datasets
c) Conversion of “diagnosis” in numerical labels
d) Dropping “id” column to facilitate mathematical processing
2. Normalize the Data:
e) Generalization of normalizing one specific value of a column, thanks to an equation
f) Normalizing all values of each column except “diagnosis”
g) Filling normalized values in the original main dataset “df”
h) Repeat that step with the “test_df” dataset
3. Data Analysis:
i) General formula of the Manhattan Distance, applied for only one specific feature of two
data points (“distance)
j) Calculate all distances, for each future, of two data points (“allDistances”)
k) Set up the concept of neighbours (“getNeighbours”)
l) Make every neighbour as ‘unique’
4. Outcome Organization and Presentation:
m) Create a weighted distances formula, in order to create probabilities of the outcome to be
accurate
n) Set up printing options, depending of the neighbours and their distances with the test data
point
o) Creation of user interface for input computing
p) Choice of the test point in “normalized_test_df”
q) Run Code
Generalization of the code:
The code presented in this project is highly generalized, primarily due to its adaptability to a vast
array of datasets. This algorithm relies on studying similarities between an unclassified data point and
classified data points to predict the classification of our 'test' value as accurately as possible.
Moreover, the code can be easily modified for datasets containing non-quantitative values by adding a
normalization function, opening up even more possibilities for the algorithm's application. It is
feasible to apply this algorithm to the question of eligibility for a bank loan. Indeed, an individual's
profile can be tested (features would be : annual revenues, number of children, age,..) with the
presented algorithm and classified as suitable or not for a loan.
Data Representation:
The various datasets have been modified throughout the code to be better suited for the final analysis.
Firstly, it's crucial to note that there are two distinct datasets in this algorithm. The initial data
modification involves replacing 'M' with '1' and 'B' with '0' ("df"). Subsequently, the 'id' column is
removed from both datasets, deemed unnecessary and a potential hindrance during distance
calculations. Finally, a significant alteration is the normalization of column values, aiming to facilitate
distance calculations and, consequently, the final outcome. Logically, this normalization of values is
applied to both datasets due to the nature of distances being computed between the values of each
dataset.
Noteworthy Coding:
The “normalize_column” function employs a list comprehension to iteratively normalize values
within a given column. This succinct approach avoids the need for explicit loops, enhancing
readability and conciseness. The list comprehension iterates over each element in the input column,
applying the normalization formula: “(x - min_val) / (max_val - min_val)”.
On the other hand, the “allDistances” function employs a conventional for-loop to iterate over rows in
the dataset. It integrates the distance function using a list comprehension to calculate distances
between a test record and all rows. The list comprehension efficiently generates a list of distances,
enhancing the function's performance. The recursive paradigm is not utilized here; instead, it employs
a straightforward iteration approach to achieve its goal of computing distances.
⊘ This is a preview!⊘
Do you want full access?
Subscribe today to unlock all pages.
Trusted by 1+ million students worldwide
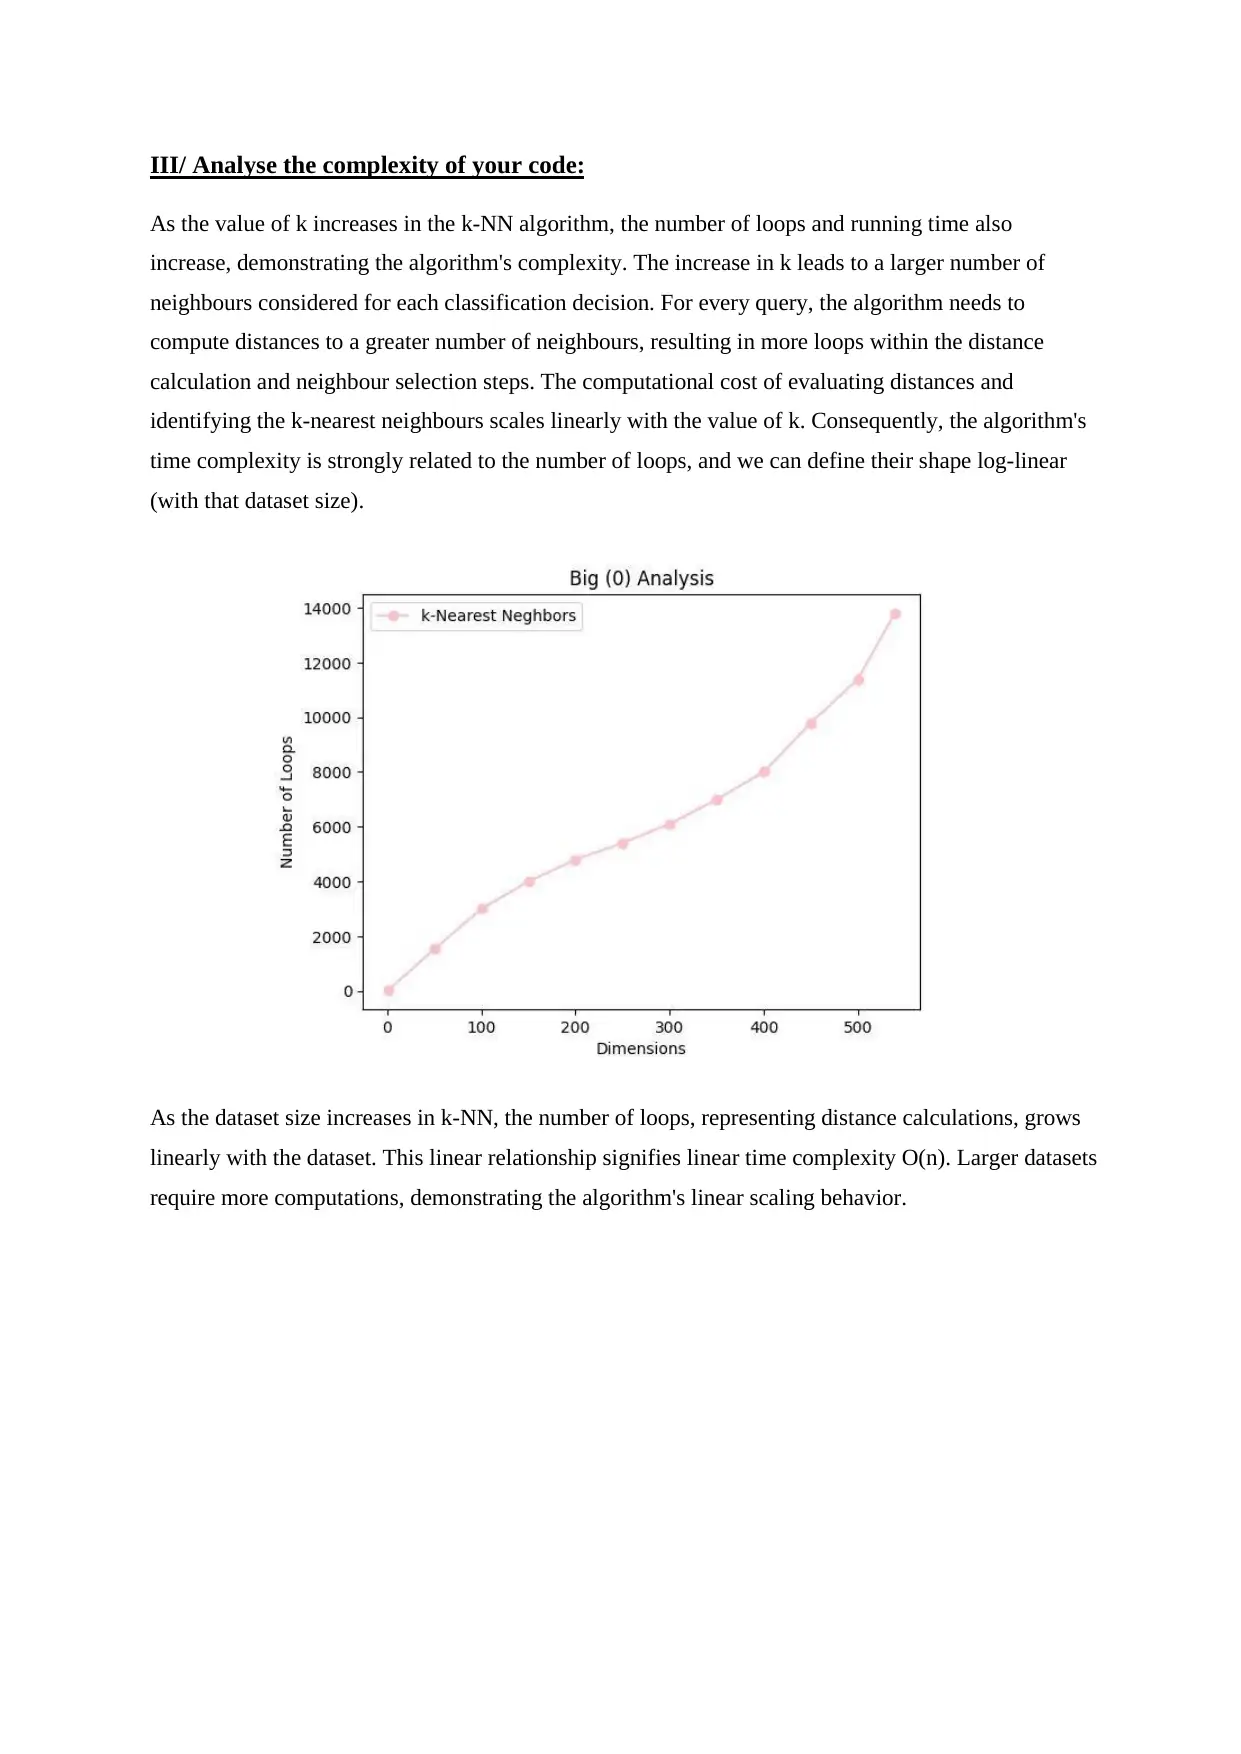
III/ Analyse the complexity of your code:
As the value of k increases in the k-NN algorithm, the number of loops and running time also
increase, demonstrating the algorithm's complexity. The increase in k leads to a larger number of
neighbours considered for each classification decision. For every query, the algorithm needs to
compute distances to a greater number of neighbours, resulting in more loops within the distance
calculation and neighbour selection steps. The computational cost of evaluating distances and
identifying the k-nearest neighbours scales linearly with the value of k. Consequently, the algorithm's
time complexity is strongly related to the number of loops, and we can define their shape log-linear
(with that dataset size).
As the dataset size increases in k-NN, the number of loops, representing distance calculations, grows
linearly with the dataset. This linear relationship signifies linear time complexity O(n). Larger datasets
require more computations, demonstrating the algorithm's linear scaling behavior.
Paraphrase This Document
Need a fresh take? Get an instant paraphrase of this document with our AI Paraphraser
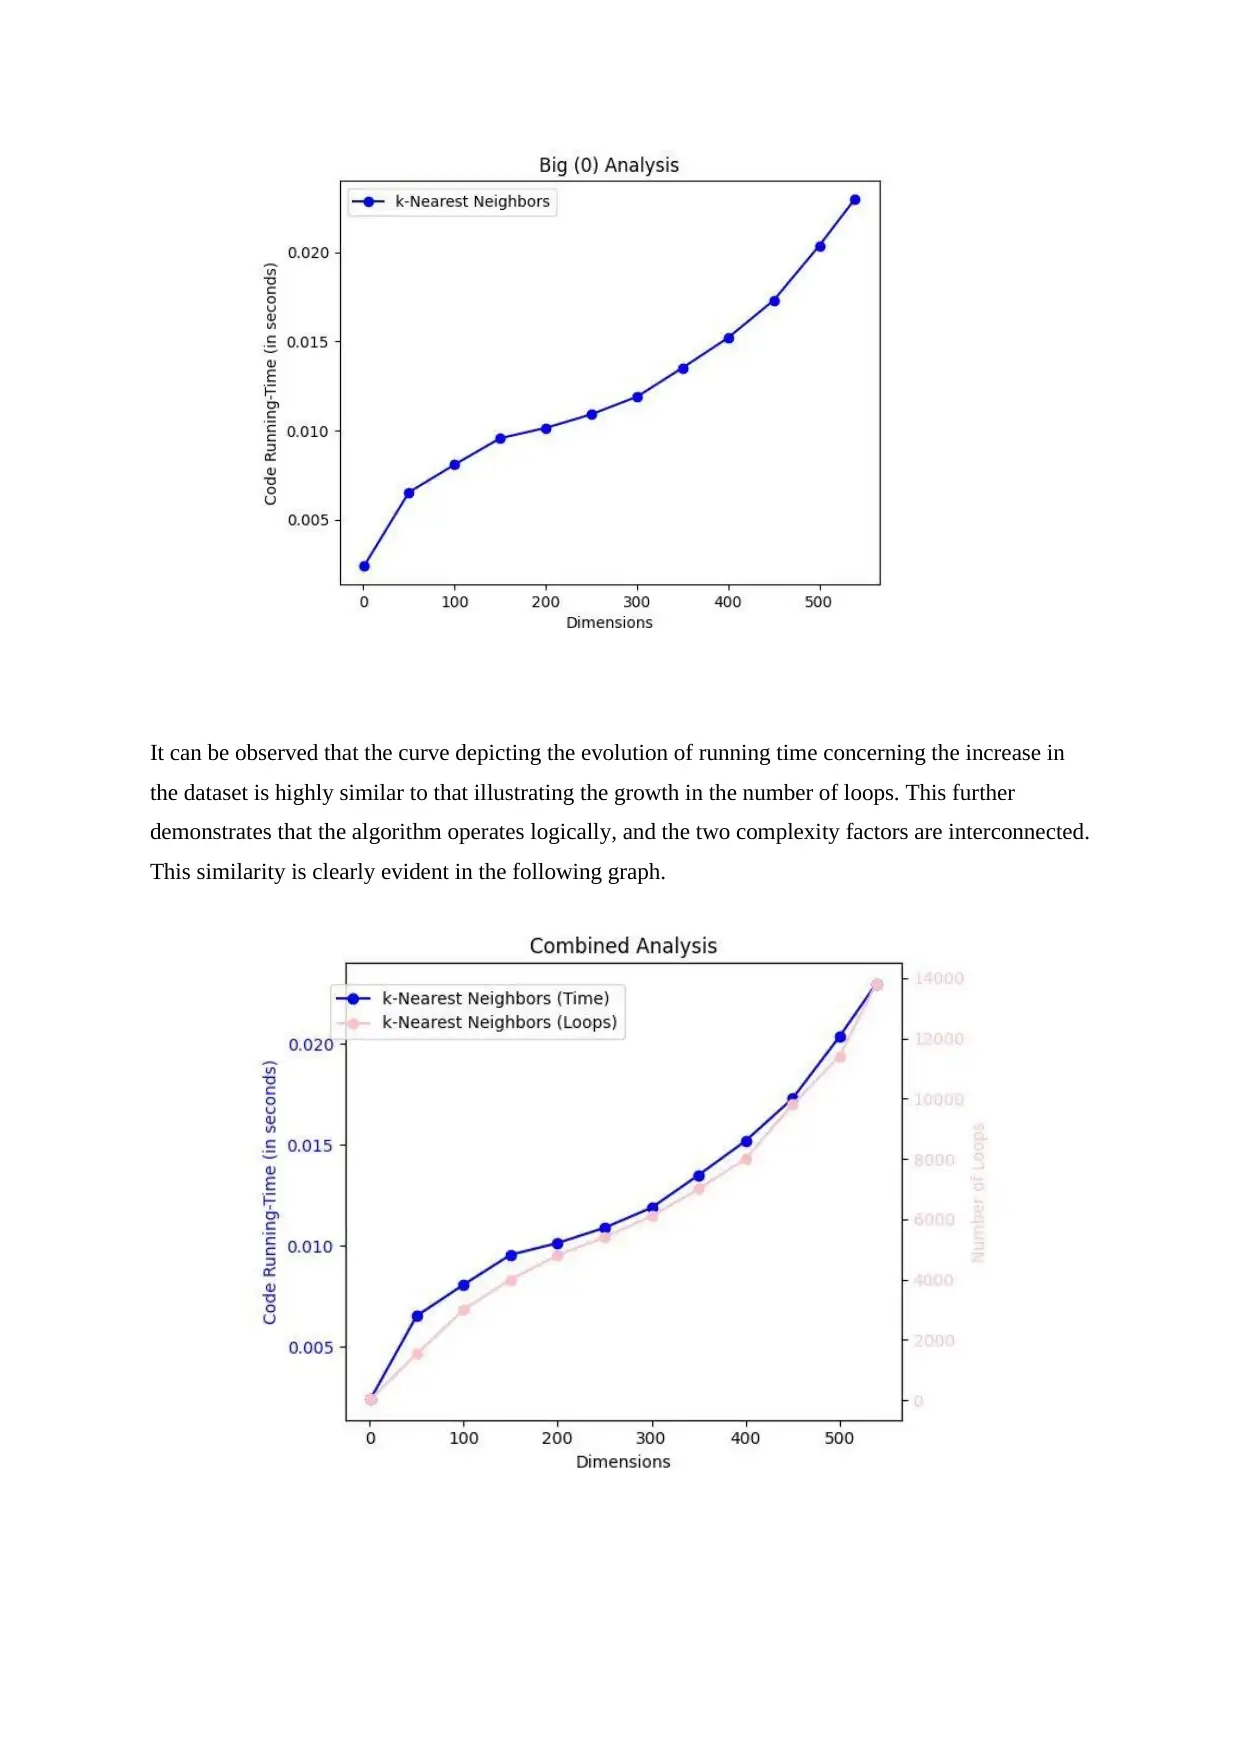
It can be observed that the curve depicting the evolution of running time concerning the increase in
the dataset is highly similar to that illustrating the growth in the number of loops. This further
demonstrates that the algorithm operates logically, and the two complexity factors are interconnected.
This similarity is clearly evident in the following graph.
the dataset is highly similar to that illustrating the growth in the number of loops. This further
demonstrates that the algorithm operates logically, and the two complexity factors are interconnected.
This similarity is clearly evident in the following graph.
IV/ Describe the data used to test your code:
The two datasets used for the algorithm originate from the same data source, but I modified them to
create two distinct and independent datasets. Before modification, the data used in the algorithm
represented the breast mass characteristics of women from Wisconsin, updated for the year 2024,
consisting of 30 quantitative features and two fixed features with the patient's 'id' and 'diagnosis'.
I chose to separate the initial dataset into two distinct datasets, simplifying the selection of relevant
rows that will serve as a test for my algorithm. I selected 30 patients from the initial dataset and
placed them in a new dataset called "test_df." In this dataset, I pre-emptively removed the diagnosis to
simulate a scenario where a physician has completed their analyses and wants to conduct tests. On the
other hand, the main dataset initially consists of 539 rows and 32 columns. However, as explained
earlier, the initial values of the dataset will soon be replaced with normalized values for better
analysis.
As for the selection of data for testing the algorithm, I opted for a pragmatic approach, placing myself
once again in the shoes of a physician. I assumed that when the physician receives their Excel
spreadsheet containing breast mass data for patients, they would choose the row number and have the
flexibility to switch patients as needed. Therefore, I designed my code to be interactive, allowing the
user to make choices rather than selecting a random patient each time.
To generate datasets of varying sizes, I introduced a parameter called "subset_size" in my algorithm.
This parameter considers patients from the first row up to the specified subset size. Consequently, I
incrementally increased the number of rows accommodated by the "normalized_df" dataset by a
recurring amount. This approach facilitates the exploration of diverse dataset sizes, providing a more
comprehensive understanding of the algorithm's performance under different conditions
⊘ This is a preview!⊘
Do you want full access?
Subscribe today to unlock all pages.
Trusted by 1+ million students worldwide
V/ Conclusions:
The code addresses a critical issue of delayed cancer treatment, emphasizing the importance of early
and precise diagnoses for breast cancer. Leveraging the k-NN algorithm, the solution focuses on
predicting the classification of a 'test point' based on similarities with neighboring data points in an
existing database. The code demonstrates good design principles by modularizing functionalities,
promoting code readability, and incorporating user-friendly input platforms. Alternative approaches
could include exploring other machine learning algorithms or incorporating additional features for a
more comprehensive analysis. Improvements could be made by enhancing the user interface,
optimizing code efficiency, and exploring alternative distance metrics.
The code's generalization allows it to be adapted for various datasets, making it a versatile tool for
different classification problems. However, the limitations in the test data, particularly its size and
origin, may impact the algorithm's applicability to real-world scenarios. A more extensive and diverse
dataset would provide a more robust evaluation.
In conclusion, the code presents a valuable tool for early breast cancer diagnosis, demonstrating good
design principles and versatility. Further enhancements and considerations for diverse datasets could
improve its effectiveness and broaden its applicability to various classification challenges.
Paraphrase This Document
Need a fresh take? Get an instant paraphrase of this document with our AI Paraphraser
Appendix :
import pandas as pd
import numpy as np
import random
import time
#importing necessaries libraries
#pandas library : read the data from a csv file
#numpy library : mathematical operating functions in multi-dimensional arrays
#random library : sample a randomize row
file_path = 'bcd.csv'
df = pd.read_csv(file_path)
#import the dataset called 'bcd.csv'
test_file_path = 'testdata.csv'
test_df = pd.read_csv(test_file_path)
for index, value in enumerate(df['diagnosis']):
#loop used to traverse each diagnosis value in the 'diagnosis' column of the dataset called 'df'
if value == 'M':
df.at[index, 'diagnosis'] = 1
#Looking for every value 'M' (meaning Malignant) in the 'diagnosis' column
#Replace those 'M' values by the integer '1'
elif value == 'B':
df.at[index, 'diagnosis'] = 0

#Looking for every value 'B' (meaning Benign) in the 'diagnosis' column
#Replace those '0' values by the integer '0'
#Importance of that step : k-NN needs numerical labels in order to facilitate distance calculations that
will be conducted later on
df = df.drop('id', axis=1)
test_df = test_df.drop('id', axis=1)
#Drop the 'id' column since its purpose is only informative and have no relevance for modelling and
analysing
def normalize_column(column):
min_val = min(column)
#Calculate the minimum value in the column
max_val = max(column)
#Calculate the maximum value in the column.
normalized_column = [(x - min_val) / (max_val - min_val) for x in column]
#normalize all values of the column so it has a value between 0 and 1, thanks to
'normalized_column' mathematical operation
# x being original values of the column
return normalized_column
cols_to_normalize = [col for col in df.columns if col != 'diagnosis']
#Identify the columns that need to be normalized, excluding the column named 'diagnosis'
def normalize_dataset(dataset):
⊘ This is a preview!⊘
Do you want full access?
Subscribe today to unlock all pages.
Trusted by 1+ million students worldwide
1 out of 21


Your All-in-One AI-Powered Toolkit for Academic Success.
+13062052269
info@desklib.com
Available 24*7 on WhatsApp / Email
![[object Object]](/_next/static/media/star-bottom.7253800d.svg)
Unlock your academic potential
Copyright © 2020–2026 A2Z Services. All Rights Reserved. Developed and managed by ZUCOL.