Investment Management: MSIN0082 Portfolio Construction and Analysis
VerifiedAdded on 2023/06/13
|11
|3608
|361
Report
AI Summary
This report provides a comprehensive analysis of a moderate-risk investment portfolio designed for a client with a 10-year investment horizon. The portfolio, constructed with a mix of 50% equity shares (Cadbury, Sainsbury, Tesco), 40% bonds (Legal and General, UK Government Bonds), and 10% marketable securities and commercial paper, aims for wealth generation through capital appreciation. The report evaluates the portfolio's composition, considering both qualitative and quantitative factors, and employs financial calculations like standard deviation, variance, correlation, covariance, and beta to assess historical performance. The analysis includes a comparison against a benchmark rate of 2.50% from the London Stock Exchange, indicating the portfolio's potential to outperform. Models such as the Gordon's dividend growth model and Capital Asset Pricing Model (CAPM) are referenced for theoretical evaluation, and future returns are predicted based on forecasted earnings. The report also addresses various risks, including market risk, inflation risk, and liquidity risk, ensuring a balanced perspective on the portfolio's potential and limitations. Desklib provides access to this and other solved assignments for students.
MSIN0082 Investment
Management
Management
Paraphrase This Document
Need a fresh take? Get an instant paraphrase of this document with our AI Paraphraser

Contents
INTRODUCTION...........................................................................................................................3
MAIN BODY...................................................................................................................................3
Requirement and Preferences in long and short term:............................................................3
Portfolio Objectives & Investment Strategy:.........................................................................3
General Risks that may affect the Performance of the Portfolio:...........................................4
Portfolio composition and qualitative and quantitative reasons for composition (Class of
Assets and Characteristics of Security)..................................................................................4
Selection and Construction of an Appropriate Benchmark:...................................................5
Portfolio’s Historical Performance, both Absolute and Relative to the Benchmark:.............6
Use & Explanation of Financial Calculations to Support Decisions & Analysis:.................6
Predicted Future Returns:.......................................................................................................7
Reasons to Expect Future Performance to Remain the Same, Be Worse or Improve:..........7
CONCLUSION................................................................................................................................8
REFERENCES................................................................................................................................9
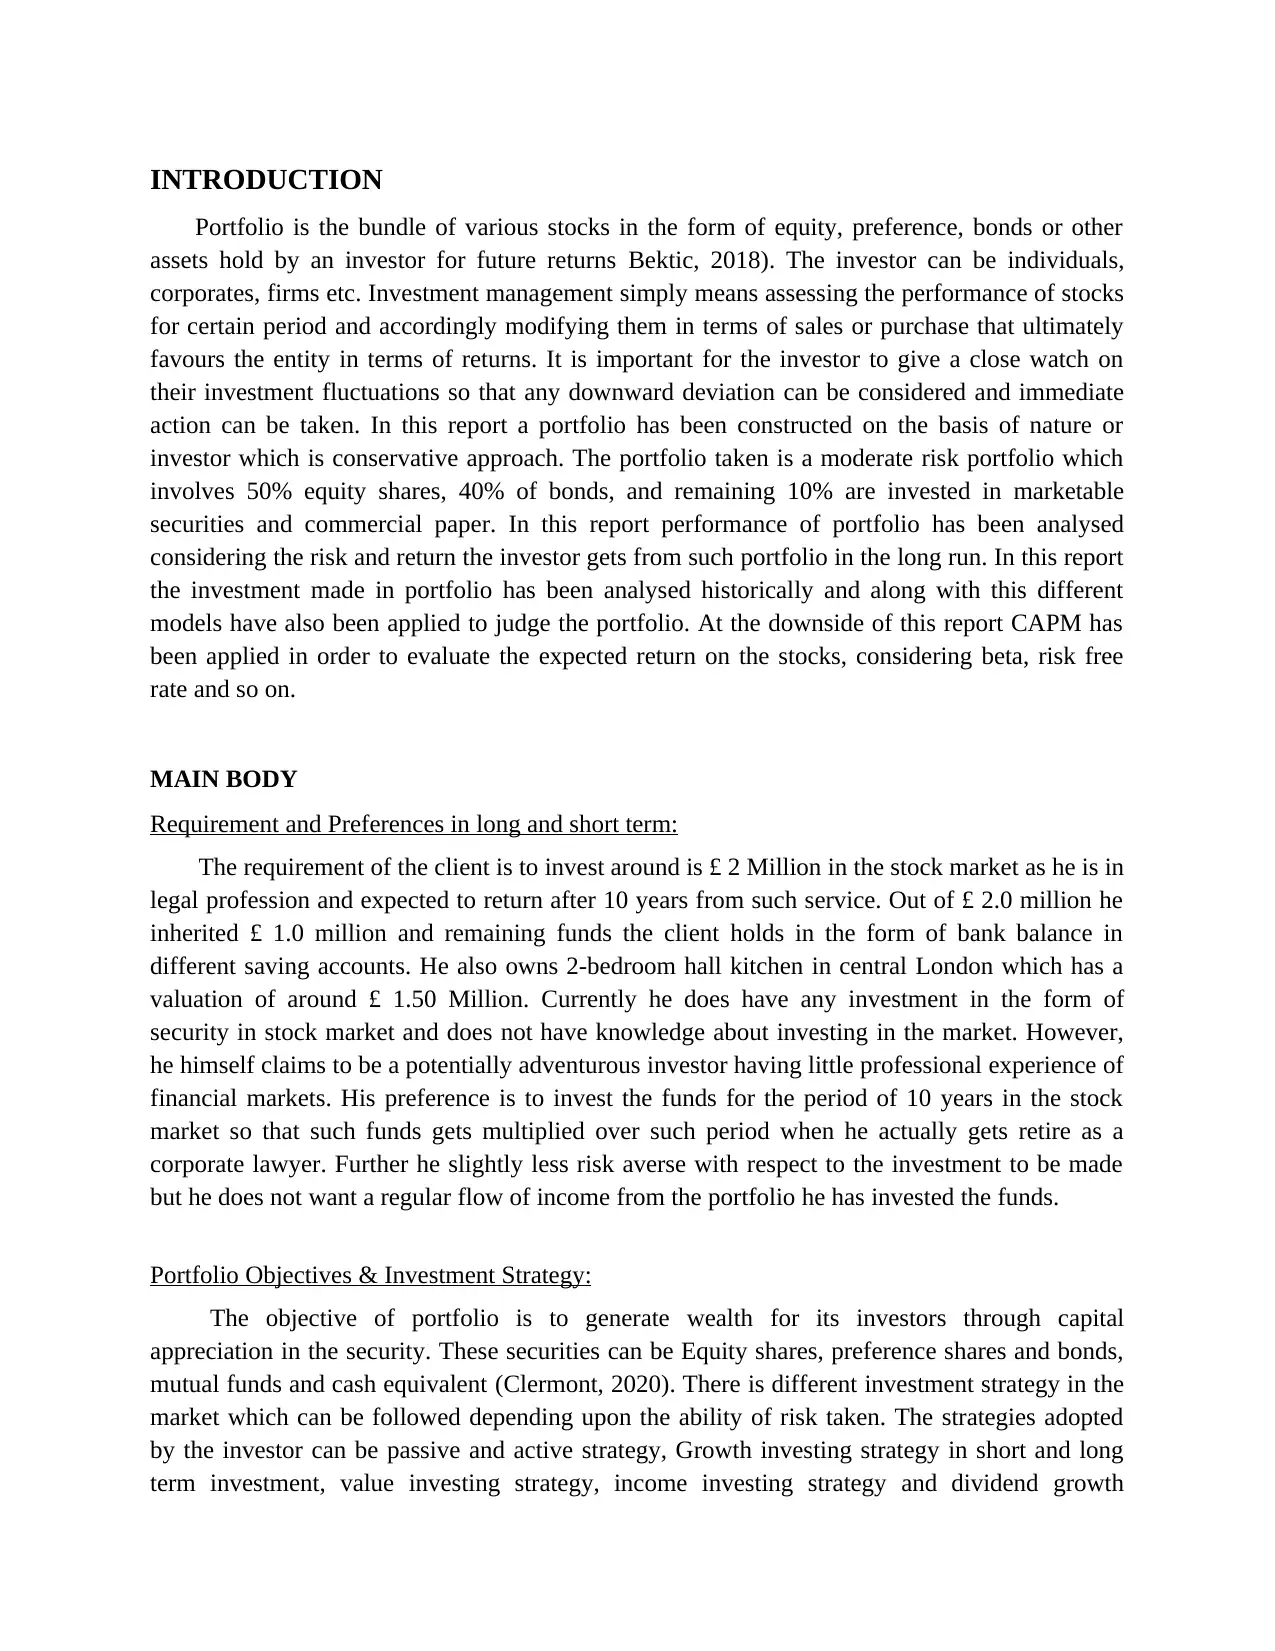
INTRODUCTION
Portfolio is the bundle of various stocks in the form of equity, preference, bonds or other
assets hold by an investor for future returns Bektic, 2018). The investor can be individuals,
corporates, firms etc. Investment management simply means assessing the performance of stocks
for certain period and accordingly modifying them in terms of sales or purchase that ultimately
favours the entity in terms of returns. It is important for the investor to give a close watch on
their investment fluctuations so that any downward deviation can be considered and immediate
action can be taken. In this report a portfolio has been constructed on the basis of nature or
investor which is conservative approach. The portfolio taken is a moderate risk portfolio which
involves 50% equity shares, 40% of bonds, and remaining 10% are invested in marketable
securities and commercial paper. In this report performance of portfolio has been analysed
considering the risk and return the investor gets from such portfolio in the long run. In this report
the investment made in portfolio has been analysed historically and along with this different
models have also been applied to judge the portfolio. At the downside of this report CAPM has
been applied in order to evaluate the expected return on the stocks, considering beta, risk free
rate and so on.
MAIN BODY
Requirement and Preferences in long and short term:
The requirement of the client is to invest around is £ 2 Million in the stock market as he is in
legal profession and expected to return after 10 years from such service. Out of £ 2.0 million he
inherited £ 1.0 million and remaining funds the client holds in the form of bank balance in
different saving accounts. He also owns 2-bedroom hall kitchen in central London which has a
valuation of around £ 1.50 Million. Currently he does have any investment in the form of
security in stock market and does not have knowledge about investing in the market. However,
he himself claims to be a potentially adventurous investor having little professional experience of
financial markets. His preference is to invest the funds for the period of 10 years in the stock
market so that such funds gets multiplied over such period when he actually gets retire as a
corporate lawyer. Further he slightly less risk averse with respect to the investment to be made
but he does not want a regular flow of income from the portfolio he has invested the funds.
Portfolio Objectives & Investment Strategy:
The objective of portfolio is to generate wealth for its investors through capital
appreciation in the security. These securities can be Equity shares, preference shares and bonds,
mutual funds and cash equivalent (Clermont, 2020). There is different investment strategy in the
market which can be followed depending upon the ability of risk taken. The strategies adopted
by the investor can be passive and active strategy, Growth investing strategy in short and long
term investment, value investing strategy, income investing strategy and dividend growth
⊘ This is a preview!⊘
Do you want full access?
Subscribe today to unlock all pages.
Trusted by 1+ million students worldwide
investing. These strategies are adopted by investors on the basis of risk and return and portfolio
they hold. In the given case the strategy adopted should be of growth strategy as the investor is
less risk averse and want to invest in stock for the period of 10 years and does not want regular
flow of income. Therefore, the strategy would be growth strategy in which the amount directly
invested for 10 years.
General Risks that may affect the Performance of the Portfolio:
Risk can be divided into various types which affects the performance of portfolio such
market risk which is related to changes in market, Risk of inflation which affect the purchasing
power of consumer, Mortality risk which directly related to survival and longitivity, Changes in
the interest rate which creates the risk, and risk of liquidity which is again important part of
investment planning (Goharian and Khatami, 2019). In the given circumstance the portfolio
consists of FMCG sector companies that is marks and spencer’s, Sainsbury, Tesco and Coca cola
group and such companies are having large market cap. Such equity does not vary frequently
which is important is the moderate risk profile investment. Further in the portfolio funds are
diversified towards mutual funds, bonds so that consistent return has been arrived over the period
of 10 years. Further it also compensated the risk associated with 50% of investment made in
equity.
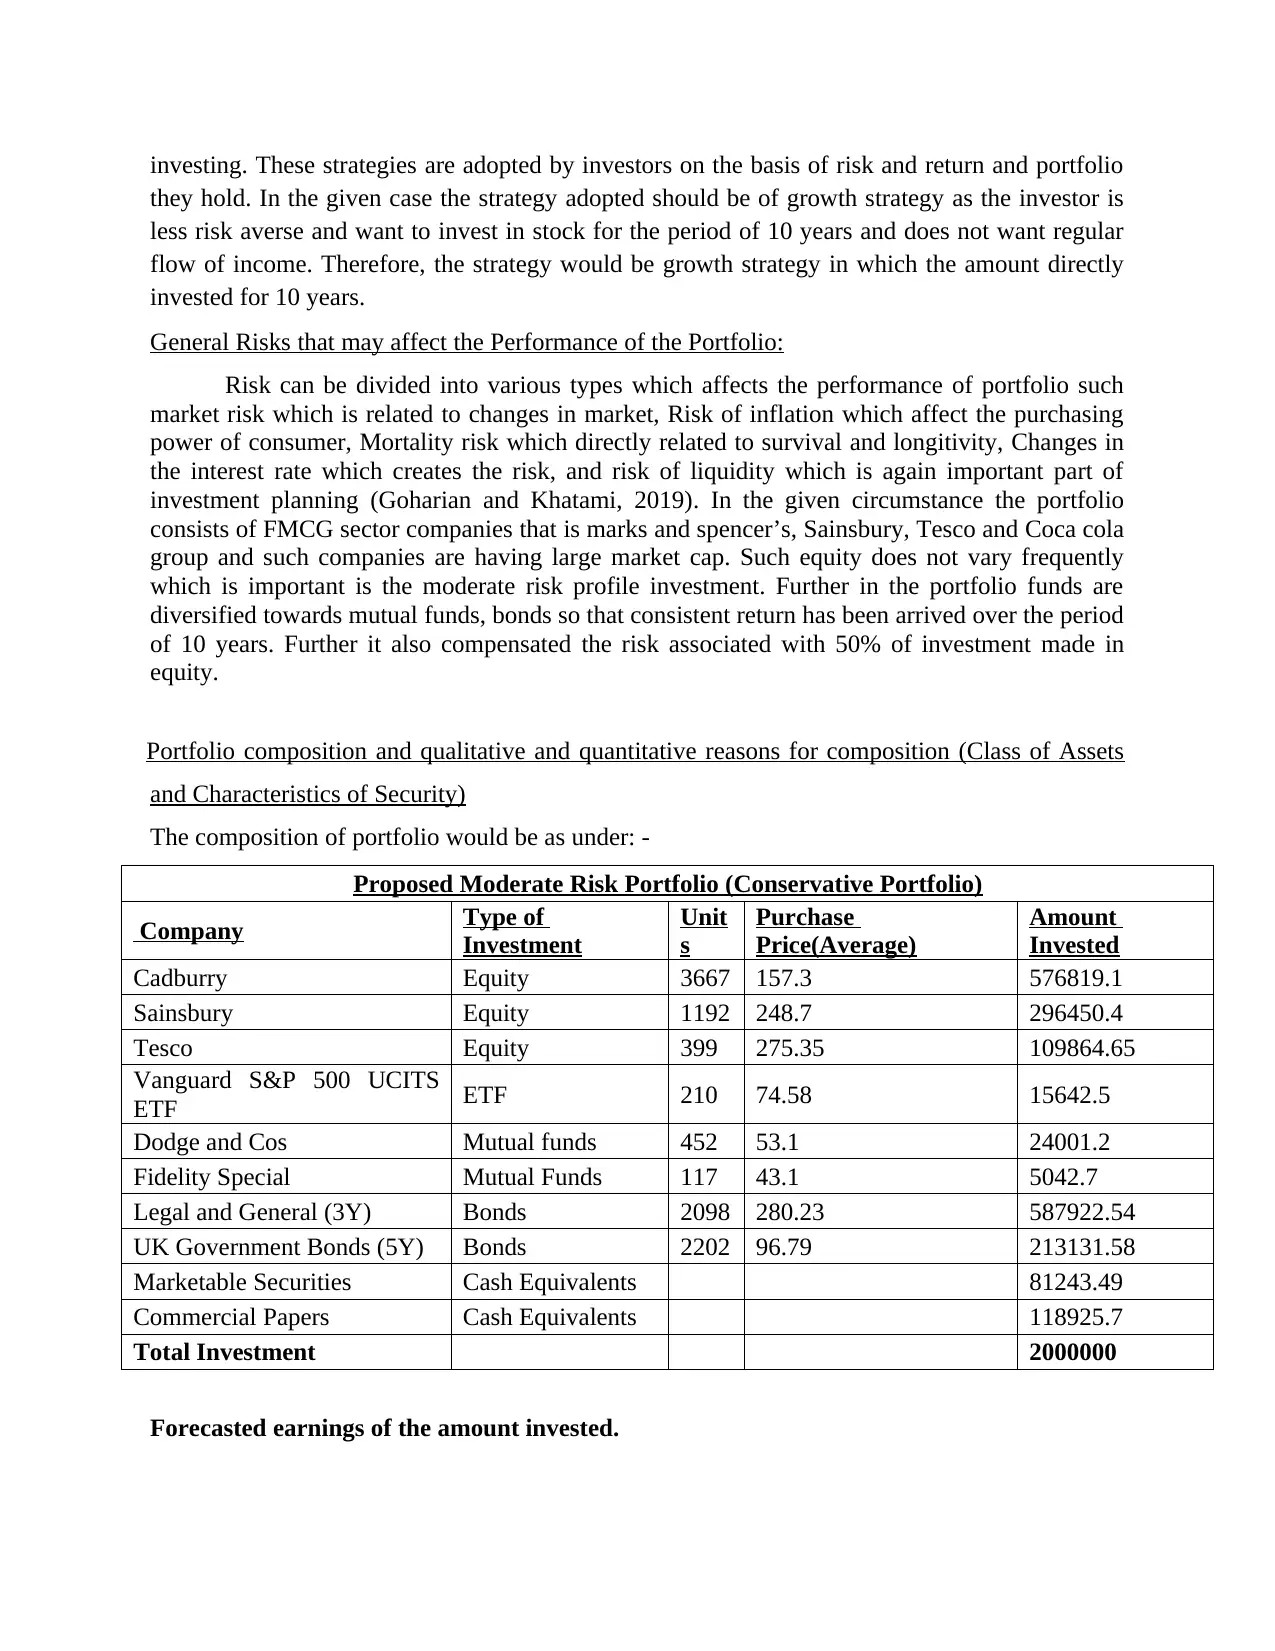
Portfolio composition and qualitative and quantitative reasons for composition (Class of Assets
and Characteristics of Security)
The composition of portfolio would be as under: -
Proposed Moderate Risk Portfolio (Conservative Portfolio)
Company Type of
Investment
Unit
s
Purchase
Price(Average)
Amount
Invested
Cadburry Equity 3667 157.3 576819.1
Sainsbury Equity 1192 248.7 296450.4
Tesco Equity 399 275.35 109864.65
Vanguard S&P 500 UCITS
ETF ETF 210 74.58 15642.5
Dodge and Cos Mutual funds 452 53.1 24001.2
Fidelity Special Mutual Funds 117 43.1 5042.7
Legal and General (3Y) Bonds 2098 280.23 587922.54
UK Government Bonds (5Y) Bonds 2202 96.79 213131.58
Marketable Securities Cash Equivalents 81243.49
Commercial Papers Cash Equivalents 118925.7
Total Investment 2000000
Forecasted earnings of the amount invested.
they hold. In the given case the strategy adopted should be of growth strategy as the investor is
less risk averse and want to invest in stock for the period of 10 years and does not want regular
flow of income. Therefore, the strategy would be growth strategy in which the amount directly
invested for 10 years.
General Risks that may affect the Performance of the Portfolio:
Risk can be divided into various types which affects the performance of portfolio such
market risk which is related to changes in market, Risk of inflation which affect the purchasing
power of consumer, Mortality risk which directly related to survival and longitivity, Changes in
the interest rate which creates the risk, and risk of liquidity which is again important part of
investment planning (Goharian and Khatami, 2019). In the given circumstance the portfolio
consists of FMCG sector companies that is marks and spencer’s, Sainsbury, Tesco and Coca cola
group and such companies are having large market cap. Such equity does not vary frequently
which is important is the moderate risk profile investment. Further in the portfolio funds are
diversified towards mutual funds, bonds so that consistent return has been arrived over the period
of 10 years. Further it also compensated the risk associated with 50% of investment made in
equity.
Portfolio composition and qualitative and quantitative reasons for composition (Class of Assets
and Characteristics of Security)
The composition of portfolio would be as under: -
Proposed Moderate Risk Portfolio (Conservative Portfolio)
Company Type of
Investment
Unit
s
Purchase
Price(Average)
Amount
Invested
Cadburry Equity 3667 157.3 576819.1
Sainsbury Equity 1192 248.7 296450.4
Tesco Equity 399 275.35 109864.65
Vanguard S&P 500 UCITS
ETF ETF 210 74.58 15642.5
Dodge and Cos Mutual funds 452 53.1 24001.2
Fidelity Special Mutual Funds 117 43.1 5042.7
Legal and General (3Y) Bonds 2098 280.23 587922.54
UK Government Bonds (5Y) Bonds 2202 96.79 213131.58
Marketable Securities Cash Equivalents 81243.49
Commercial Papers Cash Equivalents 118925.7
Total Investment 2000000
Forecasted earnings of the amount invested.
Paraphrase This Document
Need a fresh take? Get an instant paraphrase of this document with our AI Paraphraser
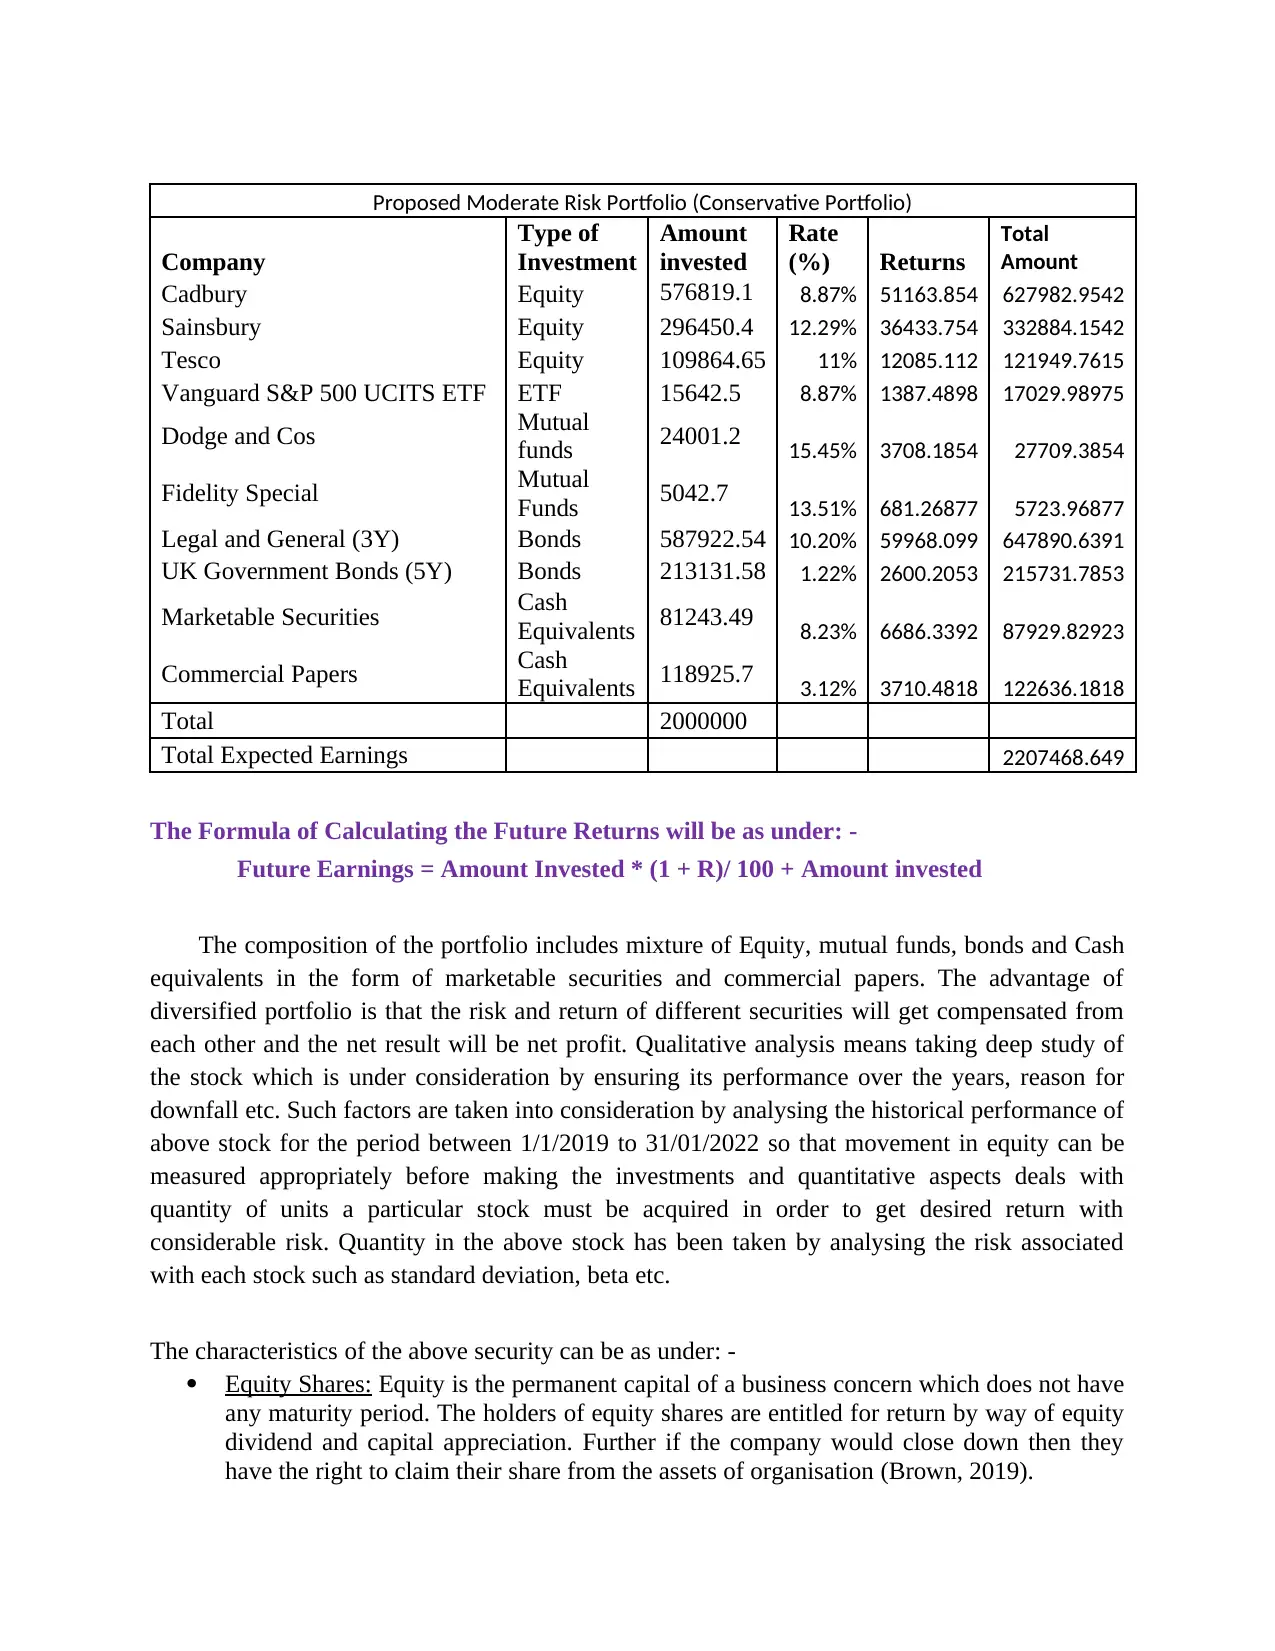
Proposed Moderate Risk Portfolio (Conservative Portfolio)
Company
Type of
Investment
Amount
invested
Rate
(%) Returns
Total
Amount
Cadbury Equity 576819.1 8.87% 51163.854 627982.9542
Sainsbury Equity 296450.4 12.29% 36433.754 332884.1542
Tesco Equity 109864.65 11% 12085.112 121949.7615
Vanguard S&P 500 UCITS ETF ETF 15642.5 8.87% 1387.4898 17029.98975
Dodge and Cos Mutual
funds 24001.2 15.45% 3708.1854 27709.3854
Fidelity Special Mutual
Funds 5042.7 13.51% 681.26877 5723.96877
Legal and General (3Y) Bonds 587922.54 10.20% 59968.099 647890.6391
UK Government Bonds (5Y) Bonds 213131.58 1.22% 2600.2053 215731.7853
Marketable Securities Cash
Equivalents 81243.49 8.23% 6686.3392 87929.82923
Commercial Papers Cash
Equivalents 118925.7 3.12% 3710.4818 122636.1818
Total 2000000
Total Expected Earnings 2207468.649
The Formula of Calculating the Future Returns will be as under: -
Future Earnings = Amount Invested * (1 + R)/ 100 + Amount invested
The composition of the portfolio includes mixture of Equity, mutual funds, bonds and Cash
equivalents in the form of marketable securities and commercial papers. The advantage of
diversified portfolio is that the risk and return of different securities will get compensated from
each other and the net result will be net profit. Qualitative analysis means taking deep study of
the stock which is under consideration by ensuring its performance over the years, reason for
downfall etc. Such factors are taken into consideration by analysing the historical performance of
above stock for the period between 1/1/2019 to 31/01/2022 so that movement in equity can be
measured appropriately before making the investments and quantitative aspects deals with
quantity of units a particular stock must be acquired in order to get desired return with
considerable risk. Quantity in the above stock has been taken by analysing the risk associated
with each stock such as standard deviation, beta etc.
The characteristics of the above security can be as under: -
Equity Shares: Equity is the permanent capital of a business concern which does not have
any maturity period. The holders of equity shares are entitled for return by way of equity
dividend and capital appreciation. Further if the company would close down then they
have the right to claim their share from the assets of organisation (Brown, 2019).
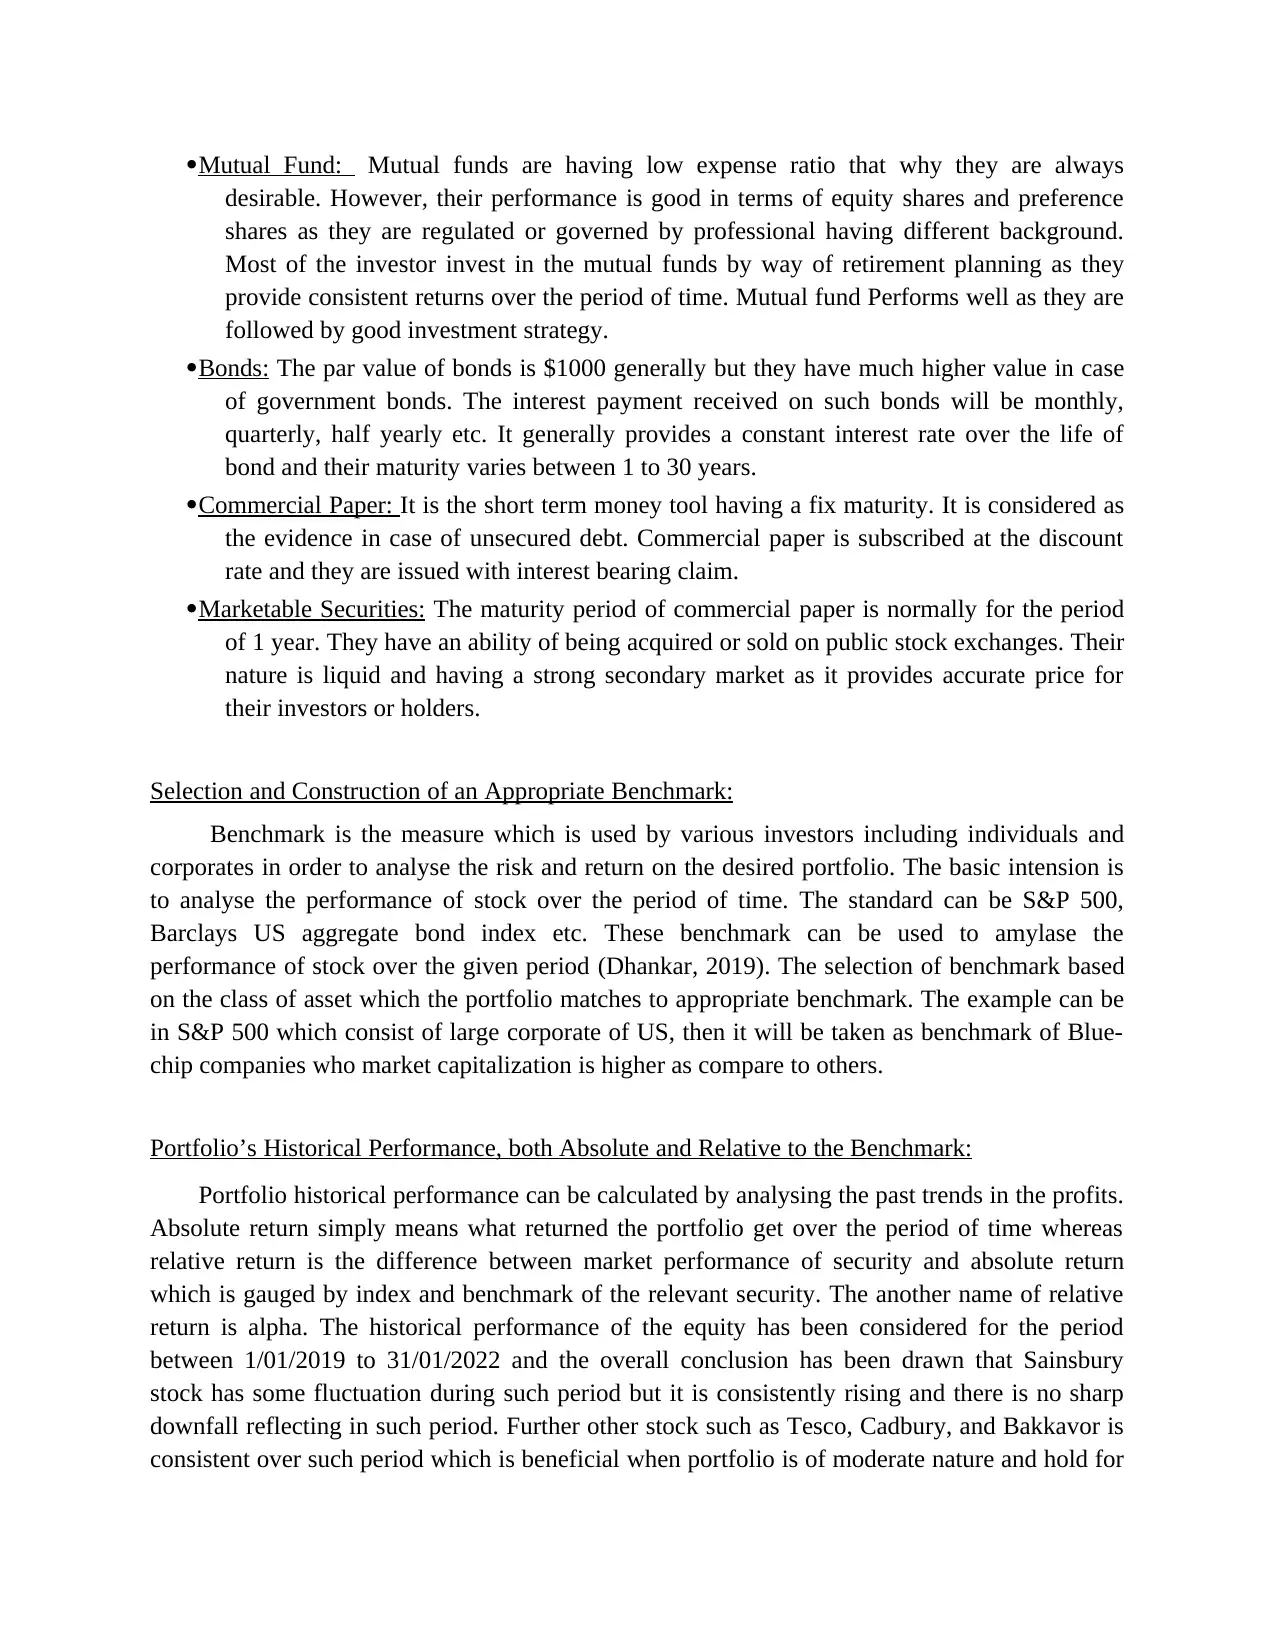
Mutual Fund: Mutual funds are having low expense ratio that why they are always
desirable. However, their performance is good in terms of equity shares and preference
shares as they are regulated or governed by professional having different background.
Most of the investor invest in the mutual funds by way of retirement planning as they
provide consistent returns over the period of time. Mutual fund Performs well as they are
followed by good investment strategy.
Bonds: The par value of bonds is $1000 generally but they have much higher value in case
of government bonds. The interest payment received on such bonds will be monthly,
quarterly, half yearly etc. It generally provides a constant interest rate over the life of
bond and their maturity varies between 1 to 30 years.
Commercial Paper: It is the short term money tool having a fix maturity. It is considered as
the evidence in case of unsecured debt. Commercial paper is subscribed at the discount
rate and they are issued with interest bearing claim.
Marketable Securities: The maturity period of commercial paper is normally for the period
of 1 year. They have an ability of being acquired or sold on public stock exchanges. Their
nature is liquid and having a strong secondary market as it provides accurate price for
their investors or holders.
Selection and Construction of an Appropriate Benchmark:
Benchmark is the measure which is used by various investors including individuals and
corporates in order to analyse the risk and return on the desired portfolio. The basic intension is
to analyse the performance of stock over the period of time. The standard can be S&P 500,
Barclays US aggregate bond index etc. These benchmark can be used to amylase the
performance of stock over the given period (Dhankar, 2019). The selection of benchmark based
on the class of asset which the portfolio matches to appropriate benchmark. The example can be
in S&P 500 which consist of large corporate of US, then it will be taken as benchmark of Blue-
chip companies who market capitalization is higher as compare to others.
Portfolio’s Historical Performance, both Absolute and Relative to the Benchmark:
Portfolio historical performance can be calculated by analysing the past trends in the profits.
Absolute return simply means what returned the portfolio get over the period of time whereas
relative return is the difference between market performance of security and absolute return
which is gauged by index and benchmark of the relevant security. The another name of relative
return is alpha. The historical performance of the equity has been considered for the period
between 1/01/2019 to 31/01/2022 and the overall conclusion has been drawn that Sainsbury
stock has some fluctuation during such period but it is consistently rising and there is no sharp
downfall reflecting in such period. Further other stock such as Tesco, Cadbury, and Bakkavor is
consistent over such period which is beneficial when portfolio is of moderate nature and hold for
⊘ This is a preview!⊘
Do you want full access?
Subscribe today to unlock all pages.
Trusted by 1+ million students worldwide
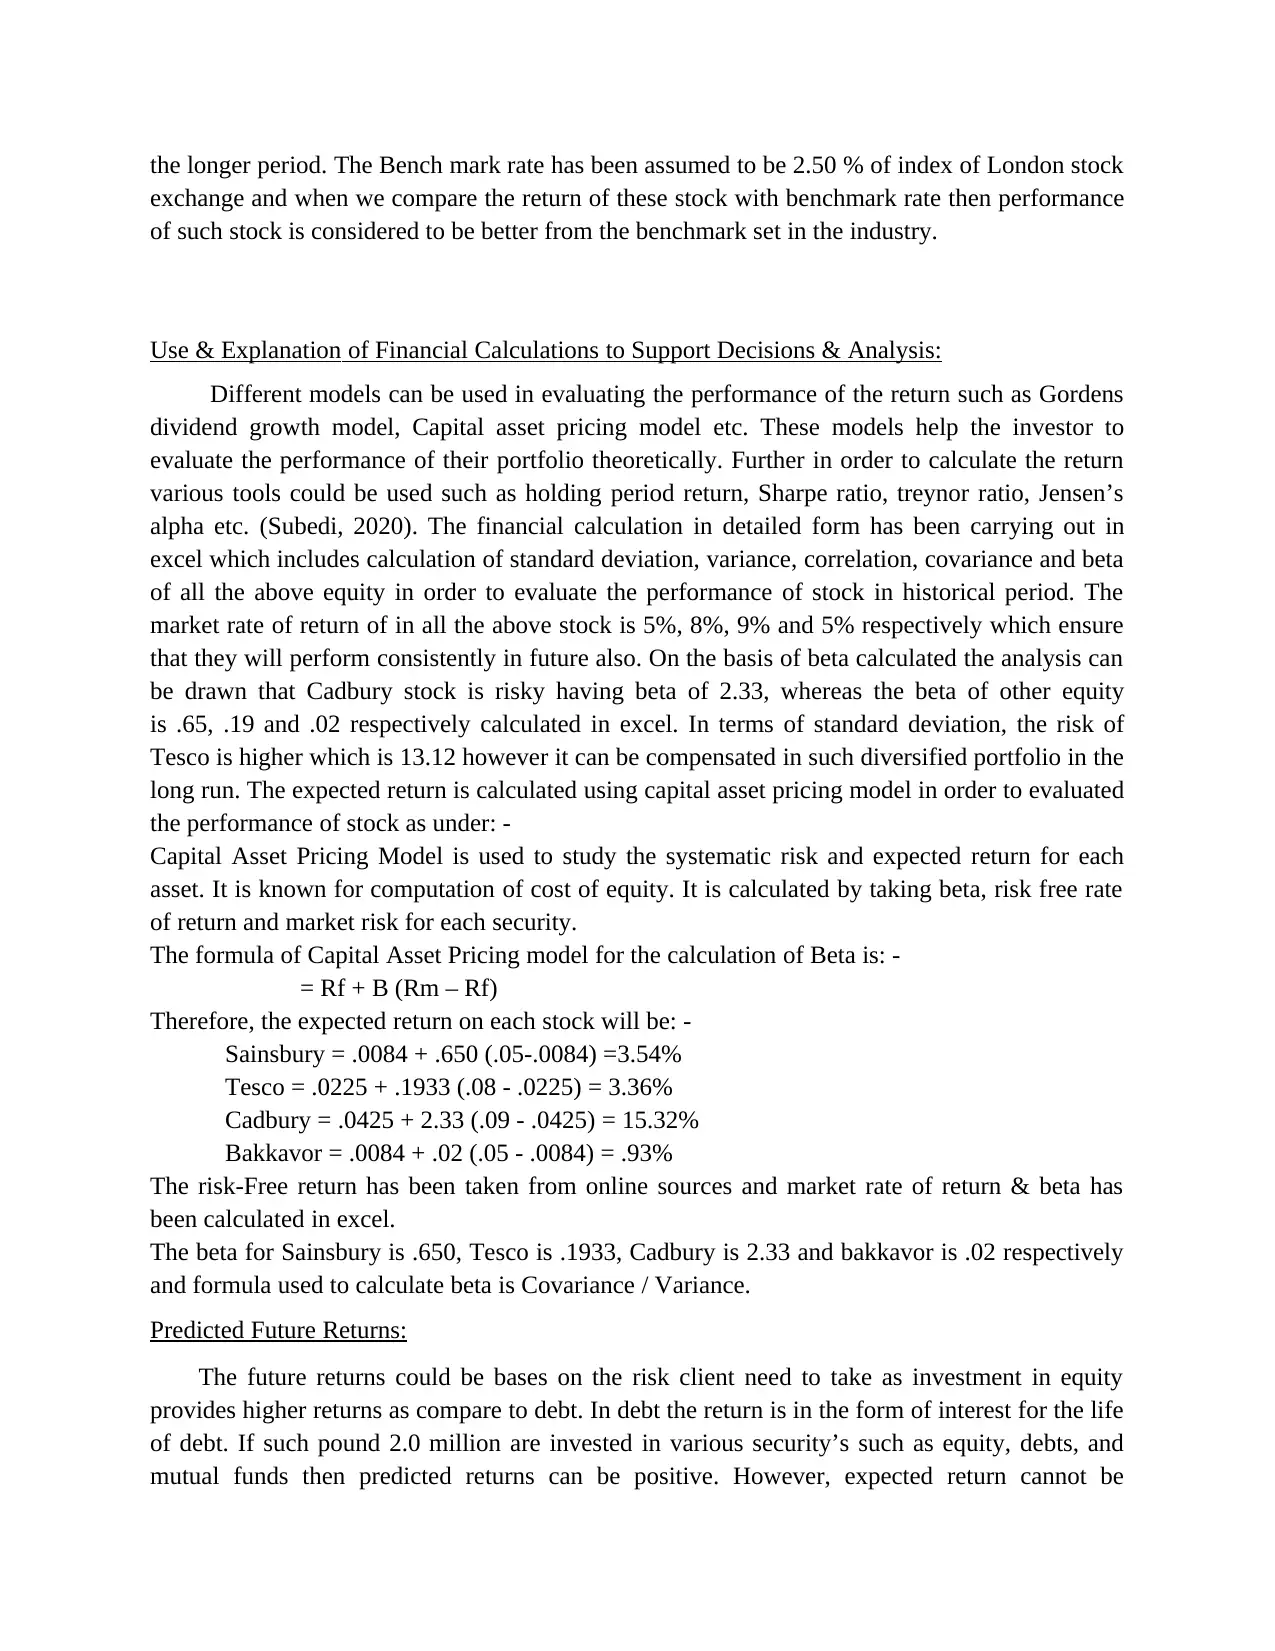
the longer period. The Bench mark rate has been assumed to be 2.50 % of index of London stock
exchange and when we compare the return of these stock with benchmark rate then performance
of such stock is considered to be better from the benchmark set in the industry.
Use & Explanation of Financial Calculations to Support Decisions & Analysis:
Different models can be used in evaluating the performance of the return such as Gordens
dividend growth model, Capital asset pricing model etc. These models help the investor to
evaluate the performance of their portfolio theoretically. Further in order to calculate the return
various tools could be used such as holding period return, Sharpe ratio, treynor ratio, Jensen’s
alpha etc. (Subedi, 2020). The financial calculation in detailed form has been carrying out in
excel which includes calculation of standard deviation, variance, correlation, covariance and beta
of all the above equity in order to evaluate the performance of stock in historical period. The
market rate of return of in all the above stock is 5%, 8%, 9% and 5% respectively which ensure
that they will perform consistently in future also. On the basis of beta calculated the analysis can
be drawn that Cadbury stock is risky having beta of 2.33, whereas the beta of other equity
is .65, .19 and .02 respectively calculated in excel. In terms of standard deviation, the risk of
Tesco is higher which is 13.12 however it can be compensated in such diversified portfolio in the
long run. The expected return is calculated using capital asset pricing model in order to evaluated
the performance of stock as under: -
Capital Asset Pricing Model is used to study the systematic risk and expected return for each
asset. It is known for computation of cost of equity. It is calculated by taking beta, risk free rate
of return and market risk for each security.
The formula of Capital Asset Pricing model for the calculation of Beta is: -
= Rf + B (Rm – Rf)
Therefore, the expected return on each stock will be: -
Sainsbury = .0084 + .650 (.05-.0084) =3.54%
Tesco = .0225 + .1933 (.08 - .0225) = 3.36%
Cadbury = .0425 + 2.33 (.09 - .0425) = 15.32%
Bakkavor = .0084 + .02 (.05 - .0084) = .93%
The risk-Free return has been taken from online sources and market rate of return & beta has
been calculated in excel.
The beta for Sainsbury is .650, Tesco is .1933, Cadbury is 2.33 and bakkavor is .02 respectively
and formula used to calculate beta is Covariance / Variance.
Predicted Future Returns:
The future returns could be bases on the risk client need to take as investment in equity
provides higher returns as compare to debt. In debt the return is in the form of interest for the life
of debt. If such pound 2.0 million are invested in various security’s such as equity, debts, and
mutual funds then predicted returns can be positive. However, expected return cannot be
Paraphrase This Document
Need a fresh take? Get an instant paraphrase of this document with our AI Paraphraser
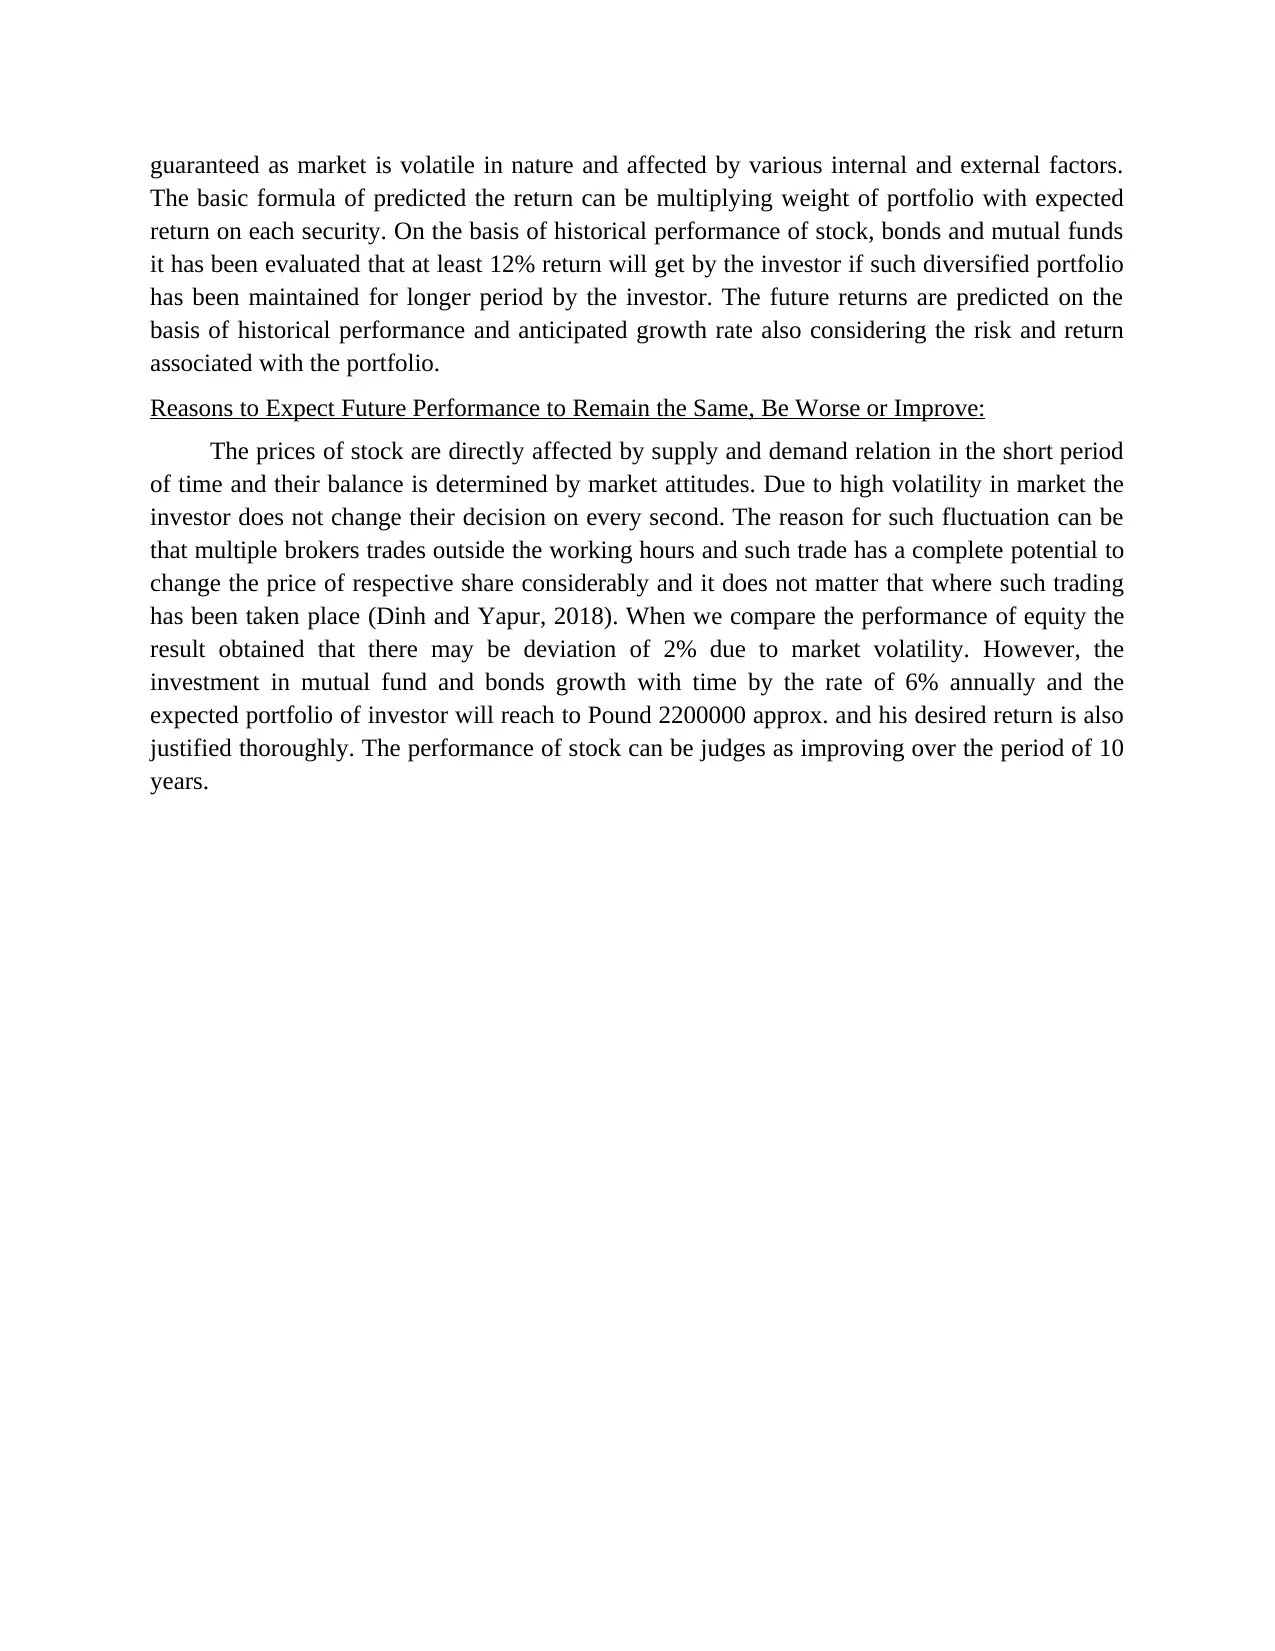
guaranteed as market is volatile in nature and affected by various internal and external factors.
The basic formula of predicted the return can be multiplying weight of portfolio with expected
return on each security. On the basis of historical performance of stock, bonds and mutual funds
it has been evaluated that at least 12% return will get by the investor if such diversified portfolio
has been maintained for longer period by the investor. The future returns are predicted on the
basis of historical performance and anticipated growth rate also considering the risk and return
associated with the portfolio.
Reasons to Expect Future Performance to Remain the Same, Be Worse or Improve:
The prices of stock are directly affected by supply and demand relation in the short period
of time and their balance is determined by market attitudes. Due to high volatility in market the
investor does not change their decision on every second. The reason for such fluctuation can be
that multiple brokers trades outside the working hours and such trade has a complete potential to
change the price of respective share considerably and it does not matter that where such trading
has been taken place (Dinh and Yapur, 2018). When we compare the performance of equity the
result obtained that there may be deviation of 2% due to market volatility. However, the
investment in mutual fund and bonds growth with time by the rate of 6% annually and the
expected portfolio of investor will reach to Pound 2200000 approx. and his desired return is also
justified thoroughly. The performance of stock can be judges as improving over the period of 10
years.
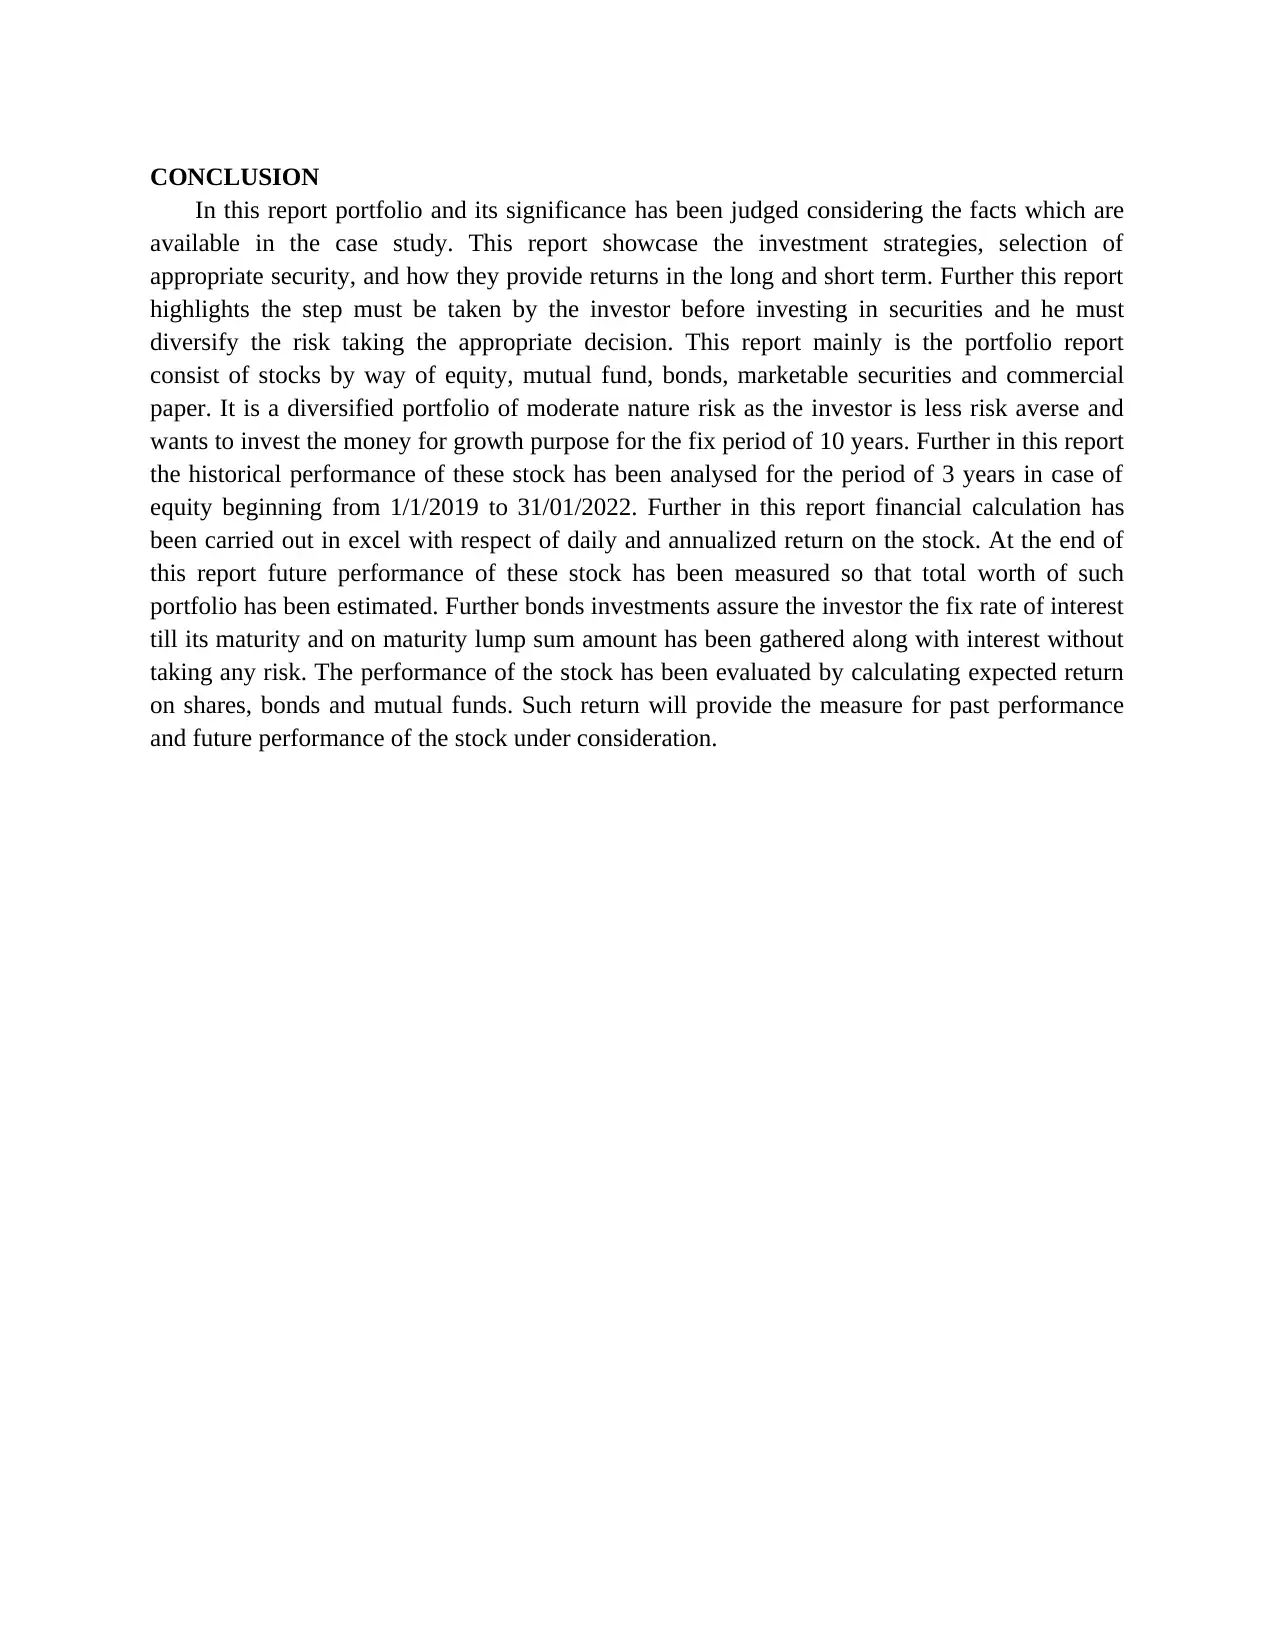
CONCLUSION
In this report portfolio and its significance has been judged considering the facts which are
available in the case study. This report showcase the investment strategies, selection of
appropriate security, and how they provide returns in the long and short term. Further this report
highlights the step must be taken by the investor before investing in securities and he must
diversify the risk taking the appropriate decision. This report mainly is the portfolio report
consist of stocks by way of equity, mutual fund, bonds, marketable securities and commercial
paper. It is a diversified portfolio of moderate nature risk as the investor is less risk averse and
wants to invest the money for growth purpose for the fix period of 10 years. Further in this report
the historical performance of these stock has been analysed for the period of 3 years in case of
equity beginning from 1/1/2019 to 31/01/2022. Further in this report financial calculation has
been carried out in excel with respect of daily and annualized return on the stock. At the end of
this report future performance of these stock has been measured so that total worth of such
portfolio has been estimated. Further bonds investments assure the investor the fix rate of interest
till its maturity and on maturity lump sum amount has been gathered along with interest without
taking any risk. The performance of the stock has been evaluated by calculating expected return
on shares, bonds and mutual funds. Such return will provide the measure for past performance
and future performance of the stock under consideration.
⊘ This is a preview!⊘
Do you want full access?
Subscribe today to unlock all pages.
Trusted by 1+ million students worldwide
REFERENCES
Books and Journals
Bektic, D., 2018. Factor-based Portfolio Management with Corporate Bonds (No. 95014).
Darmstadt Technical University, Department of Business Administration, Economics
and Law, Institute for Business Studies (BWL).
Clermont, D., 2020. Advanced Quantitative Equity Portfolio Management System. Available at
SSRN 3535271.
Dhankar, R.S., 2019. Multifactors Model and Portfolio Management. In Risk-Return
Relationship and Portfolio Management (pp. 113-129). Springer, New Delhi.
Dinh, T.V. and Yapur, M., 2018, October. Evolution of national oceanic and atmospheric
administration’s (NOAA) observing system portfolio management capabilities.
In OCEANS 2018 MTS/IEEE Charleston (pp. 1-5). IEEE.
Subedi, S., 2020. Portfolio Management of Nepalese Commercial Banks (Doctoral dissertation,
Department of Management).
Goharian, E. and Khatami, F., 2019, December. Renewable Myths and Non-Renewable Realities
about Energy Portfolio Management. In AGU Fall Meeting Abstracts (Vol. 2019. pp.
GC43H-1408).
Brown, S., 2019. Uber or Lyft? or another sector altogether? -portfolio
management. Finweek, 2019(10). pp.16-16.
Iyer, A. and Sairam, S., 2020. Ranking of portfolio management services and alternative
investment funds under PMS AIF world.
Mak, M.A., 2018. Coast Guard: Improved Acquisition Portfolio Management Could Help
Address Aging Assets and Capability Gaps (No. GAO-18-629T).
Landini, P., 2018. Demand Response: A model for the portfolio management of Enel X
clients (Doctoral dissertation).
NATEGH, G.A., Damghani, E. and SABAHI, A., 2019. The Impact of Investor’s Perception of
Risk on Portfolio Management (Case Study: Active Investor’s Mashhad Stock brokers).
Simonian, J., 2019. Portfolio Selection: A Game-Theoretic Approach. The Journal of Portfolio
Management. 45(6). pp.108-116.
Moustafaev, J., 2019. Performance: A combined project and portfolio perspective. In The
Practitioner’s Handbook of Project Performance (pp. 81-99). Routledge.
Horlebein, M., 2018. Portfolio-level change management. In The Handbook of Project Portfolio
Management (pp. 334-342). Routledge.
Kalotay, A., 2022. Option-Enhanced Tax-Smart Portfolio Value. The Journal of Portfolio
Management.
Maeso, J.M. and Martellini, L., 2020. Measuring portfolio rebalancing benefits in equity
markets. The Journal of Portfolio Management. 46(4). pp.94-109.
Yashchenko, E.A., 2018. Management of Bank Investment Portfolio. Business Strategies.
Paraphrase This Document
Need a fresh take? Get an instant paraphrase of this document with our AI Paraphraser

1 out of 11
Related Documents


Your All-in-One AI-Powered Toolkit for Academic Success.
+13062052269
info@desklib.com
Available 24*7 on WhatsApp / Email
![[object Object]](/_next/static/media/star-bottom.7253800d.svg)
Unlock your academic potential
Copyright © 2020–2026 A2Z Services. All Rights Reserved. Developed and managed by ZUCOL.