MSL925003: Uncertainty Measurement in Bitumen Extraction Analysis
VerifiedAdded on 2022/08/23
|37
|7133
|13
Practical Assignment
AI Summary
This practical assignment, MSL925003, assesses the student's ability to determine and quantify uncertainty in asphalt testing procedures. The assignment focuses on two primary tasks: calculating the uncertainty in finding the percentage of bitumen in an asphalt sample using the bitumen extraction method, and determining the uncertainty associated with Marshall density and air voids in an asphalt sample. The student is guided through the ISO GUM method, requiring them to identify sources of uncertainty, quantify these uncertainties using provided data from calibration certificates and product specifications, and calculate both combined standard uncertainty and expanded uncertainty. The tasks involve detailed calculations and the application of statistical methods to evaluate the precision of measurements. The student must describe the measurand, identify uncertainty sources, quantify uncertainties, calculate combined standard uncertainty, calculate expanded uncertainty, and report the uncertainty findings. Workplace evidence can be submitted, and knowledge questions must be answered. The assignment emphasizes the importance of accurate measurements and the quantification of error in materials testing, crucial for quality control and assurance in civil engineering applications.
Complete
Assessment
MSL925003 Determine measurements of uncertainty
Name of Student: ___________________________________________________
Workplace: ___________________________________________________
Assessment
MSL925003 Determine measurements of uncertainty
Name of Student: ___________________________________________________
Workplace: ___________________________________________________
Paraphrase This Document
Need a fresh take? Get an instant paraphrase of this document with our AI Paraphraser
MSL925003 Determine measurements of uncertainty
Important Information for the Student
1. This document contains two (2) assessment methods used to determine competency
for the unit. They include practical tasks and knowledge questions.
2. Some practical tasks do not need to be completed if sufficient workplace evidence
is submitted that covers the required performance evidence. Check with your
assessor if you believe you have relevant evidence.
3. To achieve a satisfactory result in this assessment, all parts of this document must
be filled in by either answering the question, performing the task or providing
workplace evidence.
4. If workplace evidence is submitted, the assessment sections must still be filled in
with references made to the evidence collected. Name and number the evidence
document for tracking.
5. Knowledge questions must always be completed and cannot be replaced with
workplace evidence.
6. If completing on hardcopy, you must use black pen only. Whiteout, pencils or other
coloured pens are not acceptable.
7. A degree of independent research utilising current and reliable sources may also be
required to complete the assessment.
8. Please ensure you keep a copy of your assessment for you own records. If your
assessment is lost, it is your responsibility to provide a copy or reproduce your
work as required to demonstrate satisfactory practical knowledge.
9. The outcome of each practical task or knowledge question is either Satisfactory (S)
or Not Yet Satisfactory (NYS).
10. You will be given three (3) attempts to complete each practical task and knowledge
question. This means if you are deemed NYS on your first attempt, you will be
given the opportunity to resubmit the answer or perform the task twice more only.
11. Please note that this is an ‘open book’ assessment. The Study Guide for this unit
may be used to assist you.
12. You are required to sign at the completion of each assessment method.
Assessment:
The practical tasks for this unit comprise a combination of assessment tasks including:
Determine the uncertainty in finding the percentage bitumen in asphalt via a
bitumen extraction
Complete Assessment v1.0 March 2020 Page 2
MSL925003 Determine measurements of uncertainty
Determine the uncertainty in finding the Marshall Density and air voids in an
asphalt sample
Determine uncertainty of linearity
Determine uncertainty of percentage void filled bitumen of an asphalt sample
Complete Assessment v1.0 March 2020 Page 3
Determine the uncertainty in finding the Marshall Density and air voids in an
asphalt sample
Determine uncertainty of linearity
Determine uncertainty of percentage void filled bitumen of an asphalt sample
Complete Assessment v1.0 March 2020 Page 3
⊘ This is a preview!⊘
Do you want full access?
Subscribe today to unlock all pages.
Trusted by 1+ million students worldwide
MSL925003 Determine measurements of uncertainty
Practical Assessment
Important Information for the Student
If you believe you have completed a similar task in your workplace you have the option to
submit the workplace evidence to your assessor for consideration. Please speak to your
assessor for further information.
Practical Task 1: Determine the uncertainty in finding the percentage bitumen in asphalt
via a bitumen extraction
Description:
Read the following test data to calculate the uncertainty as per the ISO GUM method.
Test data:
1296.62 g of an asphalt sample is analysed for bitumen content by carrying out a bitumen
extraction according to standard test methods, with all drying carried out at 105°C.
Lab temperature on the day of preparation of solution is noted as 24°C.
The following documents are provided to you:
CPA1 – Test sheet – Bitumen extraction - BE5003-1
CPA2 – Product description – Measuring cylinder 2 L
CPA3 – Calibration certificate – Analytical balance – AB5003-1
CPA4 – Product description – Measuring cylinder 100 mL
CPA5 – Product specification – Oven – TO5003-1
Instructions:
Follow the six (6) steps to calculate and report the combined standard uncertainty and expanded
uncertainty.
Show your calculations below.
Step 1: Describe the measurand
The main aim of this process is to establish the percentage of bitumen in 1296.62g of asphalt
sample. The percentage bitumen is determined by the bitumen extraction method.
Lab temperature during this experiment was 24 oC.
Drying in this experiment was carried out at a temperature of 105 oC.
Apparatus
Extraction apparatus
Analytical balance
Suitable solvent
Filter rings
Centrifuge
Complete Assessment v1.0 March 2020 Page 4
Paraphrase This Document
Need a fresh take? Get an instant paraphrase of this document with our AI Paraphraser

MSL925003 Determine measurements of uncertainty
Centrifuge tubes
Measuring cylinders
Oven
Procedure;
Using the analytical balance accurately weigh 1296.62 g of the asphalt sample (m1).
Dry the (m1) at a controlled temperature of 105oC to obtain a constant mass of 1226.69 g (m2)
Mass of the filter ring was 19.87 g(m3)
Mass after extraction was 1226.69 g (m4)
Weights recorded by analytical balance are to the nearest 0.01g.
Mass of the filter ring and residue measured was found to be 20.49 g (m5)
Mass of residue (on filter ring) (m6) = (m5-m3) = 0.62 g
Total mass of the centrifuge tubes (m7) = 179.02 g
Mass of residue and tubes (m8) = 179.56 g
Total mass of residue in tubes(m9) = (179.56-179.02) g = 0.54 g
Total volume of solvent was 1460ml
Volume of aliquot was 81ml
Mass of fines in fluid (m10) = (m9*(1460/81)) = 9.73 g
Total mineral matter(m11) (m2+m6+m10) = 1236.97 g
Weight of bitumen(m12) (m1-m11) g = 59.65 g
% bitumen (m12/m1) = 4.6%
Step 2: Identify sources of uncertainty
Step 3: Quantify uncertainty
Balance: The bitumen determination begins with weighing the asphalt sample using the
analytical balance.
Complete Assessment v1.0 March 2020 Page 5
solvent
Standard
flask
Weighing
balance
repeatability
Sensitivity
% bitumen in asphalt
sample
calibration
Oven
calibration temperature
Control
accuracy
MSL925003 Determine measurements of uncertainty
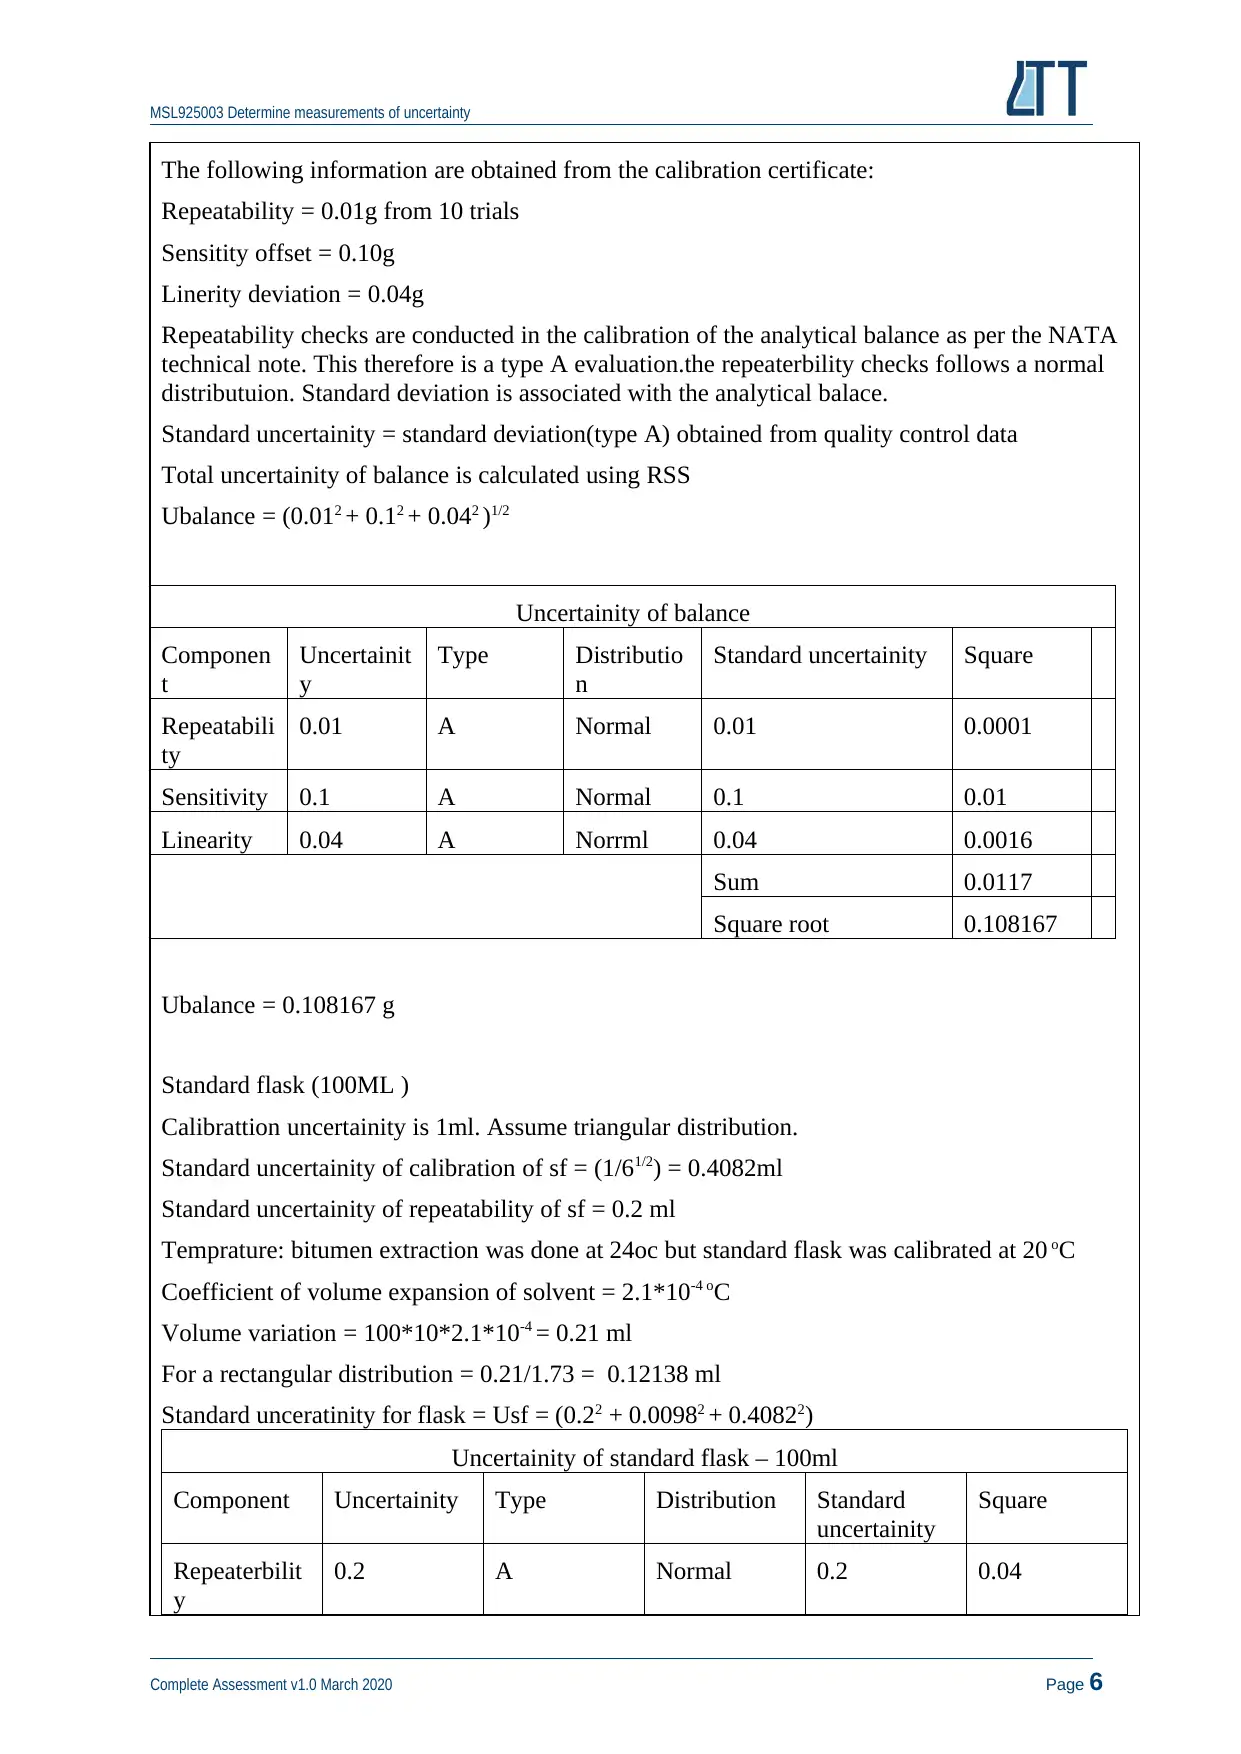
The following information are obtained from the calibration certificate:
Repeatability = 0.01g from 10 trials
Sensitity offset = 0.10g
Linerity deviation = 0.04g
Repeatability checks are conducted in the calibration of the analytical balance as per the NATA
technical note. This therefore is a type A evaluation.the repeaterbility checks follows a normal
distributuion. Standard deviation is associated with the analytical balace.
Standard uncertainity = standard deviation(type A) obtained from quality control data
Total uncertainity of balance is calculated using RSS
Ubalance = (0.012 + 0.12 + 0.042 )1/2
Ubalance = 0.108167 g
Standard flask (100ML )
Calibrattion uncertainity is 1ml. Assume triangular distribution.
Standard uncertainity of calibration of sf = (1/61/2) = 0.4082ml
Standard uncertainity of repeatability of sf = 0.2 ml
Temprature: bitumen extraction was done at 24oc but standard flask was calibrated at 20 oC
Coefficient of volume expansion of solvent = 2.1*10-4 oC
Volume variation = 100*10*2.1*10-4 = 0.21 ml
For a rectangular distribution = 0.21/1.73 = 0.12138 ml
Standard unceratinity for flask = Usf = (0.22 + 0.00982 + 0.40822)
Uncertainity of standard flask – 100ml
Component Uncertainity Type Distribution Standard
uncertainity
Square
Repeaterbilit
y
0.2 A Normal 0.2 0.04
Complete Assessment v1.0 March 2020 Page 6
Uncertainity of balance
Componen
t
Uncertainit
y
Type Distributio
n
Standard uncertainity Square
Repeatabili
ty
0.01 A Normal 0.01 0.0001
Sensitivity 0.1 A Normal 0.1 0.01
Linearity 0.04 A Norrml 0.04 0.0016
Sum 0.0117
Square root 0.108167
⊘ This is a preview!⊘
Do you want full access?
Subscribe today to unlock all pages.
Trusted by 1+ million students worldwide
MSL925003 Determine measurements of uncertainty
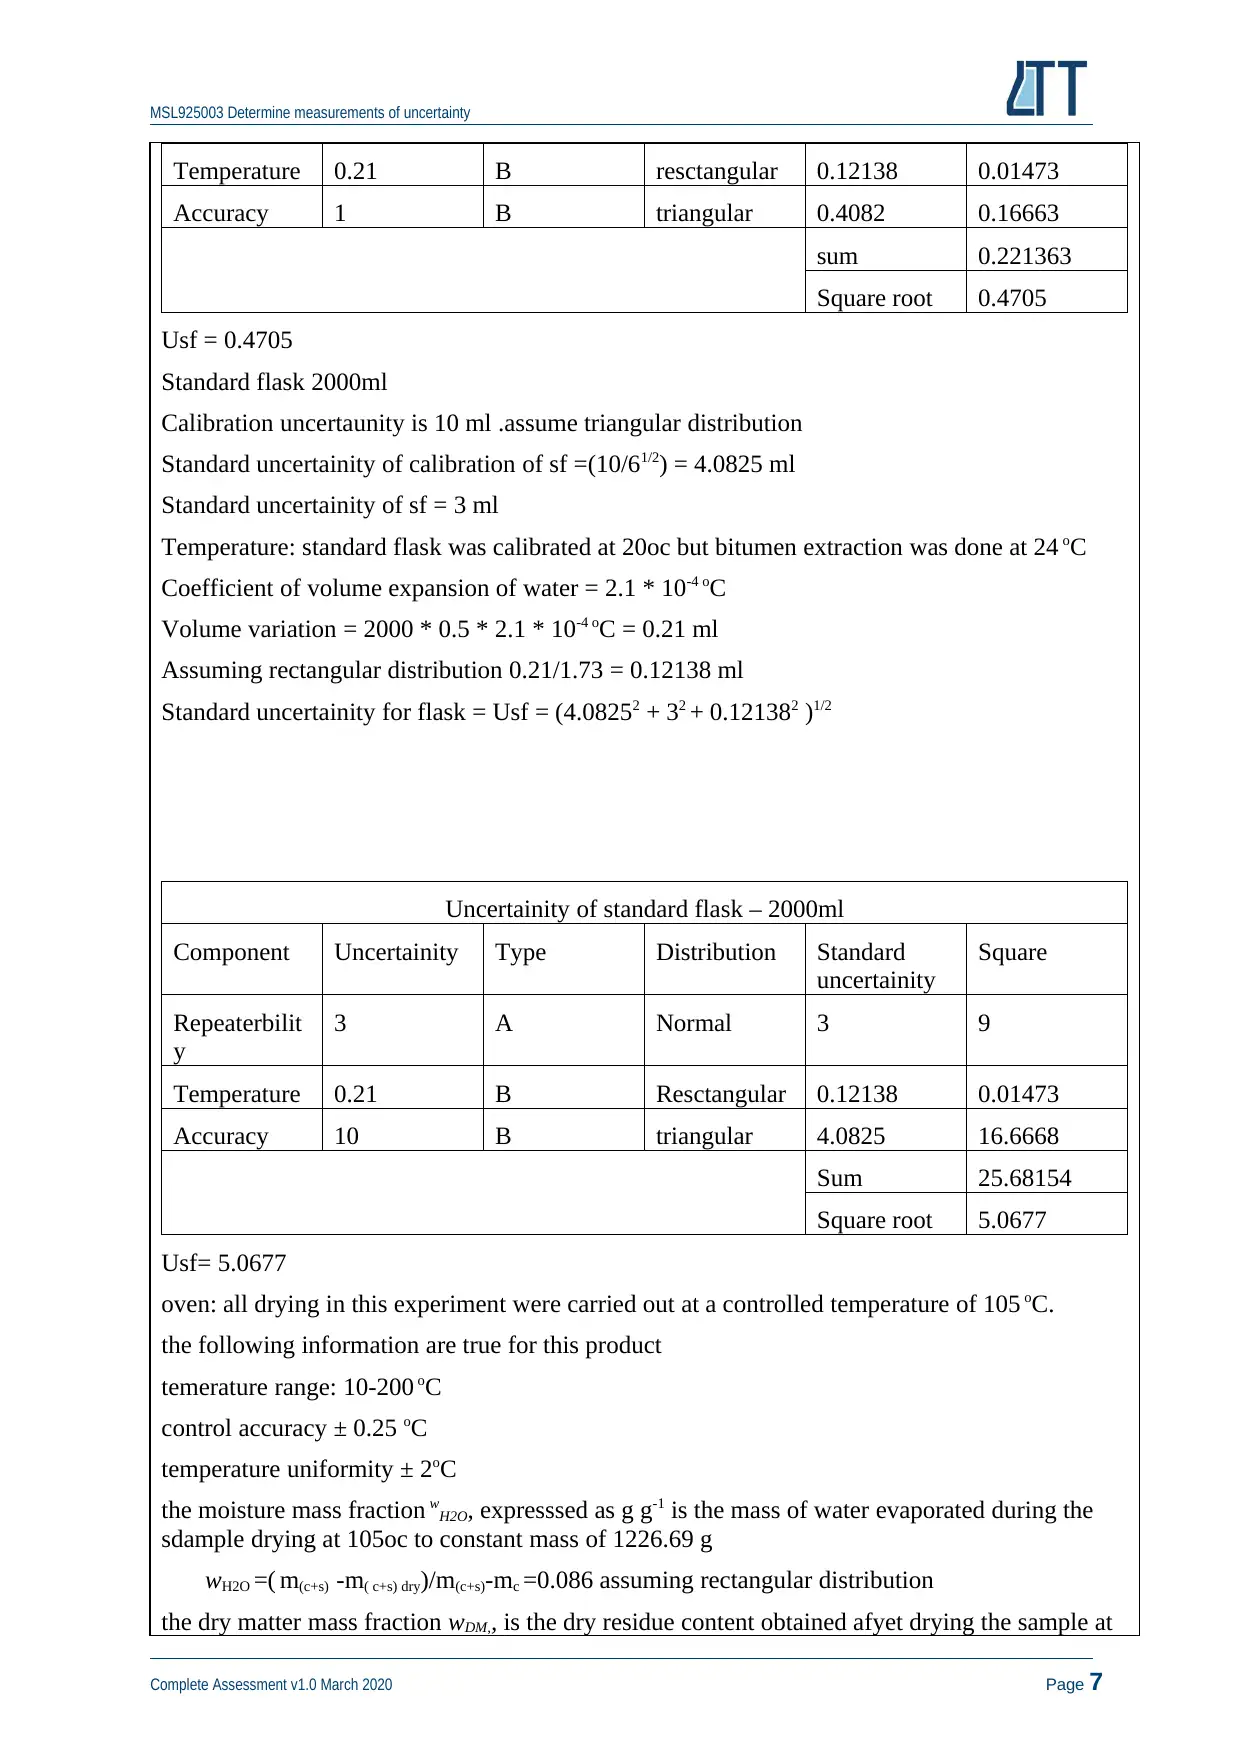
Temperature 0.21 B resctangular 0.12138 0.01473
Accuracy 1 B triangular 0.4082 0.16663
sum 0.221363
Square root 0.4705
Usf = 0.4705
Standard flask 2000ml
Calibration uncertaunity is 10 ml .assume triangular distribution
Standard uncertainity of calibration of sf =(10/61/2) = 4.0825 ml
Standard uncertainity of sf = 3 ml
Temperature: standard flask was calibrated at 20oc but bitumen extraction was done at 24 oC
Coefficient of volume expansion of water = 2.1 * 10-4 oC
Volume variation = 2000 * 0.5 * 2.1 * 10-4 oC = 0.21 ml
Assuming rectangular distribution 0.21/1.73 = 0.12138 ml
Standard uncertainity for flask = Usf = (4.08252 + 32 + 0.121382 )1/2
Uncertainity of standard flask – 2000ml
Component Uncertainity Type Distribution Standard
uncertainity
Square
Repeaterbilit
y
3 A Normal 3 9
Temperature 0.21 B Resctangular 0.12138 0.01473
Accuracy 10 B triangular 4.0825 16.6668
Sum 25.68154
Square root 5.0677
Usf= 5.0677
oven: all drying in this experiment were carried out at a controlled temperature of 105 oC.
the following information are true for this product
temerature range: 10-200 oC
control accuracy ± 0.25 oC
temperature uniformity ± 2oC
the moisture mass fraction wH2O, expresssed as g g-1 is the mass of water evaporated during the
sdample drying at 105oc to constant mass of 1226.69 g
wH2O =( m(c+s) -m( c+s) dry)/m(c+s)-mc =0.086 assuming rectangular distribution
the dry matter mass fraction wDM,, is the dry residue content obtained afyet drying the sample at
Complete Assessment v1.0 March 2020 Page 7
Paraphrase This Document
Need a fresh take? Get an instant paraphrase of this document with our AI Paraphraser
MSL925003 Determine measurements of uncertainty
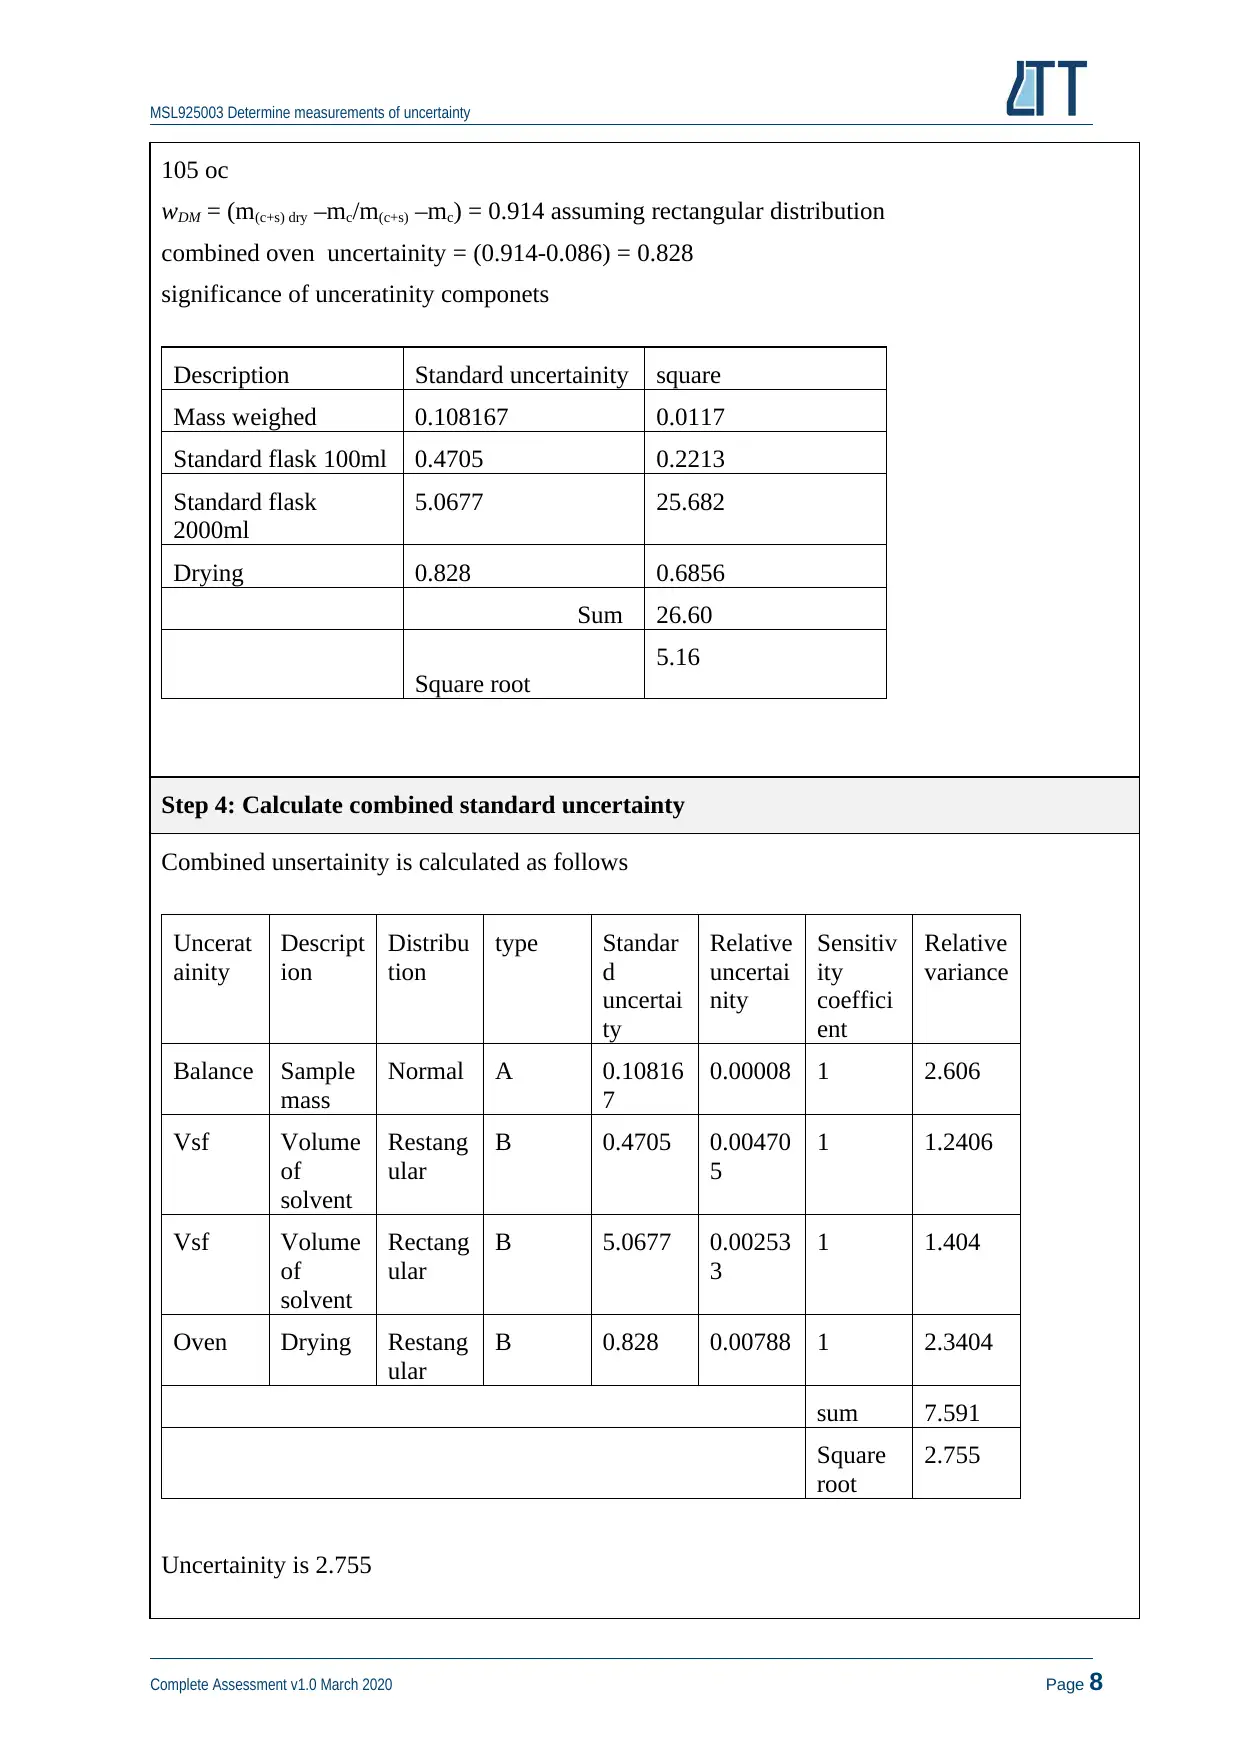
105 oc
wDM = (m(c+s) dry –mc/m(c+s) –mc) = 0.914 assuming rectangular distribution
combined oven uncertainity = (0.914-0.086) = 0.828
significance of unceratinity componets
Description Standard uncertainity square
Mass weighed 0.108167 0.0117
Standard flask 100ml 0.4705 0.2213
Standard flask
2000ml
5.0677 25.682
Drying 0.828 0.6856
Sum 26.60
Square root
5.16
Step 4: Calculate combined standard uncertainty
Combined unsertainity is calculated as follows
Uncerat
ainity
Descript
ion
Distribu
tion
type Standar
d
uncertai
ty
Relative
uncertai
nity
Sensitiv
ity
coeffici
ent
Relative
variance
Balance Sample
mass
Normal A 0.10816
7
0.00008 1 2.606
Vsf Volume
of
solvent
Restang
ular
B 0.4705 0.00470
5
1 1.2406
Vsf Volume
of
solvent
Rectang
ular
B 5.0677 0.00253
3
1 1.404
Oven Drying Restang
ular
B 0.828 0.00788 1 2.3404
sum 7.591
Square
root
2.755
Uncertainity is 2.755
Complete Assessment v1.0 March 2020 Page 8
MSL925003 Determine measurements of uncertainty
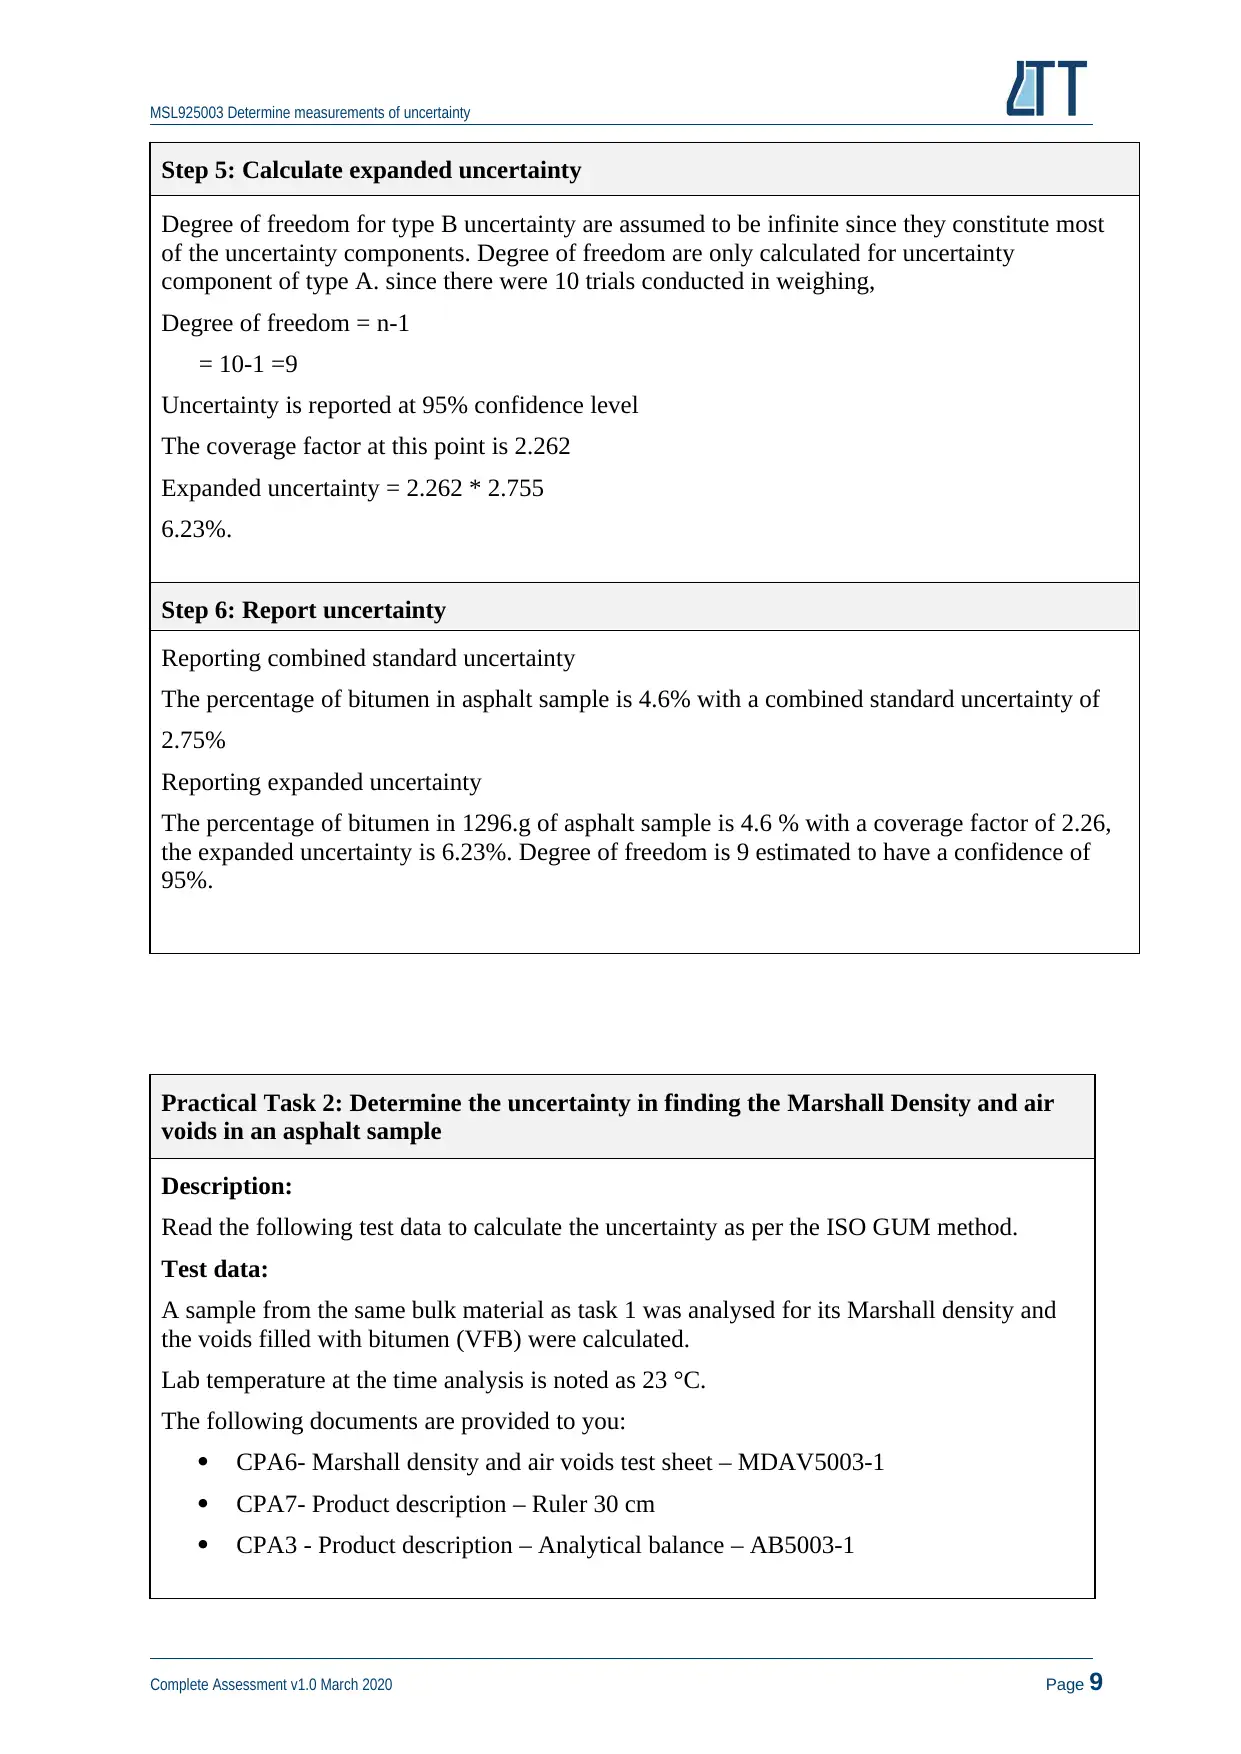
Step 5: Calculate expanded uncertainty
Degree of freedom for type B uncertainty are assumed to be infinite since they constitute most
of the uncertainty components. Degree of freedom are only calculated for uncertainty
component of type A. since there were 10 trials conducted in weighing,
Degree of freedom = n-1
= 10-1 =9
Uncertainty is reported at 95% confidence level
The coverage factor at this point is 2.262
Expanded uncertainty = 2.262 * 2.755
6.23%.
Step 6: Report uncertainty
Reporting combined standard uncertainty
The percentage of bitumen in asphalt sample is 4.6% with a combined standard uncertainty of
2.75%
Reporting expanded uncertainty
The percentage of bitumen in 1296.g of asphalt sample is 4.6 % with a coverage factor of 2.26,
the expanded uncertainty is 6.23%. Degree of freedom is 9 estimated to have a confidence of
95%.
Practical Task 2: Determine the uncertainty in finding the Marshall Density and air
voids in an asphalt sample
Description:
Read the following test data to calculate the uncertainty as per the ISO GUM method.
Test data:
A sample from the same bulk material as task 1 was analysed for its Marshall density and
the voids filled with bitumen (VFB) were calculated.
Lab temperature at the time analysis is noted as 23 °C.
The following documents are provided to you:
CPA6- Marshall density and air voids test sheet – MDAV5003-1
CPA7- Product description – Ruler 30 cm
CPA3 - Product description – Analytical balance – AB5003-1
Complete Assessment v1.0 March 2020 Page 9
⊘ This is a preview!⊘
Do you want full access?
Subscribe today to unlock all pages.
Trusted by 1+ million students worldwide
MSL925003 Determine measurements of uncertainty
Instructions:
Follow the six (6) steps as per the ISO GUM method to calculate and report the combined
standard uncertainty and expanded uncertainty.
Show your calculations below.
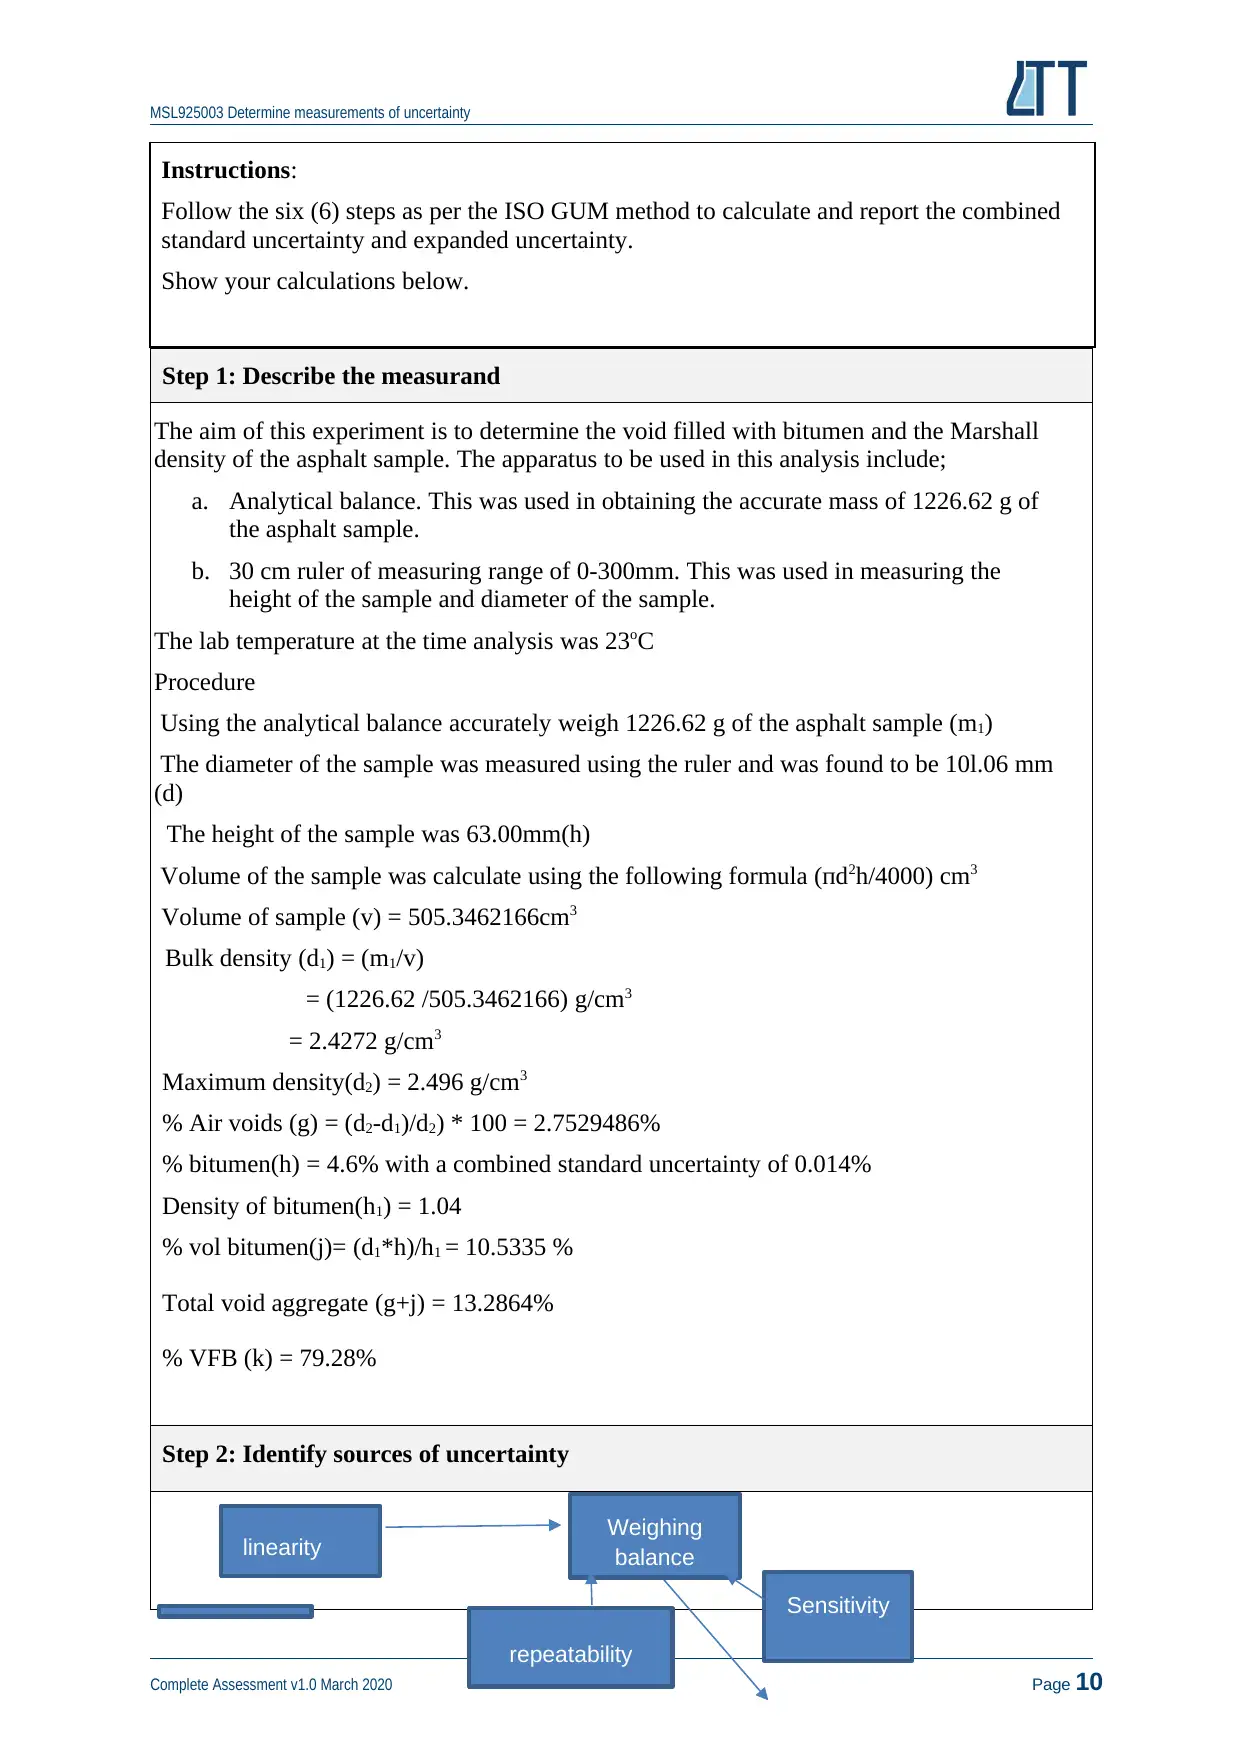
Step 1: Describe the measurand
The aim of this experiment is to determine the void filled with bitumen and the Marshall
density of the asphalt sample. The apparatus to be used in this analysis include;
a. Analytical balance. This was used in obtaining the accurate mass of 1226.62 g of
the asphalt sample.
b. 30 cm ruler of measuring range of 0-300mm. This was used in measuring the
height of the sample and diameter of the sample.
The lab temperature at the time analysis was 23oC
Procedure
Using the analytical balance accurately weigh 1226.62 g of the asphalt sample (m1)
The diameter of the sample was measured using the ruler and was found to be 10l.06 mm
(d)
The height of the sample was 63.00mm(h)
Volume of the sample was calculate using the following formula (пd2h/4000) cm3
Volume of sample (v) = 505.3462166cm3
Bulk density (d1) = (m1/v)
= (1226.62 /505.3462166) g/cm3
= 2.4272 g/cm3
Maximum density(d2) = 2.496 g/cm3
% Air voids (g) = (d2-d1)/d2) * 100 = 2.7529486%
% bitumen(h) = 4.6% with a combined standard uncertainty of 0.014%
Density of bitumen(h1) = 1.04
% vol bitumen(j)= (d1*h)/h1 = 10.5335 %
Total void aggregate (g+j) = 13.2864%
% VFB (k) = 79.28%
Step 2: Identify sources of uncertainty
Complete Assessment v1.0 March 2020 Page 10
linearity Weighing
balance
repeatability
Sensitivity
Instructions:
Follow the six (6) steps as per the ISO GUM method to calculate and report the combined
standard uncertainty and expanded uncertainty.
Show your calculations below.
Step 1: Describe the measurand
The aim of this experiment is to determine the void filled with bitumen and the Marshall
density of the asphalt sample. The apparatus to be used in this analysis include;
a. Analytical balance. This was used in obtaining the accurate mass of 1226.62 g of
the asphalt sample.
b. 30 cm ruler of measuring range of 0-300mm. This was used in measuring the
height of the sample and diameter of the sample.
The lab temperature at the time analysis was 23oC
Procedure
Using the analytical balance accurately weigh 1226.62 g of the asphalt sample (m1)
The diameter of the sample was measured using the ruler and was found to be 10l.06 mm
(d)
The height of the sample was 63.00mm(h)
Volume of the sample was calculate using the following formula (пd2h/4000) cm3
Volume of sample (v) = 505.3462166cm3
Bulk density (d1) = (m1/v)
= (1226.62 /505.3462166) g/cm3
= 2.4272 g/cm3
Maximum density(d2) = 2.496 g/cm3
% Air voids (g) = (d2-d1)/d2) * 100 = 2.7529486%
% bitumen(h) = 4.6% with a combined standard uncertainty of 0.014%
Density of bitumen(h1) = 1.04
% vol bitumen(j)= (d1*h)/h1 = 10.5335 %
Total void aggregate (g+j) = 13.2864%
% VFB (k) = 79.28%
Step 2: Identify sources of uncertainty
Complete Assessment v1.0 March 2020 Page 10
linearity Weighing
balance
repeatability
Sensitivity
Paraphrase This Document
Need a fresh take? Get an instant paraphrase of this document with our AI Paraphraser
MSL925003 Determine measurements of uncertainty
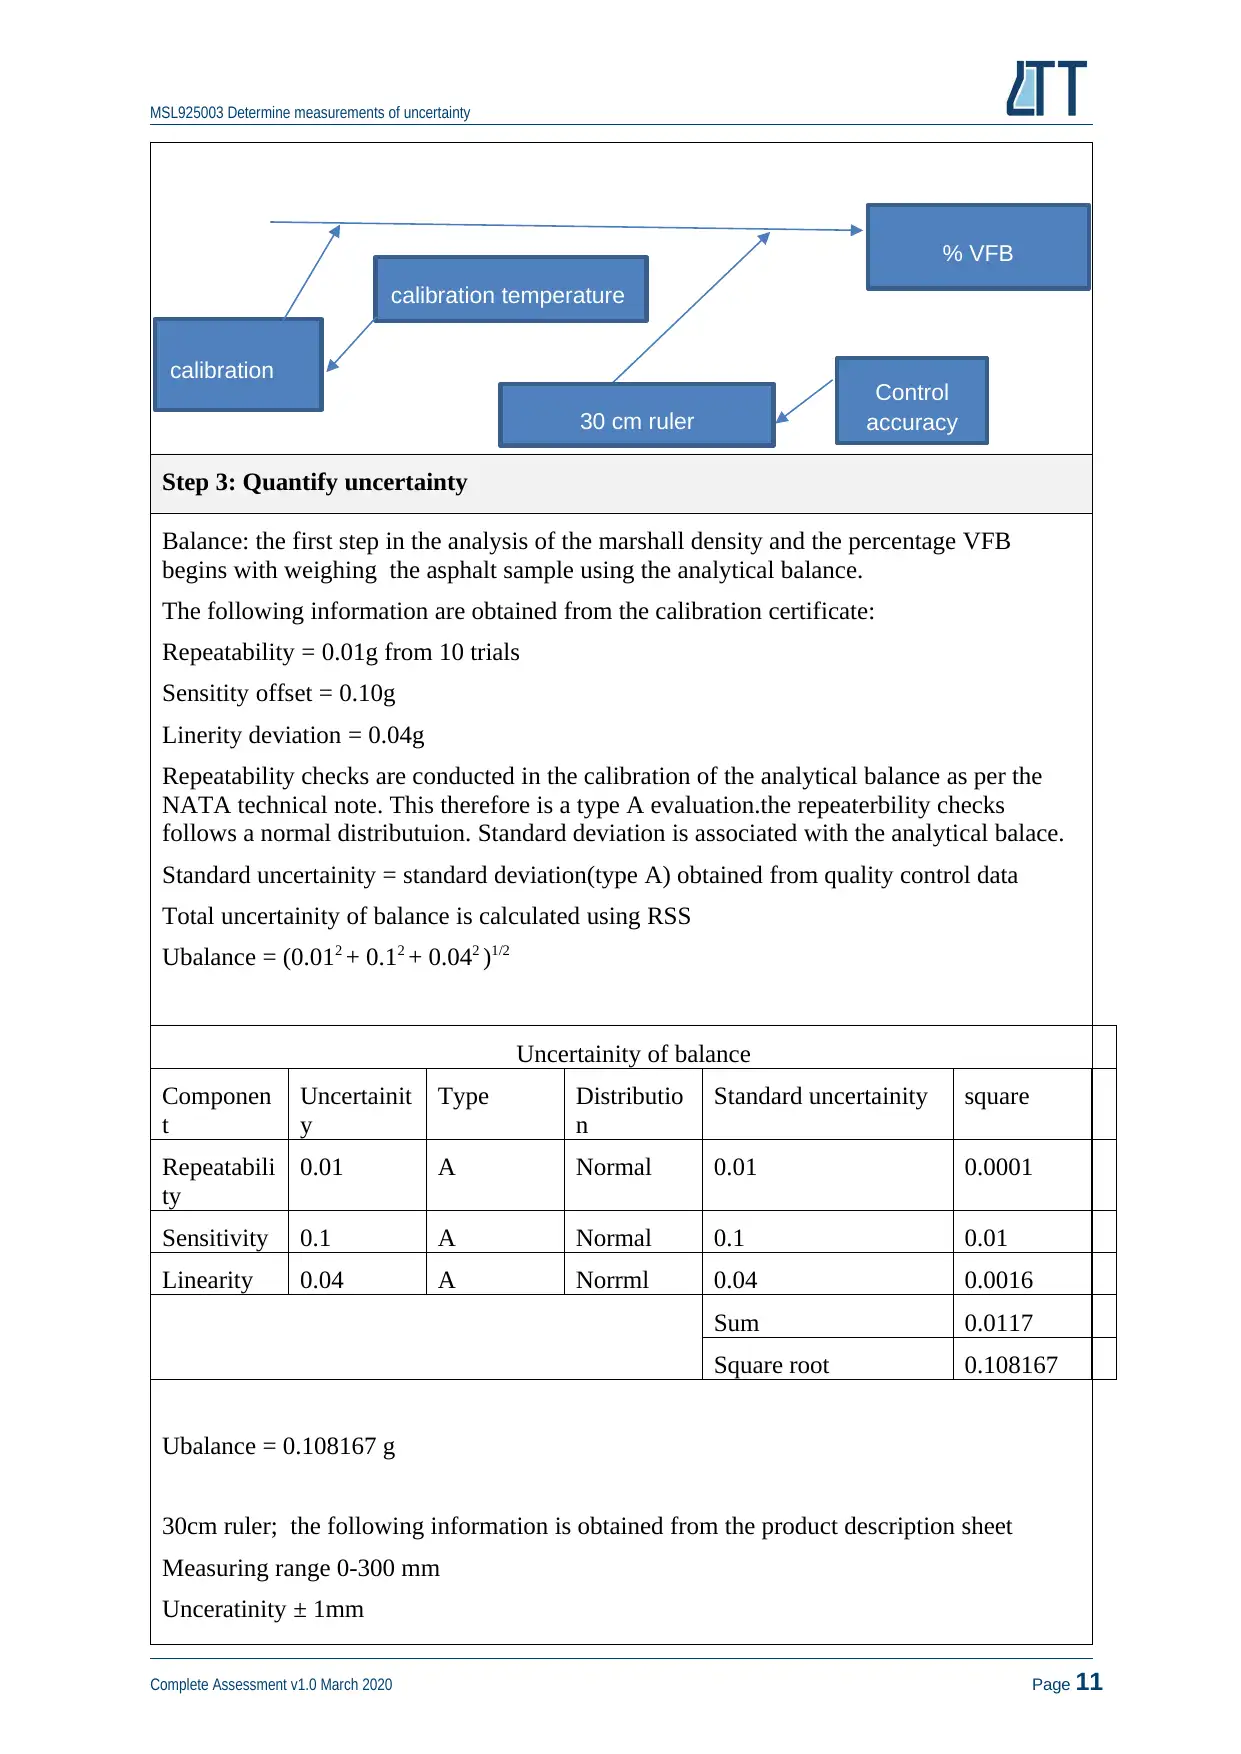
Step 3: Quantify uncertainty
Balance: the first step in the analysis of the marshall density and the percentage VFB
begins with weighing the asphalt sample using the analytical balance.
The following information are obtained from the calibration certificate:
Repeatability = 0.01g from 10 trials
Sensitity offset = 0.10g
Linerity deviation = 0.04g
Repeatability checks are conducted in the calibration of the analytical balance as per the
NATA technical note. This therefore is a type A evaluation.the repeaterbility checks
follows a normal distributuion. Standard deviation is associated with the analytical balace.
Standard uncertainity = standard deviation(type A) obtained from quality control data
Total uncertainity of balance is calculated using RSS
Ubalance = (0.012 + 0.12 + 0.042 )1/2
Ubalance = 0.108167 g
30cm ruler; the following information is obtained from the product description sheet
Measuring range 0-300 mm
Unceratinity ± 1mm
Complete Assessment v1.0 March 2020 Page 11
% VFB
calibration
30 cm ruler
calibration temperature
Control
accuracy
Uncertainity of balance
Componen
t
Uncertainit
y
Type Distributio
n
Standard uncertainity square
Repeatabili
ty
0.01 A Normal 0.01 0.0001
Sensitivity 0.1 A Normal 0.1 0.01
Linearity 0.04 A Norrml 0.04 0.0016
Sum 0.0117
Square root 0.108167
MSL925003 Determine measurements of uncertainty
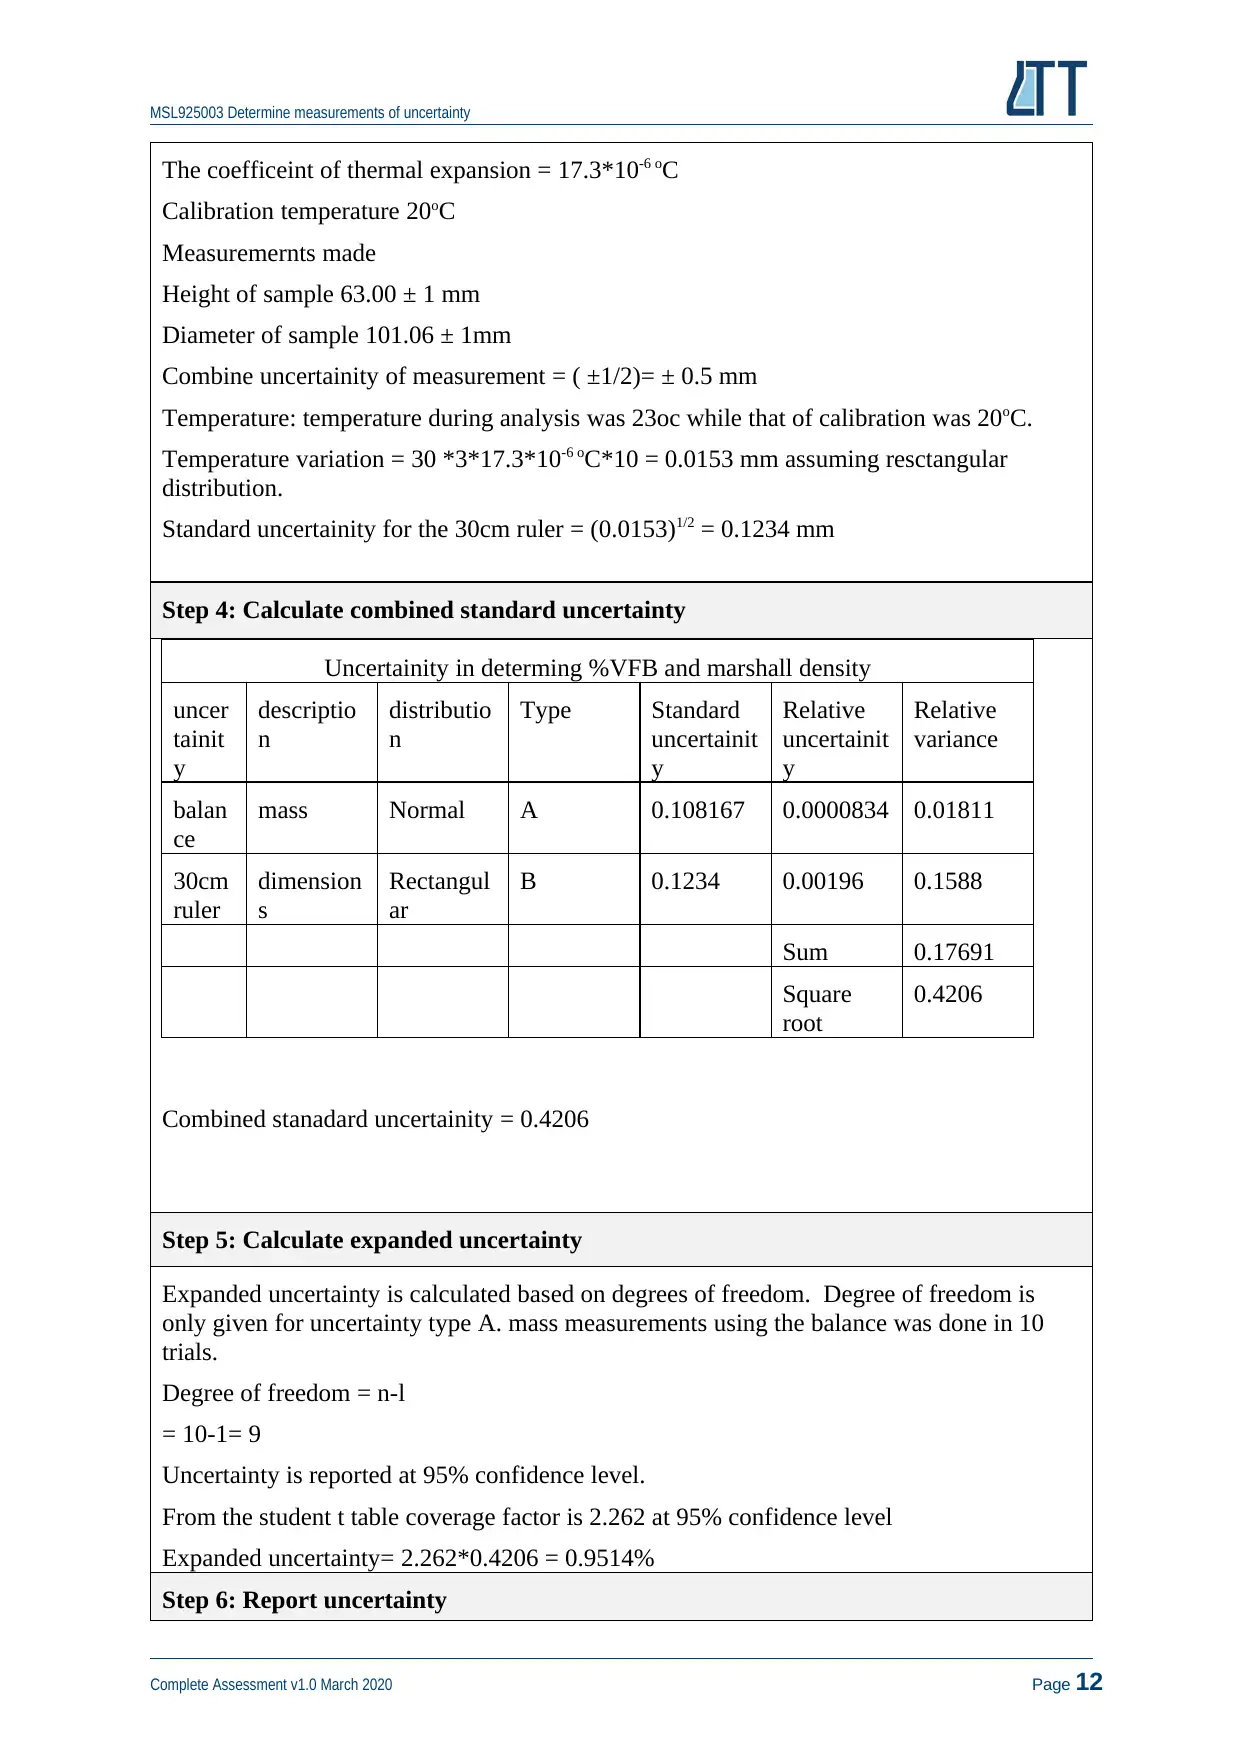
The coefficeint of thermal expansion = 17.3*10-6 oC
Calibration temperature 20oC
Measuremernts made
Height of sample 63.00 ± 1 mm
Diameter of sample 101.06 ± 1mm
Combine uncertainity of measurement = ( ±1/2)= ± 0.5 mm
Temperature: temperature during analysis was 23oc while that of calibration was 20oC.
Temperature variation = 30 *3*17.3*10-6 oC*10 = 0.0153 mm assuming resctangular
distribution.
Standard uncertainity for the 30cm ruler = (0.0153)1/2 = 0.1234 mm
Step 4: Calculate combined standard uncertainty
Uncertainity in determing %VFB and marshall density
uncer
tainit
y
descriptio
n
distributio
n
Type Standard
uncertainit
y
Relative
uncertainit
y
Relative
variance
balan
ce
mass Normal A 0.108167 0.0000834 0.01811
30cm
ruler
dimension
s
Rectangul
ar
B 0.1234 0.00196 0.1588
Sum 0.17691
Square
root
0.4206
Combined stanadard uncertainity = 0.4206
Step 5: Calculate expanded uncertainty
Expanded uncertainty is calculated based on degrees of freedom. Degree of freedom is
only given for uncertainty type A. mass measurements using the balance was done in 10
trials.
Degree of freedom = n-l
= 10-1= 9
Uncertainty is reported at 95% confidence level.
From the student t table coverage factor is 2.262 at 95% confidence level
Expanded uncertainty= 2.262*0.4206 = 0.9514%
Step 6: Report uncertainty
Complete Assessment v1.0 March 2020 Page 12
⊘ This is a preview!⊘
Do you want full access?
Subscribe today to unlock all pages.
Trusted by 1+ million students worldwide
1 out of 37
Related Documents


Your All-in-One AI-Powered Toolkit for Academic Success.
+13062052269
info@desklib.com
Available 24*7 on WhatsApp / Email
![[object Object]](/_next/static/media/star-bottom.7253800d.svg)
Unlock your academic potential
Copyright © 2020–2026 A2Z Services. All Rights Reserved. Developed and managed by ZUCOL.