MTH113 Statistics Assignment: Data Analysis and Interpretation
VerifiedAdded on 2023/06/12
|12
|1445
|449
Homework Assignment
AI Summary
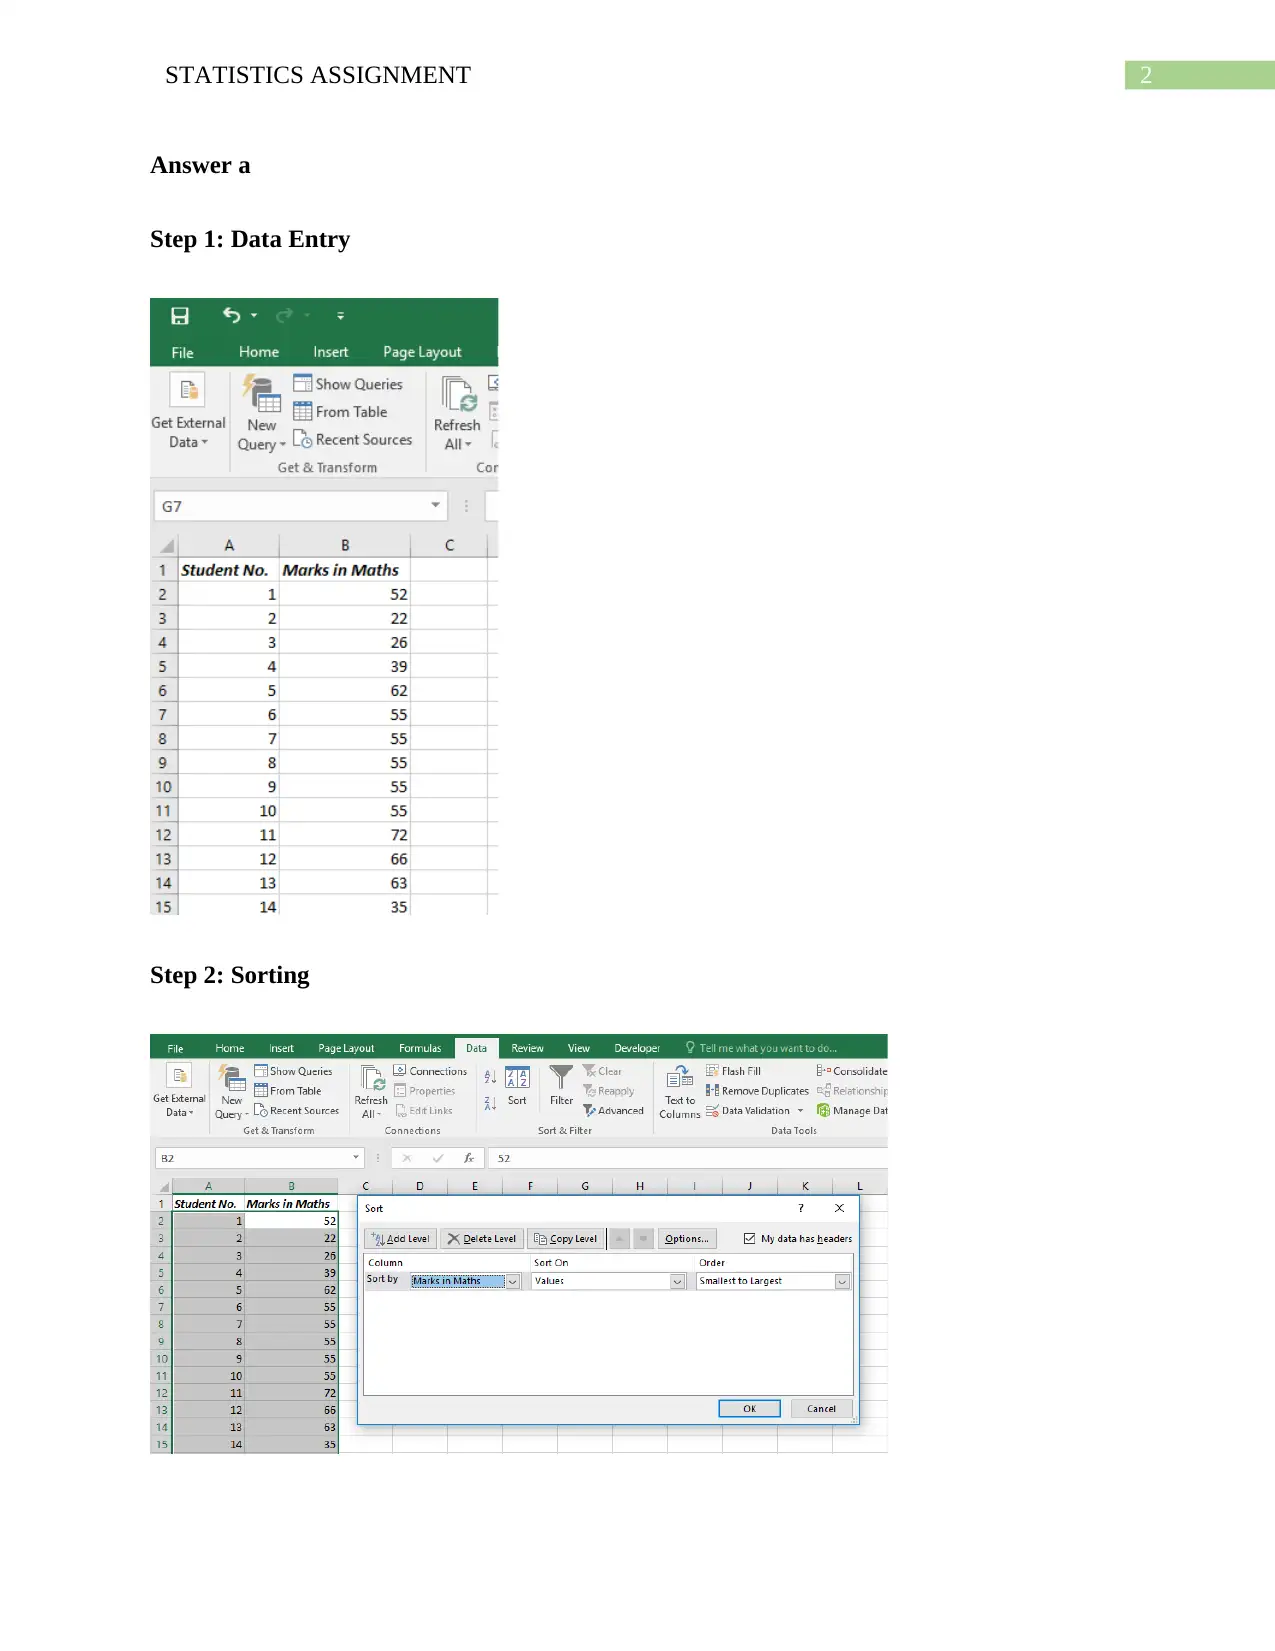
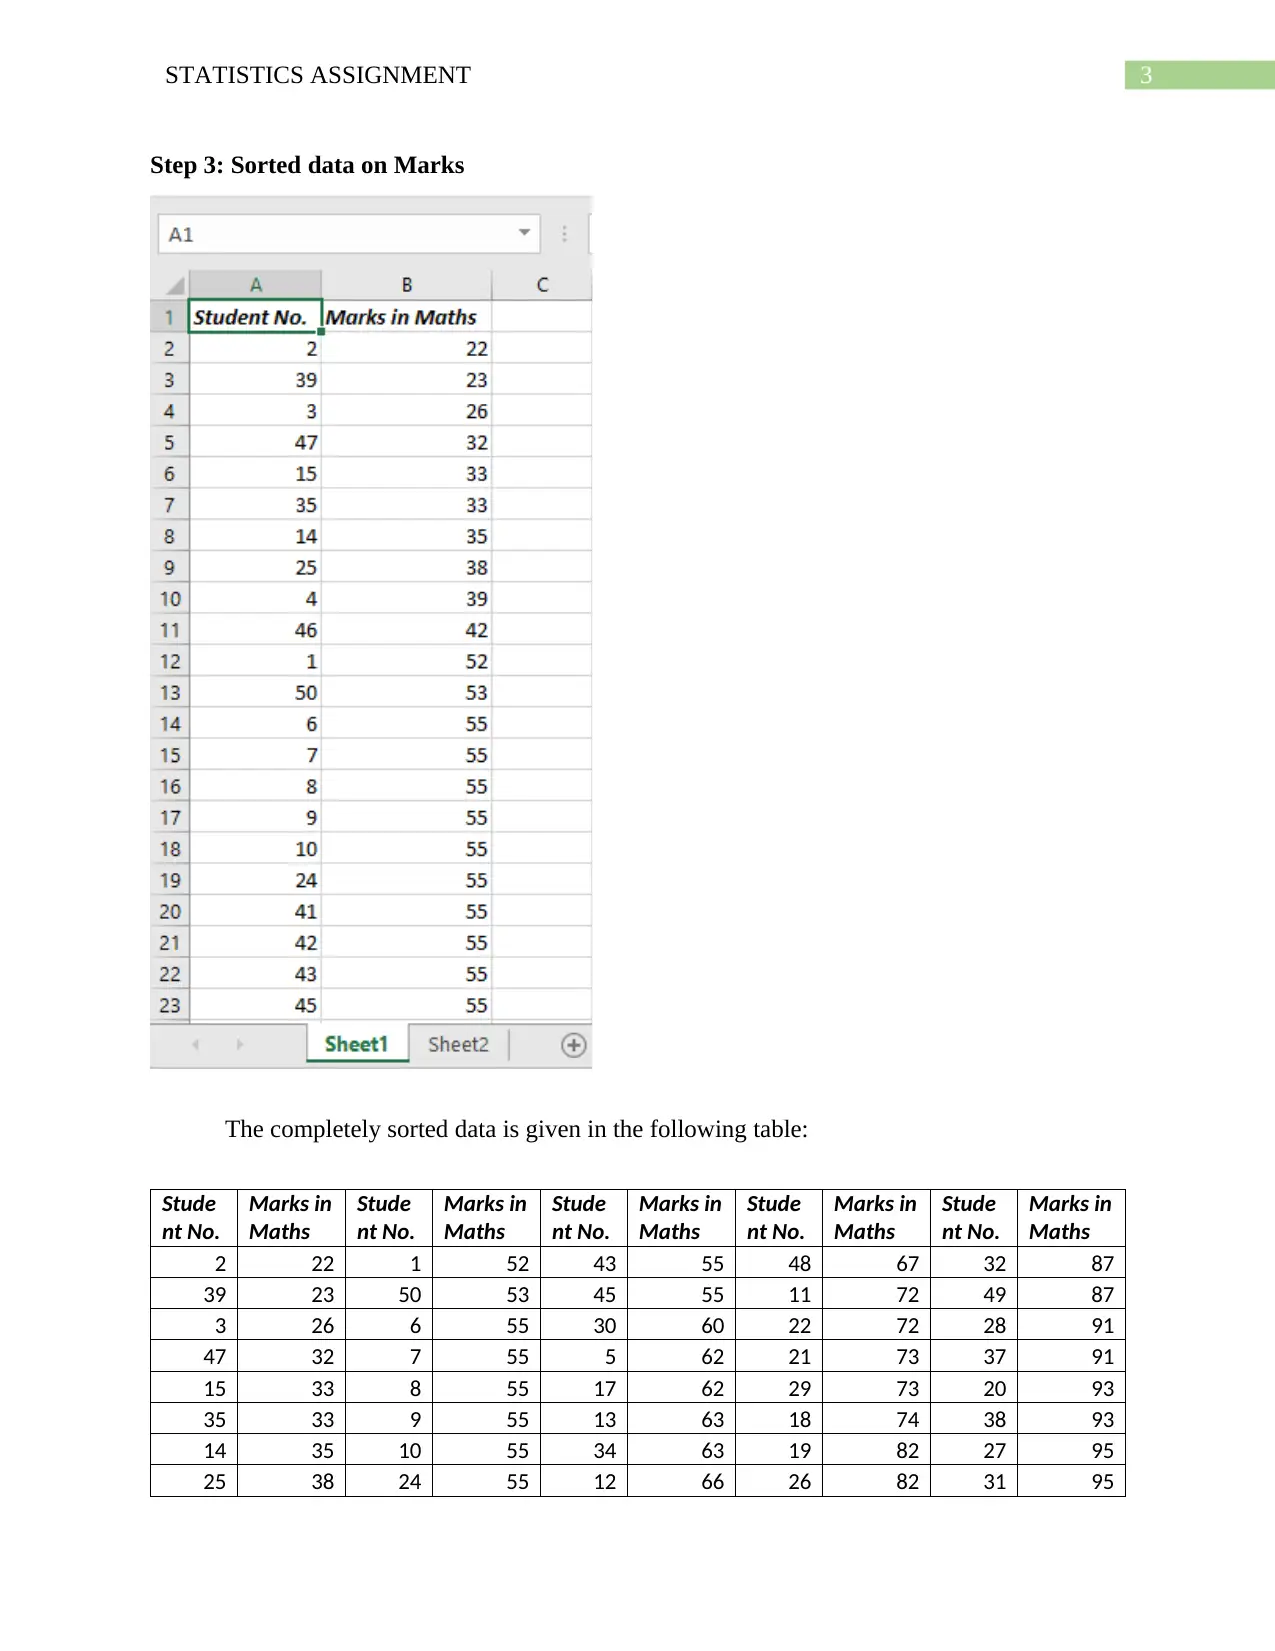
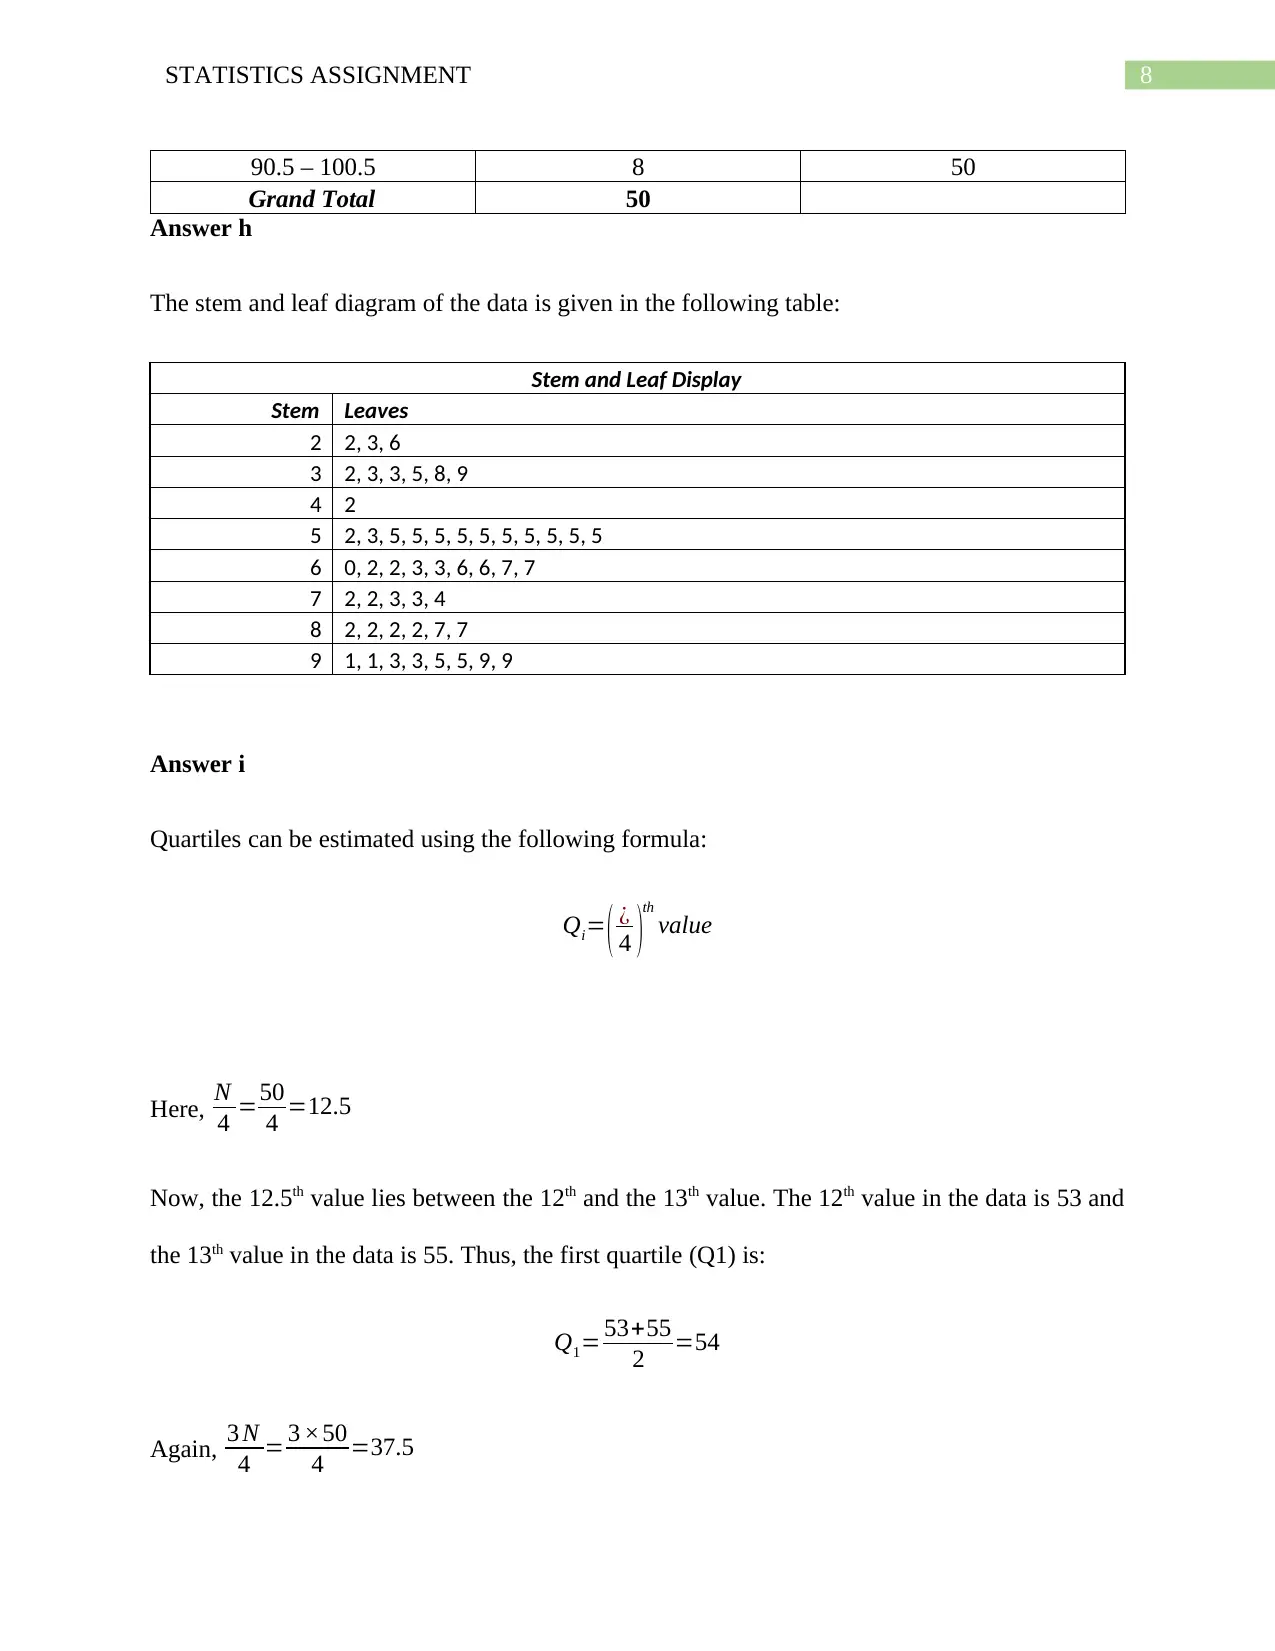
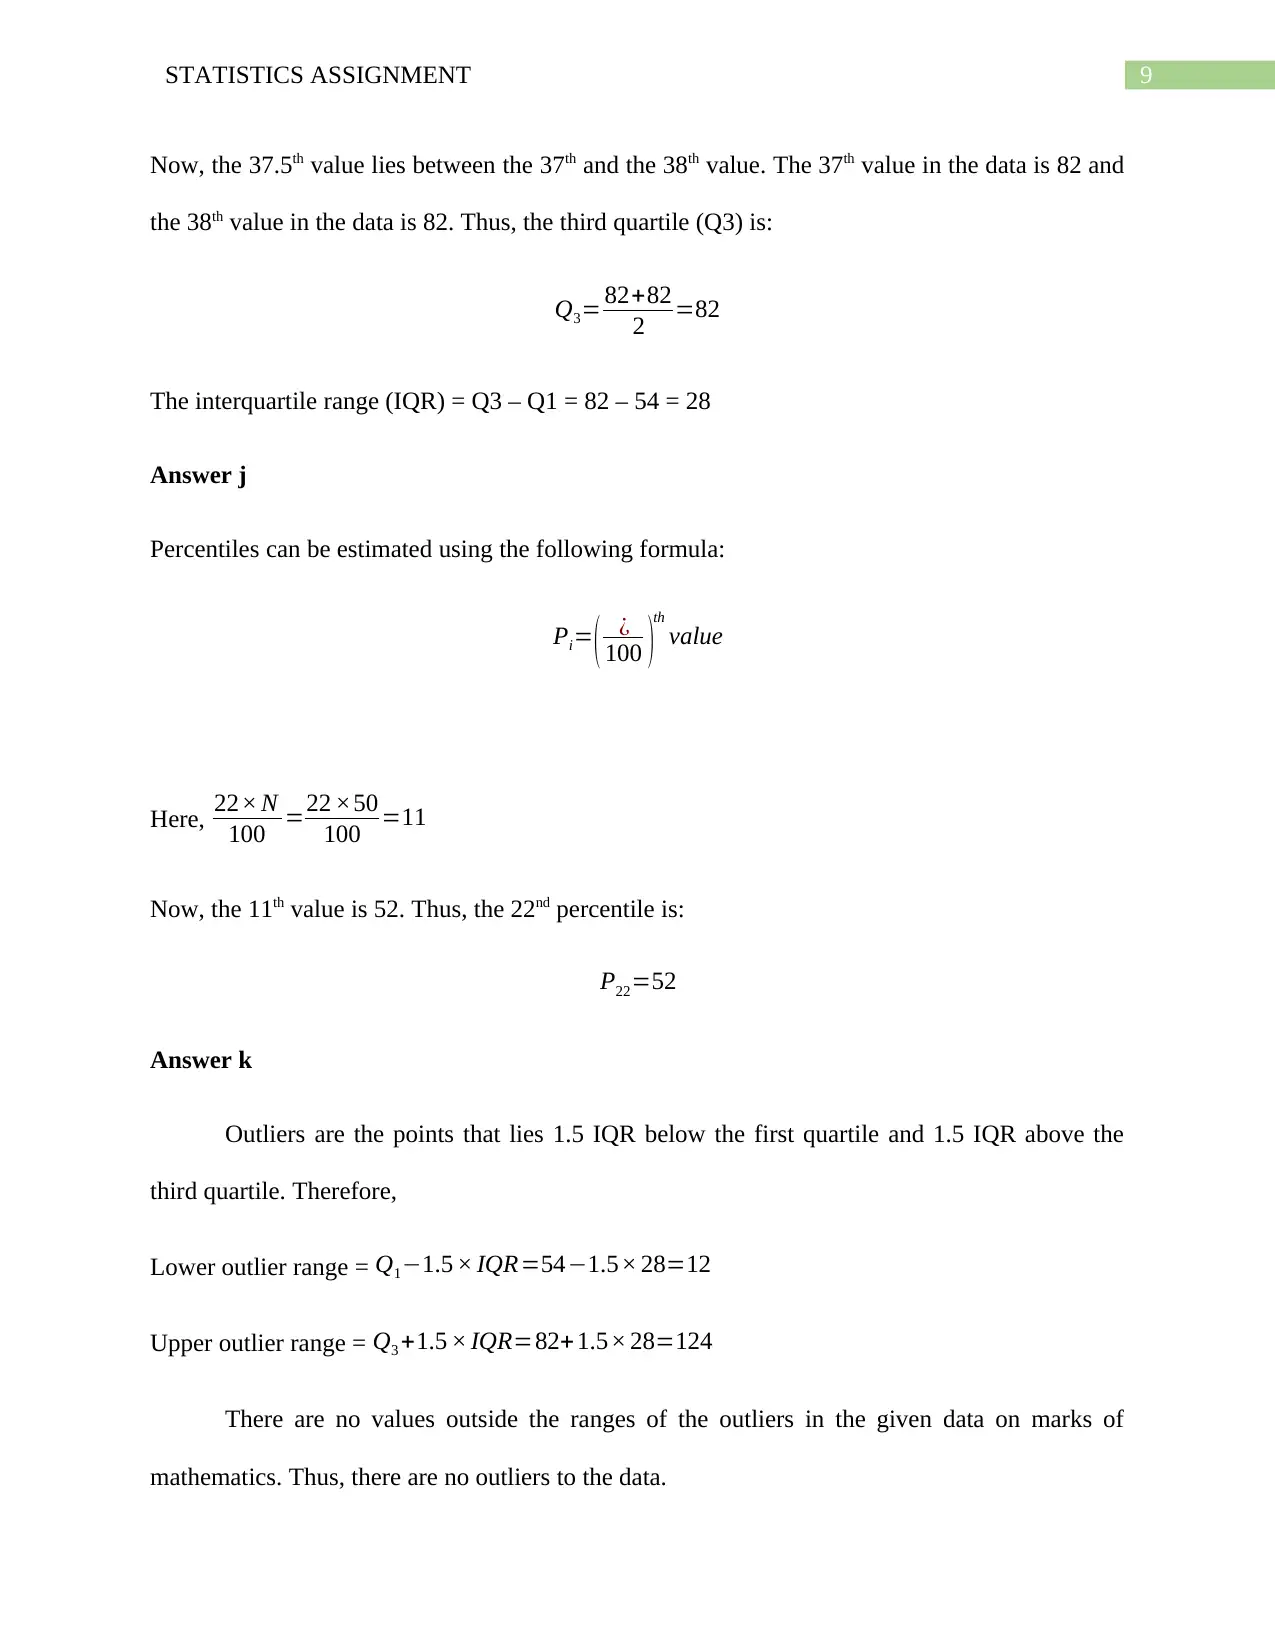
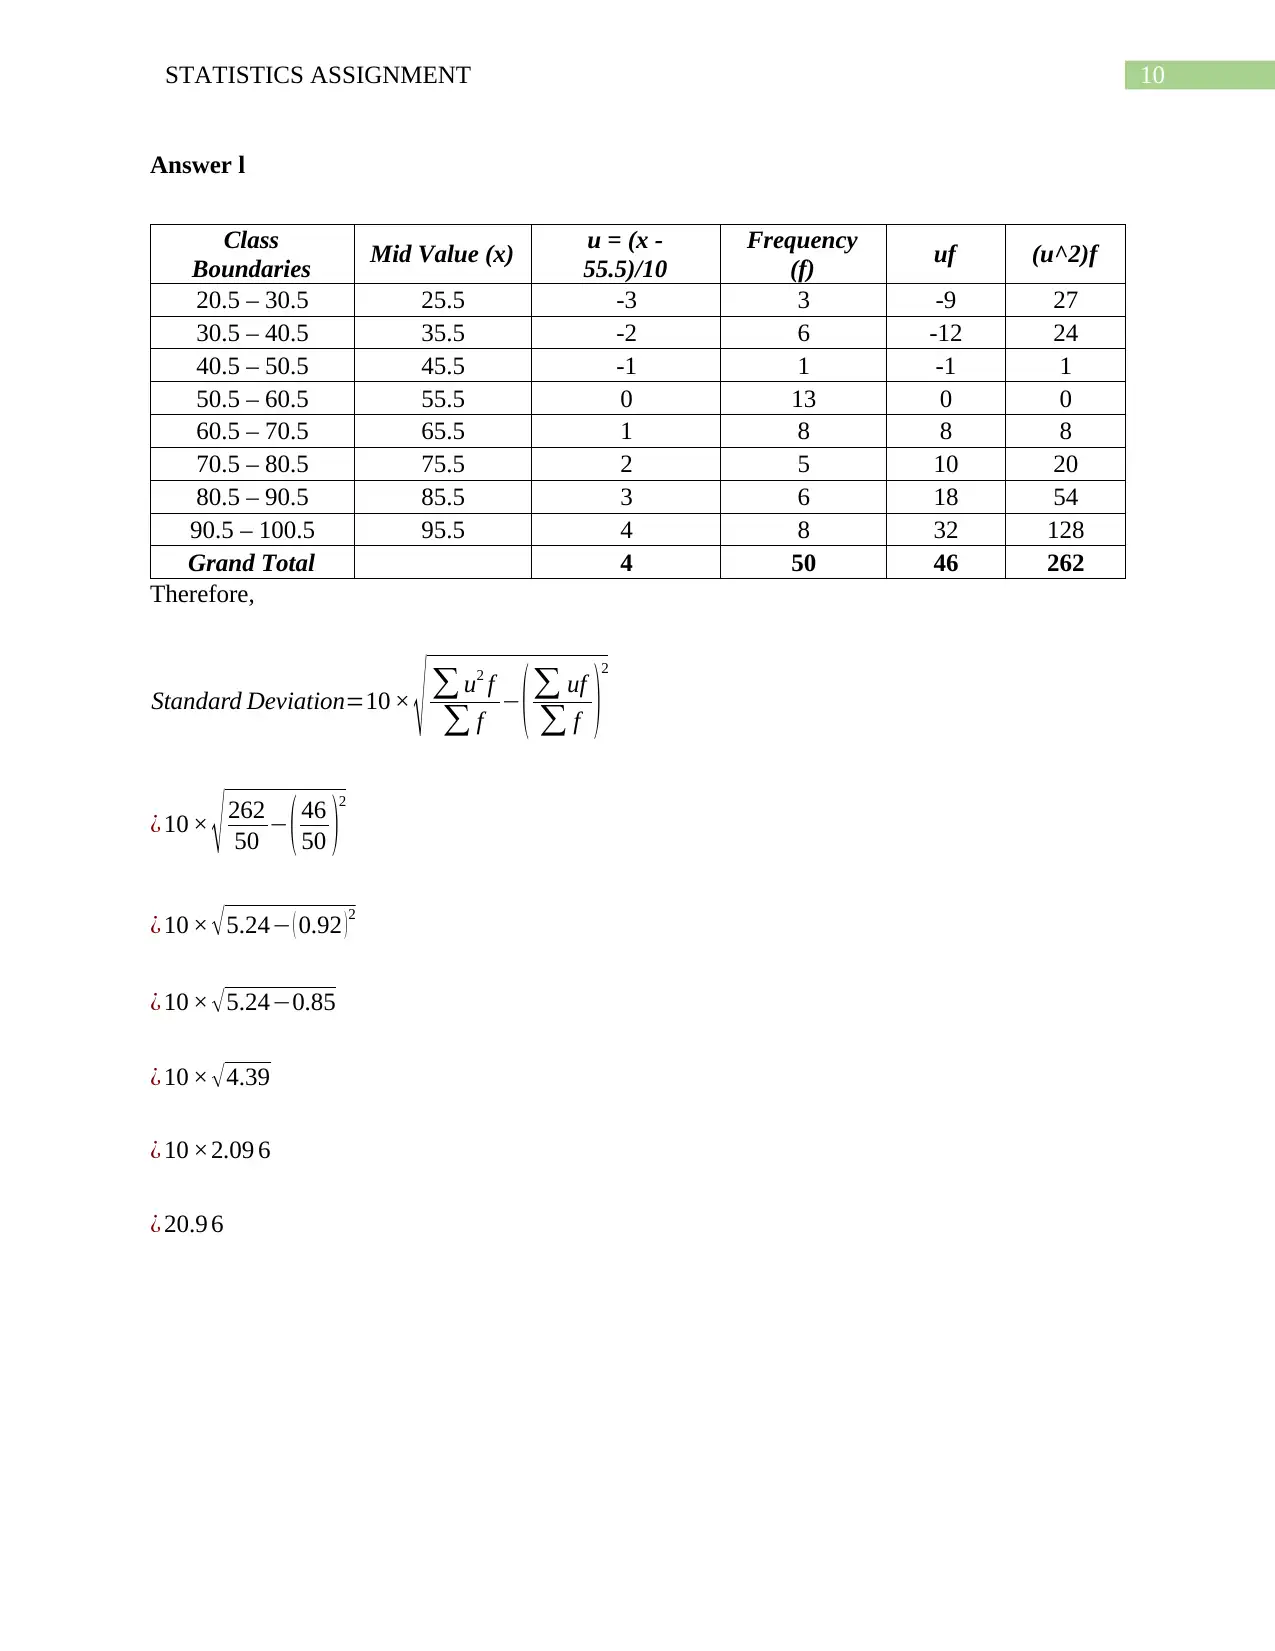
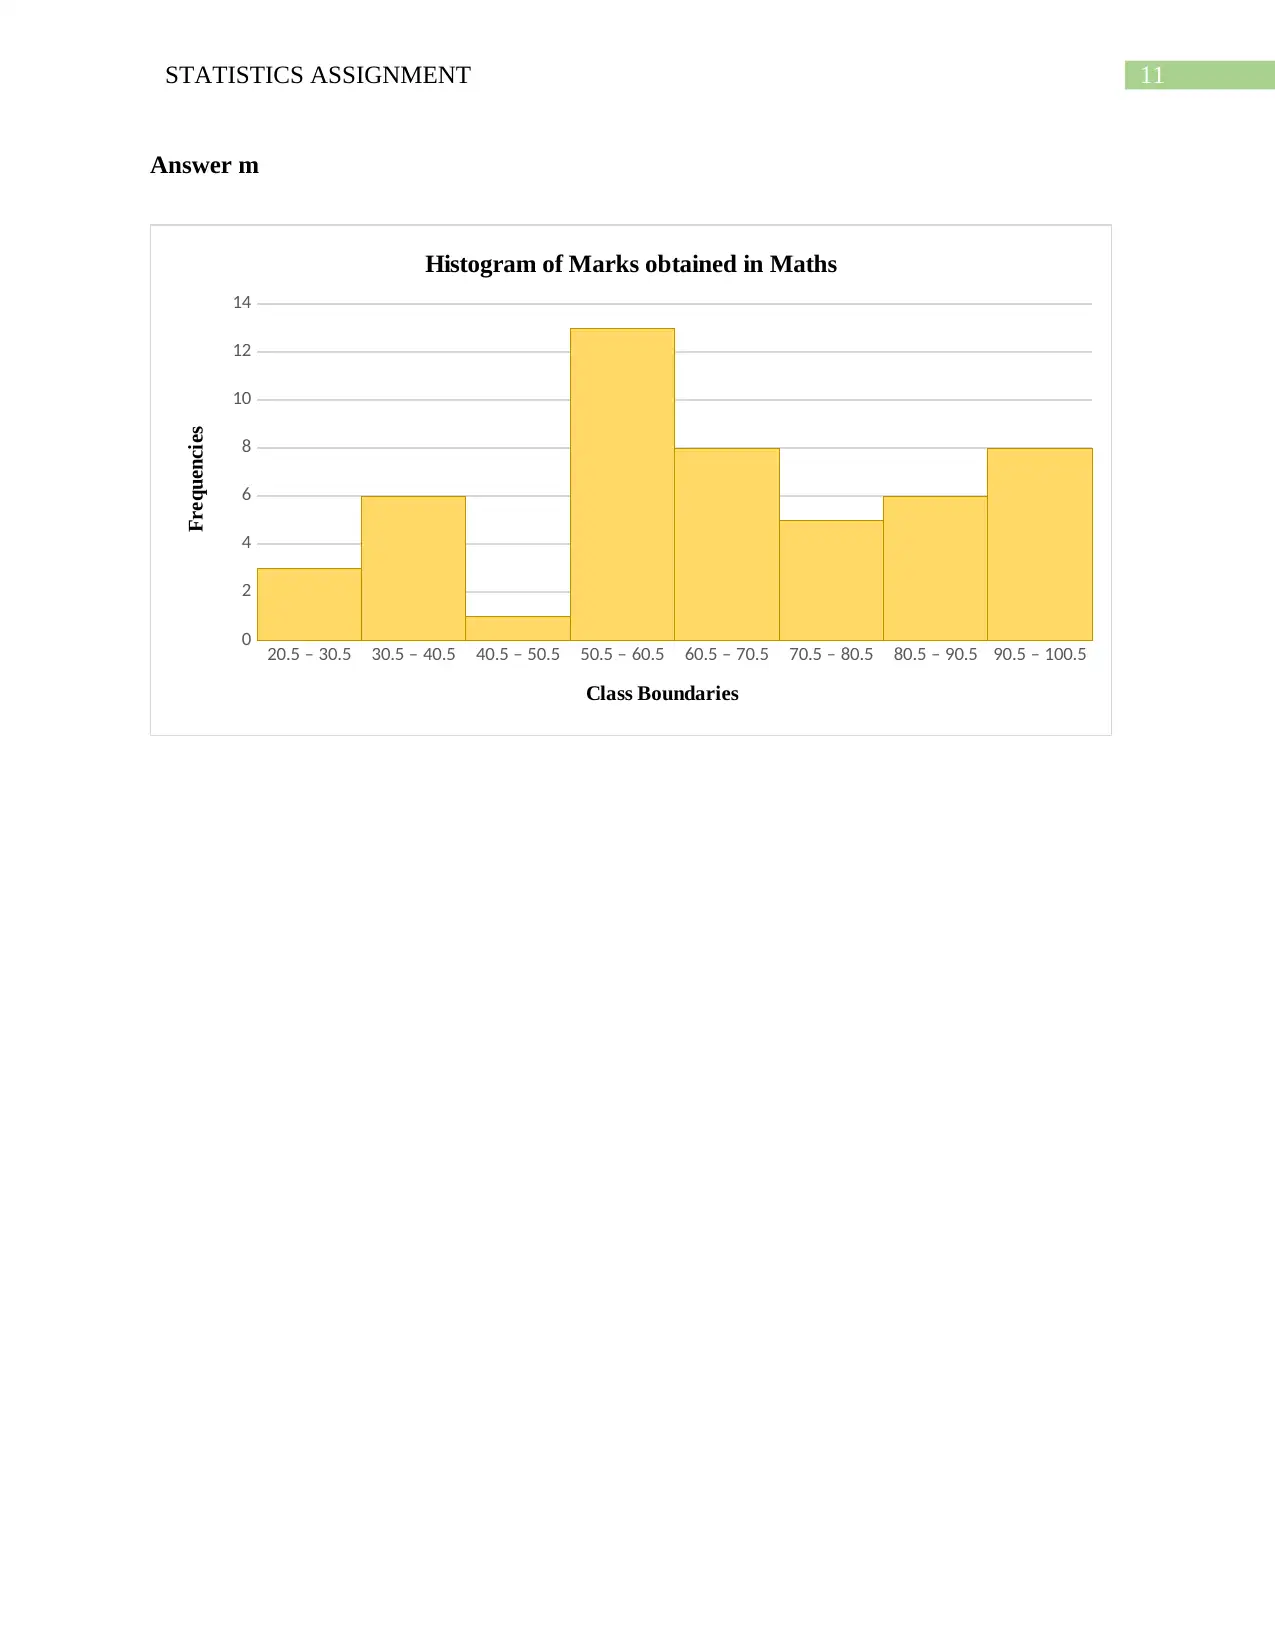
This document presents a comprehensive solution to a statistics assignment, covering various aspects of data analysis. The solution begins with data entry and sorting, followed by the calculation of range, mean, median, and mode. It then determines the class width, class limits, and class boundaries for a frequency distribution. The assignment further includes the creation of a frequency distribution table, a cumulative frequency table, and a stem and leaf diagram. Quartiles (Q1, Q3) and the interquartile range (IQR) are calculated, along with the 22nd percentile. Outliers are identified, and the standard deviation is computed using the sample population formula. Finally, a histogram visualizing the data is generated. This solution provides a step-by-step guide to solving statistical problems, demonstrating the application of key statistical concepts and techniques. Desklib offers a wealth of similar solved assignments and resources for students.
1 out of 12
Related Documents


Your All-in-One AI-Powered Toolkit for Academic Success.
+13062052269
info@desklib.com
Available 24*7 on WhatsApp / Email
![[object Object]](/_next/static/media/star-bottom.7253800d.svg)
Copyright © 2020–2026 A2Z Services. All Rights Reserved. Developed and managed by ZUCOL.