Fundamentals of Statistics and Probability - MTH219 Assignment
VerifiedAdded on 2022/08/11
|14
|2566
|24
Homework Assignment
AI Summary
This document presents a comprehensive solution to a tutor-marked assignment (TMA) for the MTH219 course, 'Fundamentals of Statistics and Probability.' The assignment covers a range of statistical concepts including conditional probability, binomial and Poisson distributions, exponential and geometric distributions, and data analysis. The solution includes detailed calculations and explanations for each task, such as determining probabilities related to applicant admissions, defect analysis in production lines, and analyzing experimental results. The assignment also involves the application of statistical methods to real-world scenarios, like determining the optimal price for a lottery ticket and analyzing program quality data. The solution demonstrates the application of various statistical techniques, including mean, median, standard deviation, and quartile calculations, as well as the use of Excel and R for statistical analysis. The assignment also includes stem-and-leaf plots and various probability calculations.
MTH219 Fundamentals of Statistics and Probability
Name of the Student
Name of the University
Author Note
Name of the Student
Name of the University
Author Note
Paraphrase This Document
Need a fresh take? Get an instant paraphrase of this document with our AI Paraphraser
Table of Contents
Task 1.........................................................................................................................................4
Part [a]....................................................................................................................................4
Task [i] Highest rating........................................................................................................4
Task [ii] Lowest rating........................................................................................................4
Part [b]....................................................................................................................................4
Part [c]....................................................................................................................................4
Part [d]....................................................................................................................................5
Part [e]....................................................................................................................................5
Task [i] Probability that a random sample of 5000 glass products.....................................5
Task [ii] Probability that a random sample of 5000 glass products....................................5
Task [iii] Comments...........................................................................................................5
Task 2.........................................................................................................................................6
Part [a]....................................................................................................................................6
Task [i] Without using MS Excel or R codes.....................................................................6
Task [ii] Stem-and-Leaf plot...............................................................................................8
Part [b]....................................................................................................................................8
Task 3.........................................................................................................................................8
Part [a]....................................................................................................................................8
Task [i] Average fill per bottle...........................................................................................8
Task [ii] Percentage of bottles with more than 210 ml.......................................................8
Part [b]....................................................................................................................................9
Task [i] None of the 6 experimental rats............................................................................9
Task [ii] More than 2 experimental rats..............................................................................9
Task [iii] 2 experimental rats will not be favourably affected by the drug........................9
Task [iv] Mean number of experimental rats......................................................................9
Part [c]....................................................................................................................................9
Task 4.......................................................................................................................................10
Part [a]..................................................................................................................................10
Task [i]..............................................................................................................................10
Task [ii].............................................................................................................................10
Task [iii]............................................................................................................................10
Part [b]..................................................................................................................................10
[i] X = 3.............................................................................................................................11
[ii] X<=4...........................................................................................................................11
Task 5.......................................................................................................................................11
Part [a]..................................................................................................................................11
[i] MS Excel......................................................................................................................11
[ii] R..................................................................................................................................12
Part [b]..................................................................................................................................12
[i] 6 messages are received in a given minute..................................................................12
[ii] 8 messages are received in 1.5 minutes......................................................................12
[iii] 4 messages are received in a period of 30 seconds....................................................13
Bibliography.............................................................................................................................14
⊘ This is a preview!⊘
Do you want full access?
Subscribe today to unlock all pages.
Trusted by 1+ million students worldwide
Task 1
Part [a]
Task [i] Highest rating
Number of applicants in the top 15% = 400*15/100 = 60
Hence, the probability that a person will be admitted given that he/she has the highest faculty
rating among the 400 students = 12/60 = 1/5
Task [ii] Lowest rating
the probability that a person will be admitted given that he/she has the lowest faculty rating =
12/60 = 1/5
Part [b]
Given P(A) = 0.03
P(B) = 0.02
P(AB) = 0.004
Therefore, P(B/A) = P(AB)/P(A) = 0.004/0.03 = 0.1333
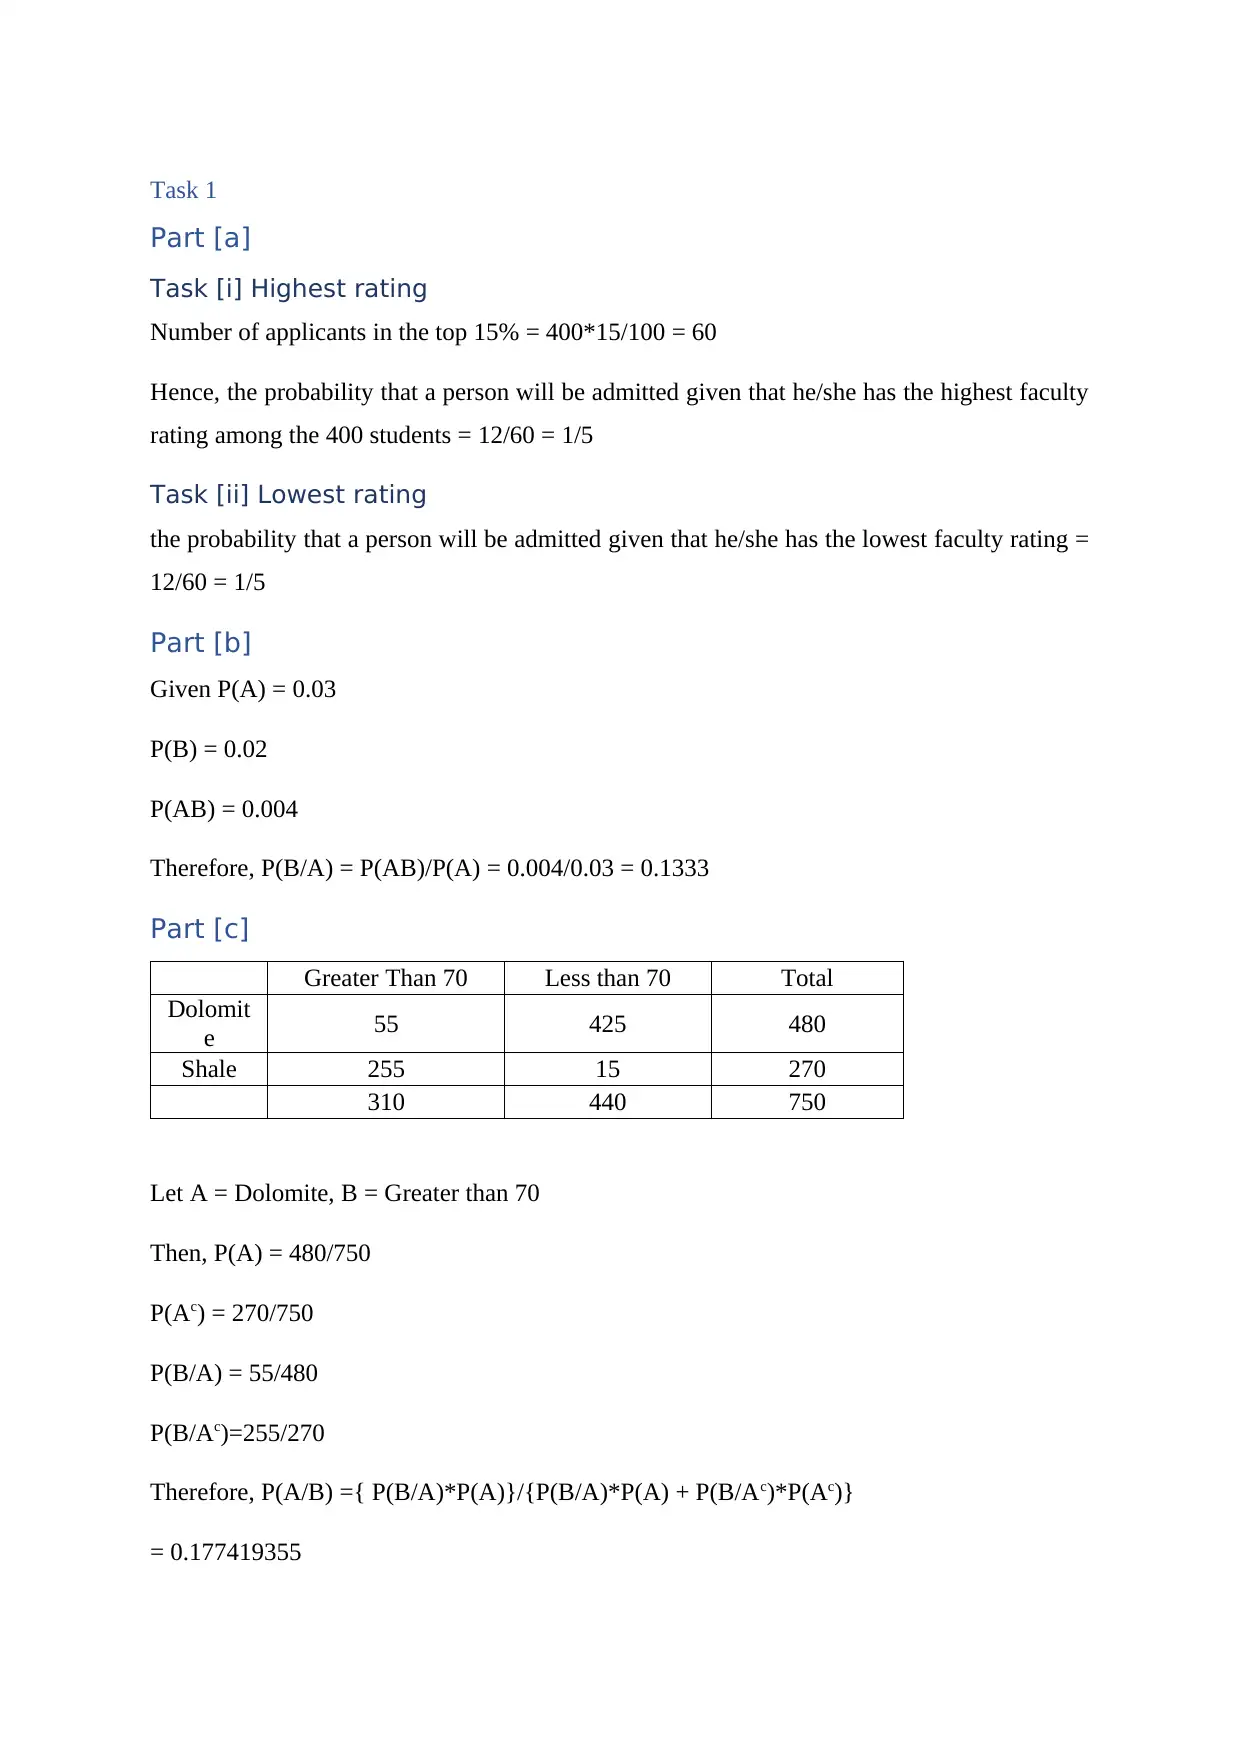
Part [c]
Greater Than 70 Less than 70 Total
Dolomit
e 55 425 480
Shale 255 15 270
310 440 750
Let A = Dolomite, B = Greater than 70
Then, P(A) = 480/750
P(Ac) = 270/750
P(B/A) = 55/480
P(B/Ac)=255/270
Therefore, P(A/B) ={ P(B/A)*P(A)}/{P(B/A)*P(A) + P(B/Ac)*P(Ac)}
= 0.177419355
Part [a]
Task [i] Highest rating
Number of applicants in the top 15% = 400*15/100 = 60
Hence, the probability that a person will be admitted given that he/she has the highest faculty
rating among the 400 students = 12/60 = 1/5
Task [ii] Lowest rating
the probability that a person will be admitted given that he/she has the lowest faculty rating =
12/60 = 1/5
Part [b]
Given P(A) = 0.03
P(B) = 0.02
P(AB) = 0.004
Therefore, P(B/A) = P(AB)/P(A) = 0.004/0.03 = 0.1333
Part [c]
Greater Than 70 Less than 70 Total
Dolomit
e 55 425 480
Shale 255 15 270
310 440 750
Let A = Dolomite, B = Greater than 70
Then, P(A) = 480/750
P(Ac) = 270/750
P(B/A) = 55/480
P(B/Ac)=255/270
Therefore, P(A/B) ={ P(B/A)*P(A)}/{P(B/A)*P(A) + P(B/Ac)*P(Ac)}
= 0.177419355
Paraphrase This Document
Need a fresh take? Get an instant paraphrase of this document with our AI Paraphraser
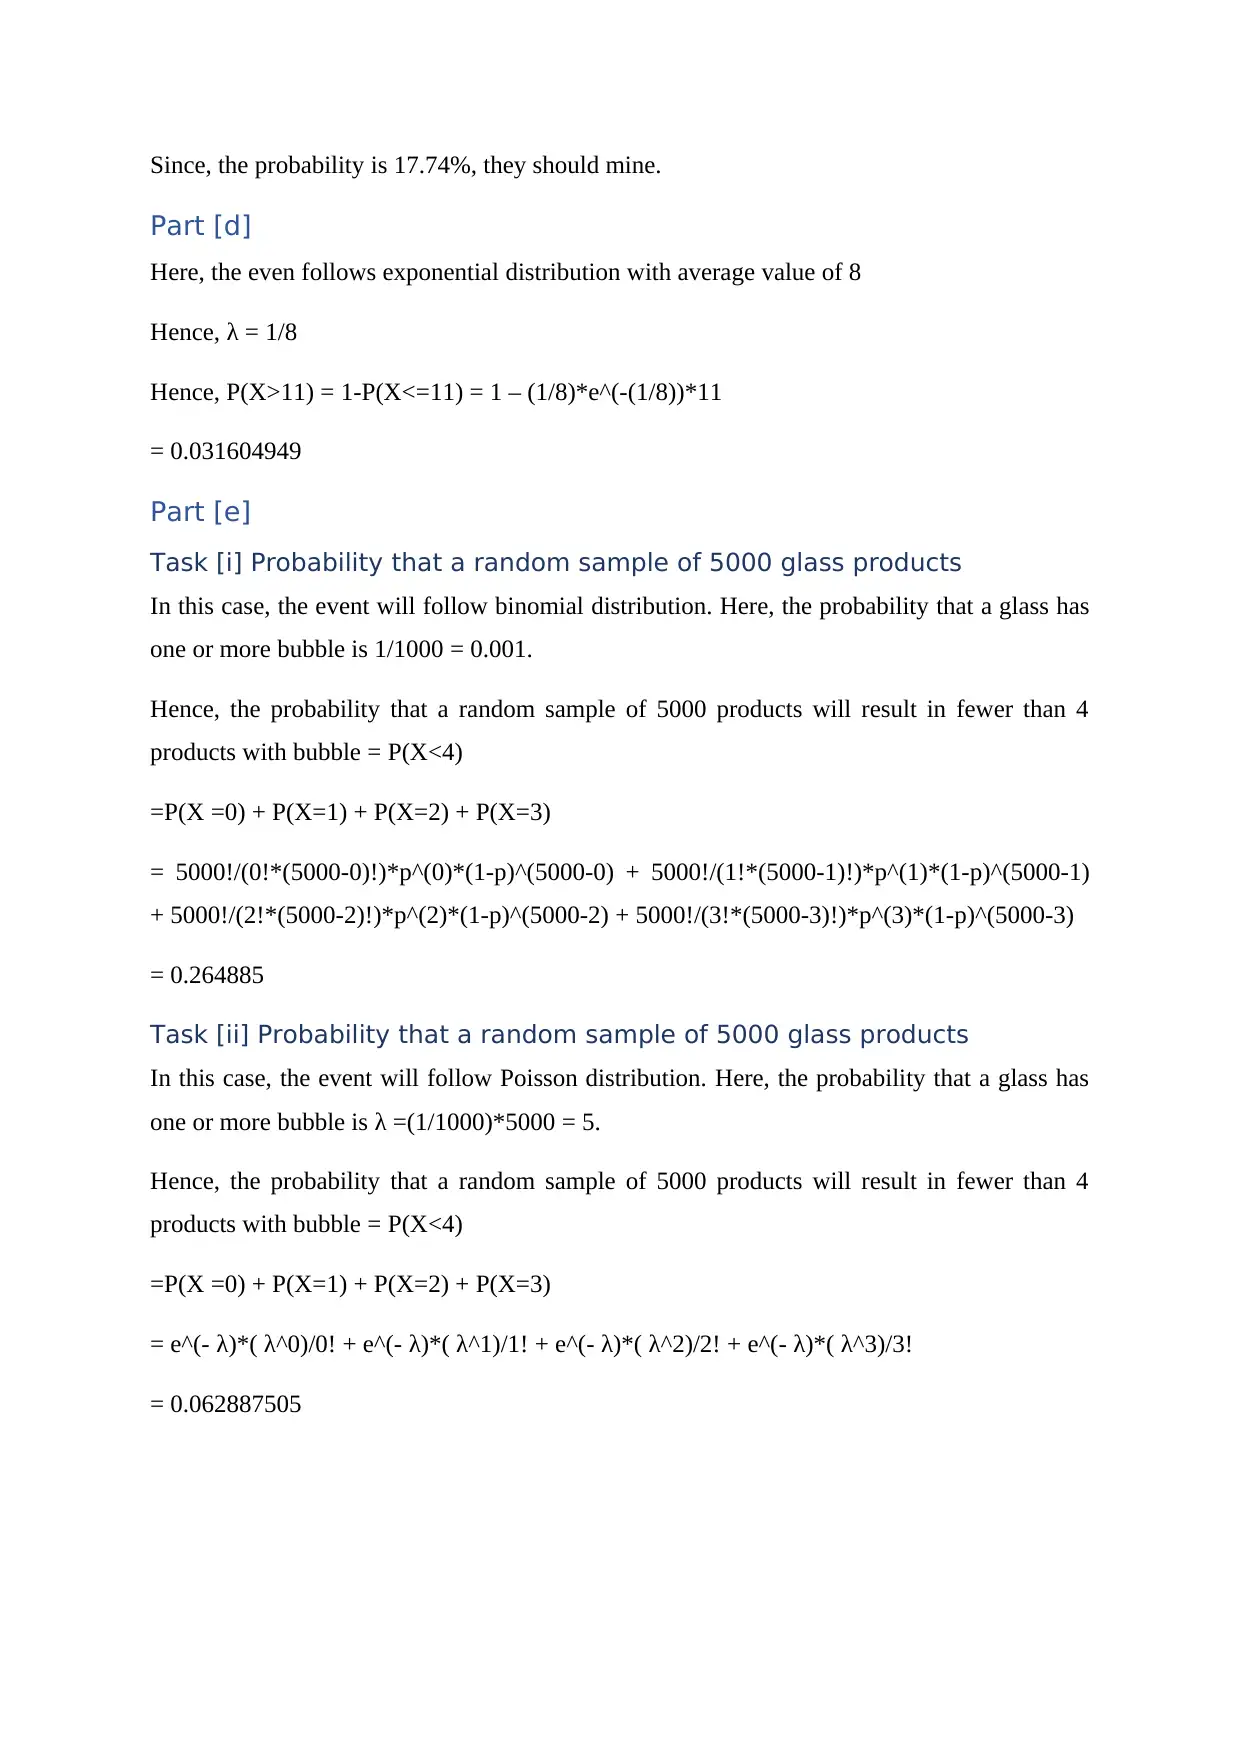
Since, the probability is 17.74%, they should mine.
Part [d]
Here, the even follows exponential distribution with average value of 8
Hence, λ = 1/8
Hence, P(X>11) = 1-P(X<=11) = 1 – (1/8)*e^(-(1/8))*11
= 0.031604949
Part [e]
Task [i] Probability that a random sample of 5000 glass products
In this case, the event will follow binomial distribution. Here, the probability that a glass has
one or more bubble is 1/1000 = 0.001.
Hence, the probability that a random sample of 5000 products will result in fewer than 4
products with bubble = P(X<4)
=P(X =0) + P(X=1) + P(X=2) + P(X=3)
= 5000!/(0!*(5000-0)!)*p^(0)*(1-p)^(5000-0) + 5000!/(1!*(5000-1)!)*p^(1)*(1-p)^(5000-1)
+ 5000!/(2!*(5000-2)!)*p^(2)*(1-p)^(5000-2) + 5000!/(3!*(5000-3)!)*p^(3)*(1-p)^(5000-3)
= 0.264885
Task [ii] Probability that a random sample of 5000 glass products
In this case, the event will follow Poisson distribution. Here, the probability that a glass has
one or more bubble is λ =(1/1000)*5000 = 5.
Hence, the probability that a random sample of 5000 products will result in fewer than 4
products with bubble = P(X<4)
=P(X =0) + P(X=1) + P(X=2) + P(X=3)
= e^(- λ)*( λ^0)/0! + e^(- λ)*( λ^1)/1! + e^(- λ)*( λ^2)/2! + e^(- λ)*( λ^3)/3!
= 0.062887505
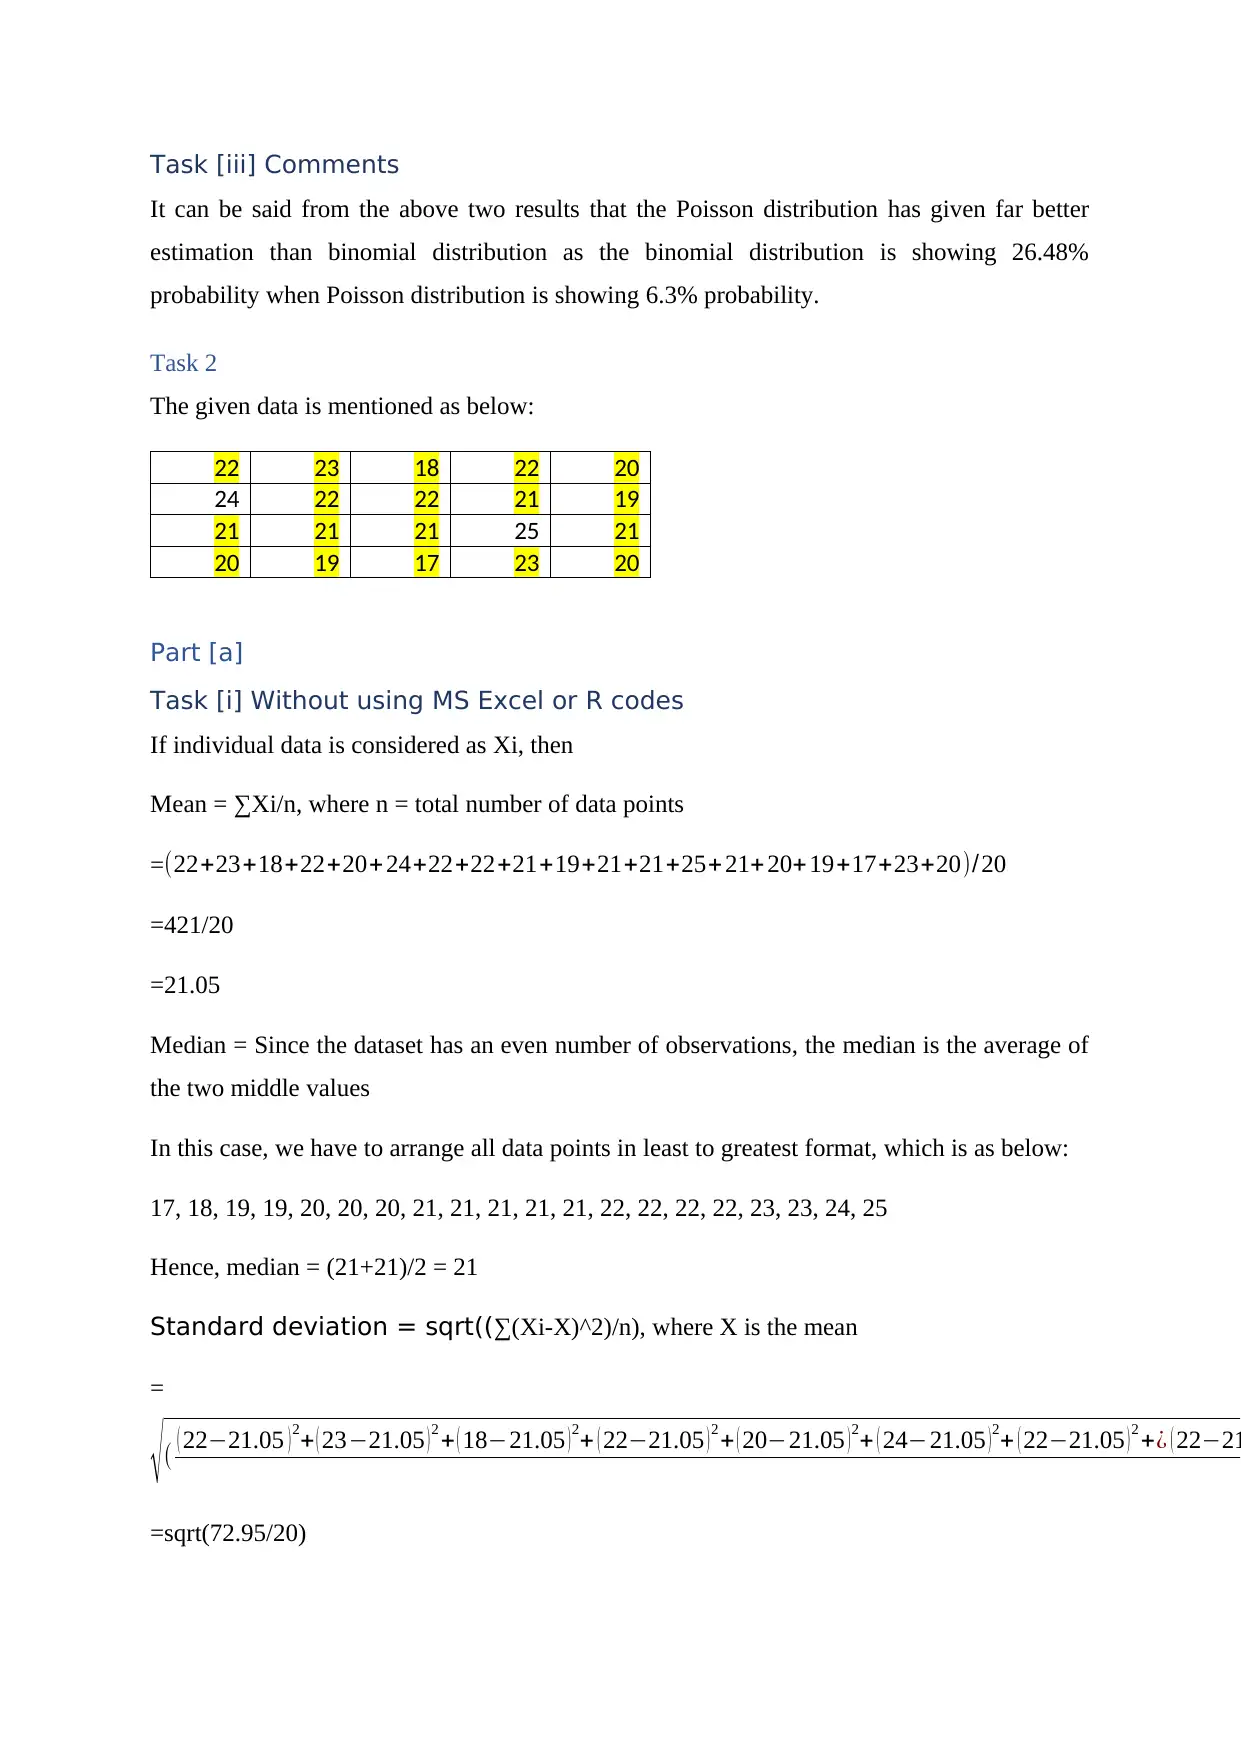
Task [iii] Comments
It can be said from the above two results that the Poisson distribution has given far better
estimation than binomial distribution as the binomial distribution is showing 26.48%
probability when Poisson distribution is showing 6.3% probability.
Task 2
The given data is mentioned as below:
22 23 18 22 20
24 22 22 21 19
21 21 21 25 21
20 19 17 23 20
Part [a]
Task [i] Without using MS Excel or R codes
If individual data is considered as Xi, then
Mean = ∑Xi/n, where n = total number of data points
=(22+23+18+22+20+24+22+22+21+19+21+21+25+ 21+20+19+17+23+20)/20
=421/20
=21.05
Median = Since the dataset has an even number of observations, the median is the average of
the two middle values
In this case, we have to arrange all data points in least to greatest format, which is as below:
17, 18, 19, 19, 20, 20, 20, 21, 21, 21, 21, 21, 22, 22, 22, 22, 23, 23, 24, 25
Hence, median = (21+21)/2 = 21
Standard deviation = sqrt((∑(Xi-X)^2)/n), where X is the mean
=
√( ( 22−21.05 )2+ ( 23−21.05 )2 + ( 18−21.05 )2+ ( 22−21.05 )2 + ( 20−21.05 )2+ ( 24−21.05 )2+ ( 22−21.05 )2 +¿ ( 22−21
=sqrt(72.95/20)
⊘ This is a preview!⊘
Do you want full access?
Subscribe today to unlock all pages.
Trusted by 1+ million students worldwide
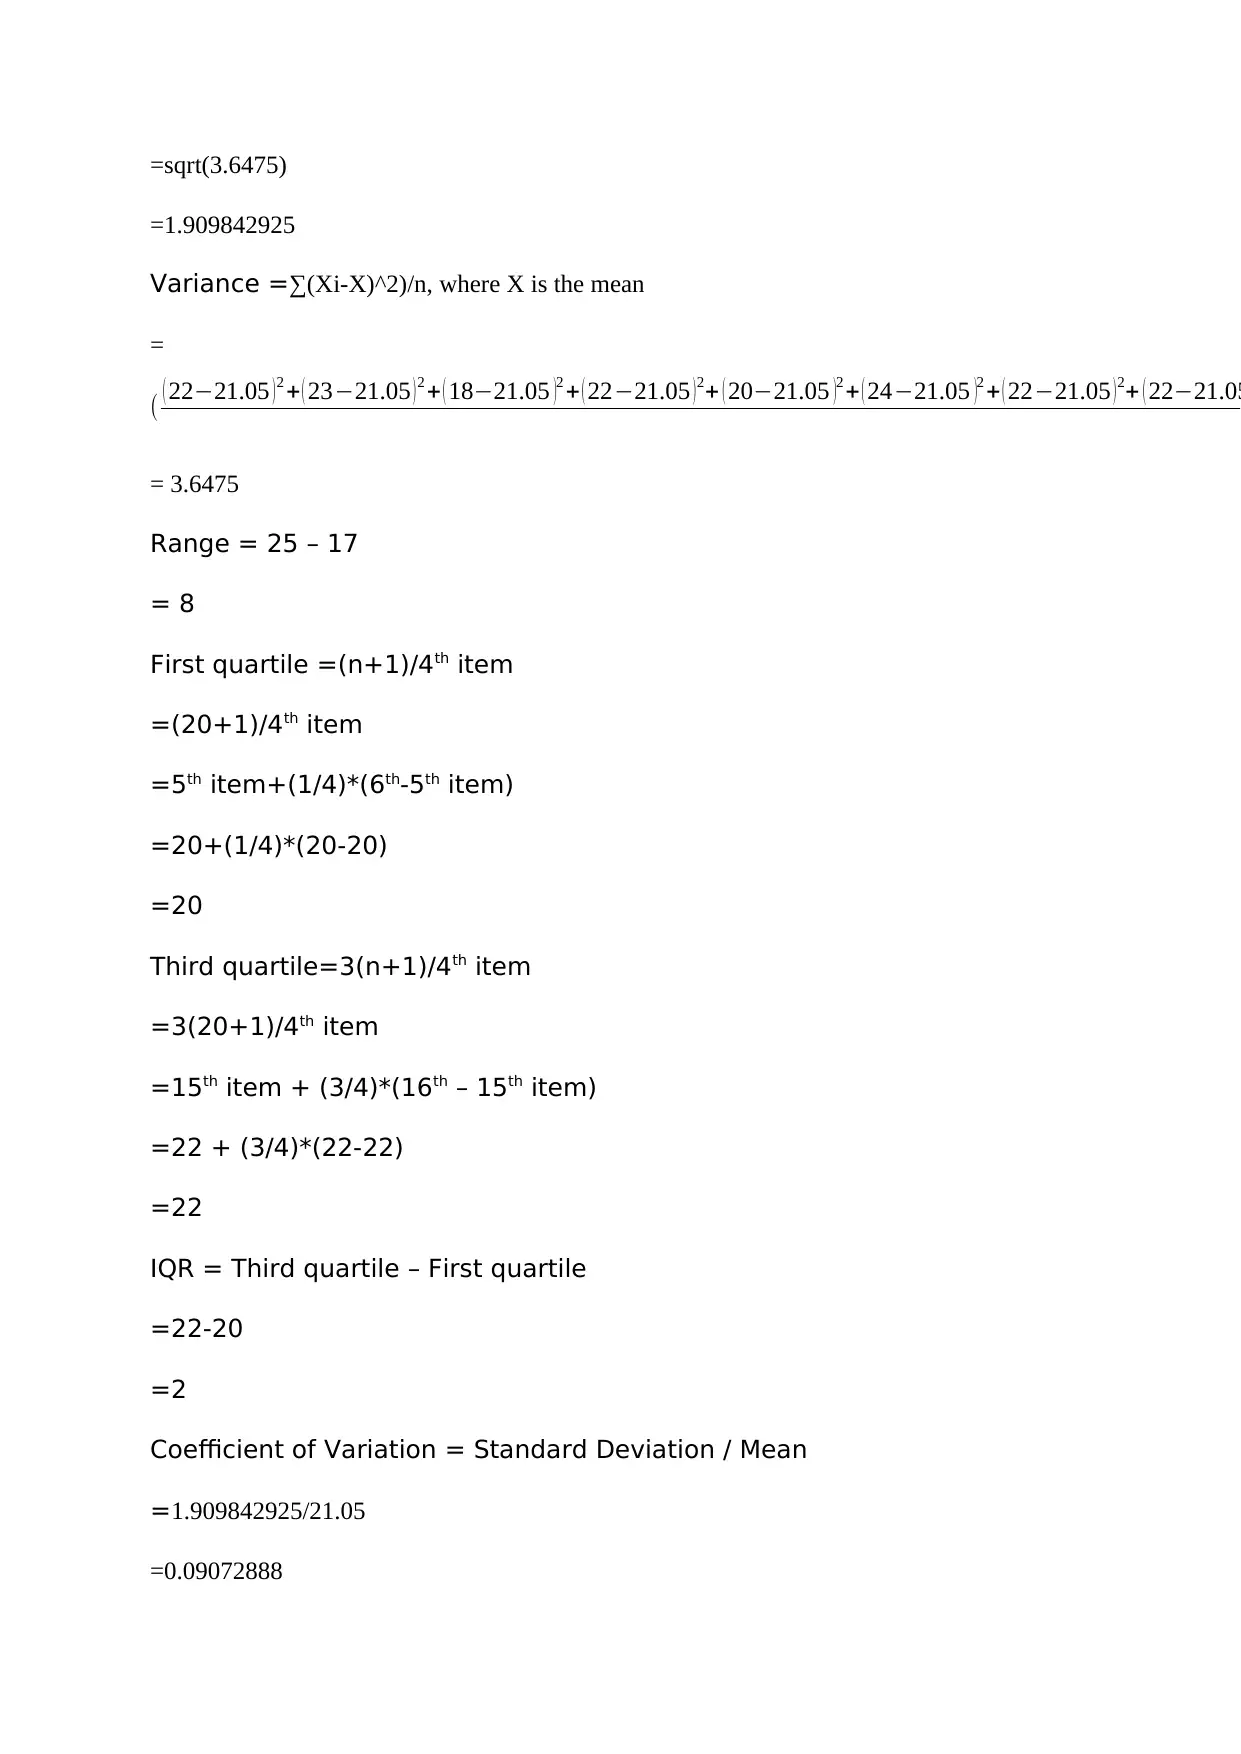
=sqrt(3.6475)
=1.909842925
Variance =∑(Xi-X)^2)/n, where X is the mean
=
( ( 22−21.05 ) 2 + ( 23−21.05 ) 2 + ( 18−21.05 )2 + ( 22−21.05 ) 2+ ( 20−21.05 )2 + ( 24−21.05 )2 + ( 22−21.05 ) 2+ ( 22−21.05
= 3.6475
Range = 25 – 17
= 8
First quartile =(n+1)/4th item
=(20+1)/4th item
=5th item+(1/4)*(6th-5th item)
=20+(1/4)*(20-20)
=20
Third quartile=3(n+1)/4th item
=3(20+1)/4th item
=15th item + (3/4)*(16th – 15th item)
=22 + (3/4)*(22-22)
=22
IQR = Third quartile – First quartile
=22-20
=2
Coefficient of Variation = Standard Deviation / Mean
=1.909842925/21.05
=0.09072888
Paraphrase This Document
Need a fresh take? Get an instant paraphrase of this document with our AI Paraphraser
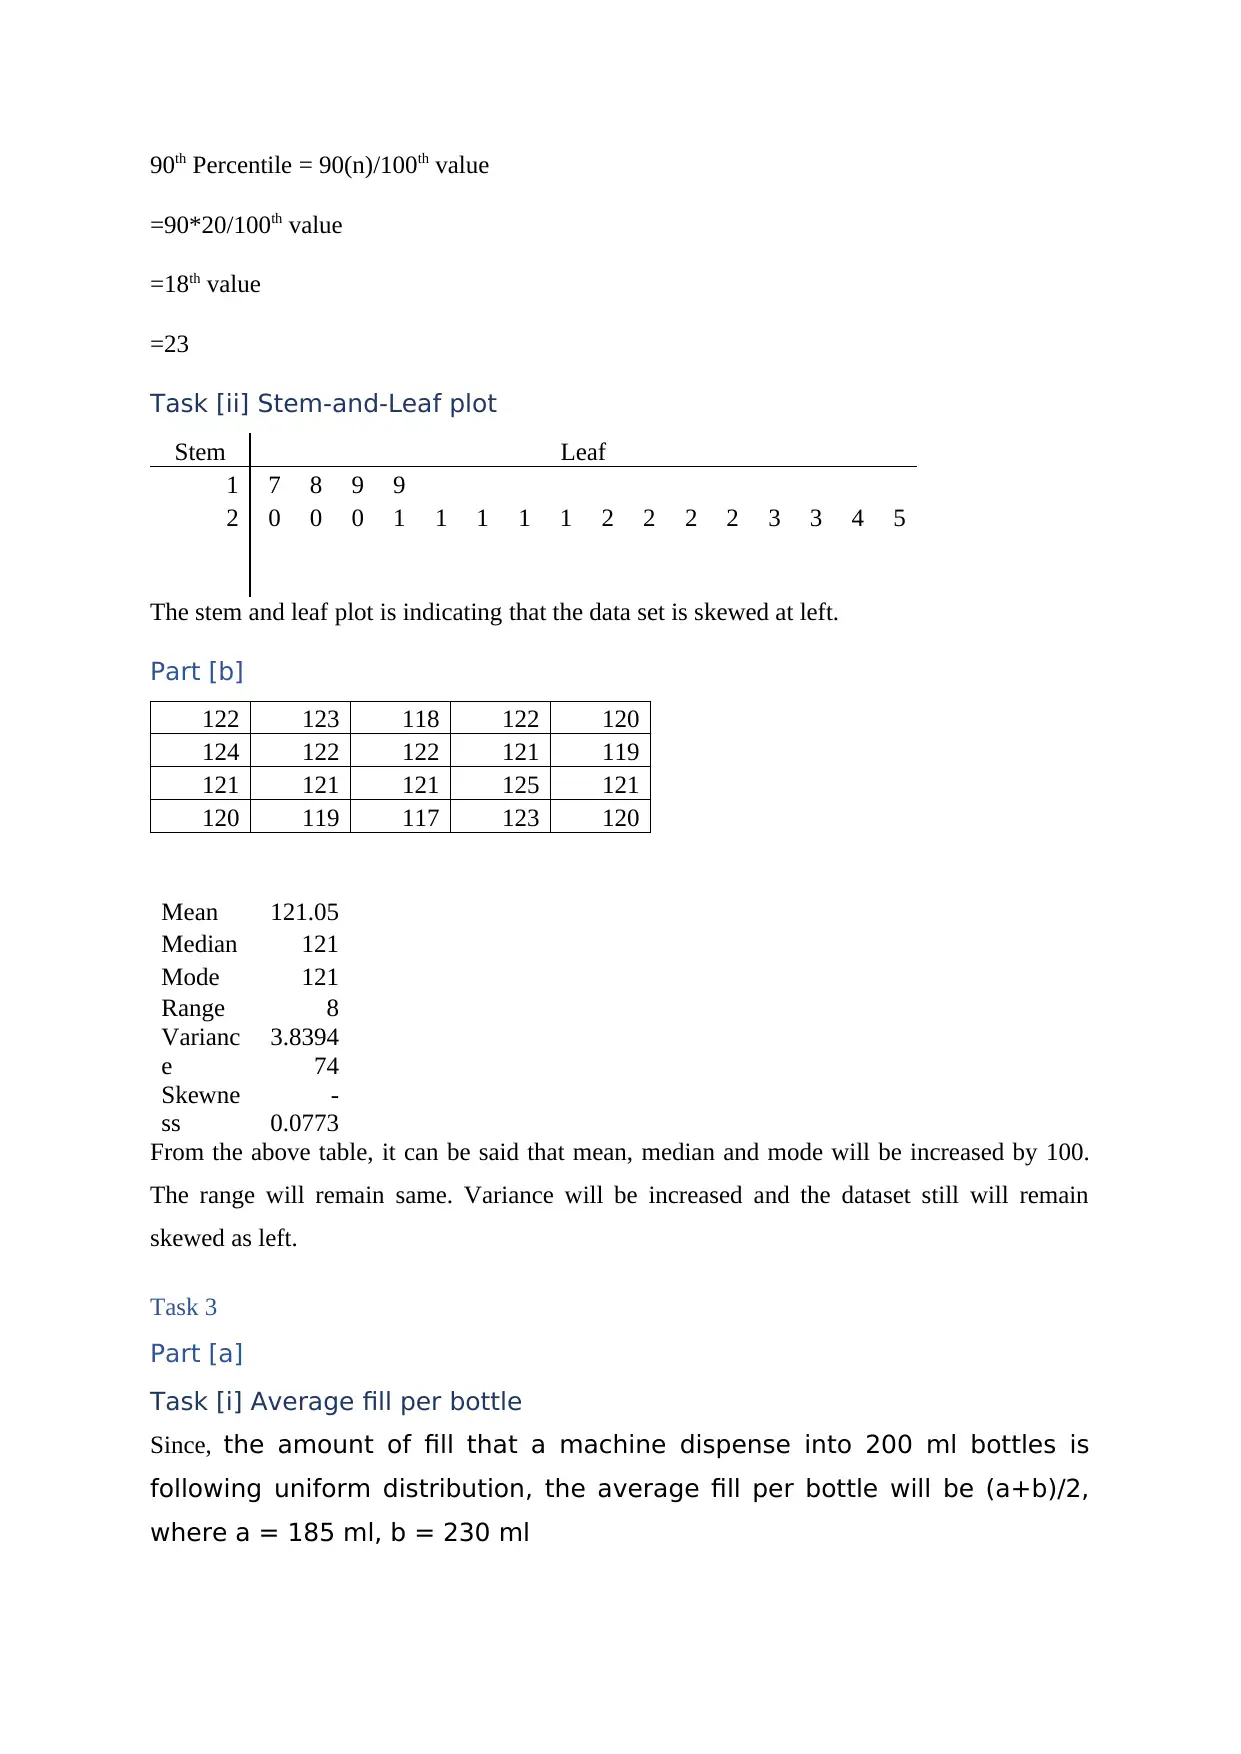
90th Percentile = 90(n)/100th value
=90*20/100th value
=18th value
=23
Task [ii] Stem-and-Leaf plot
Stem Leaf
1 7 8 9 9
2 0 0 0 1 1 1 1 1 2 2 2 2 3 3 4 5
The stem and leaf plot is indicating that the data set is skewed at left.
Part [b]
122 123 118 122 120
124 122 122 121 119
121 121 121 125 121
120 119 117 123 120
Mean 121.05
Median 121
Mode 121
Range 8
Varianc
e
3.8394
74
Skewne
ss
-
0.0773
From the above table, it can be said that mean, median and mode will be increased by 100.
The range will remain same. Variance will be increased and the dataset still will remain
skewed as left.
Task 3
Part [a]
Task [i] Average fill per bottle
Since, the amount of fill that a machine dispense into 200 ml bottles is
following uniform distribution, the average fill per bottle will be (a+b)/2,
where a = 185 ml, b = 230 ml
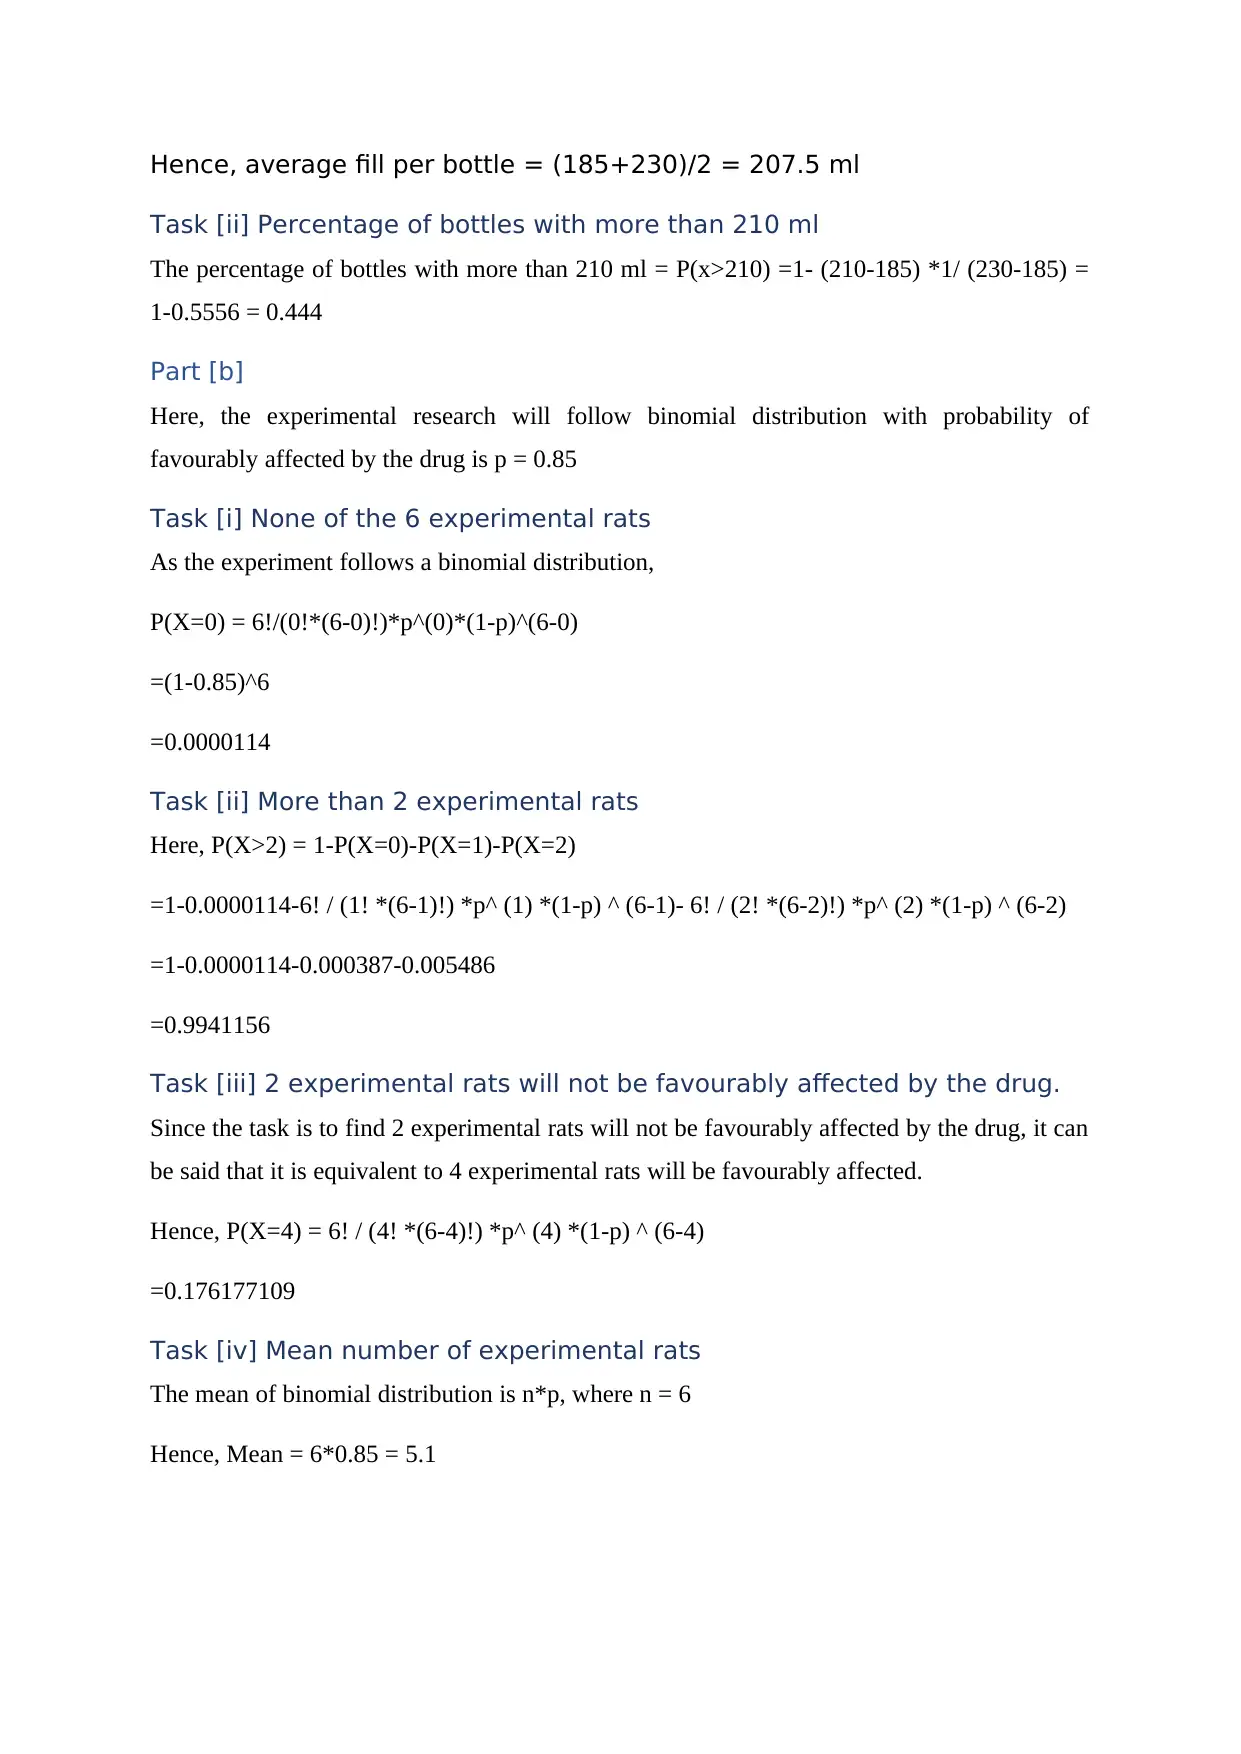
Hence, average fill per bottle = (185+230)/2 = 207.5 ml
Task [ii] Percentage of bottles with more than 210 ml
The percentage of bottles with more than 210 ml = P(x>210) =1- (210-185) *1/ (230-185) =
1-0.5556 = 0.444
Part [b]
Here, the experimental research will follow binomial distribution with probability of
favourably affected by the drug is p = 0.85
Task [i] None of the 6 experimental rats
As the experiment follows a binomial distribution,
P(X=0) = 6!/(0!*(6-0)!)*p^(0)*(1-p)^(6-0)
=(1-0.85)^6
=0.0000114
Task [ii] More than 2 experimental rats
Here, P(X>2) = 1-P(X=0)-P(X=1)-P(X=2)
=1-0.0000114-6! / (1! *(6-1)!) *p^ (1) *(1-p) ^ (6-1)- 6! / (2! *(6-2)!) *p^ (2) *(1-p) ^ (6-2)
=1-0.0000114-0.000387-0.005486
=0.9941156
Task [iii] 2 experimental rats will not be favourably affected by the drug.
Since the task is to find 2 experimental rats will not be favourably affected by the drug, it can
be said that it is equivalent to 4 experimental rats will be favourably affected.
Hence, P(X=4) = 6! / (4! *(6-4)!) *p^ (4) *(1-p) ^ (6-4)
=0.176177109
Task [iv] Mean number of experimental rats
The mean of binomial distribution is n*p, where n = 6
Hence, Mean = 6*0.85 = 5.1
⊘ This is a preview!⊘
Do you want full access?
Subscribe today to unlock all pages.
Trusted by 1+ million students worldwide
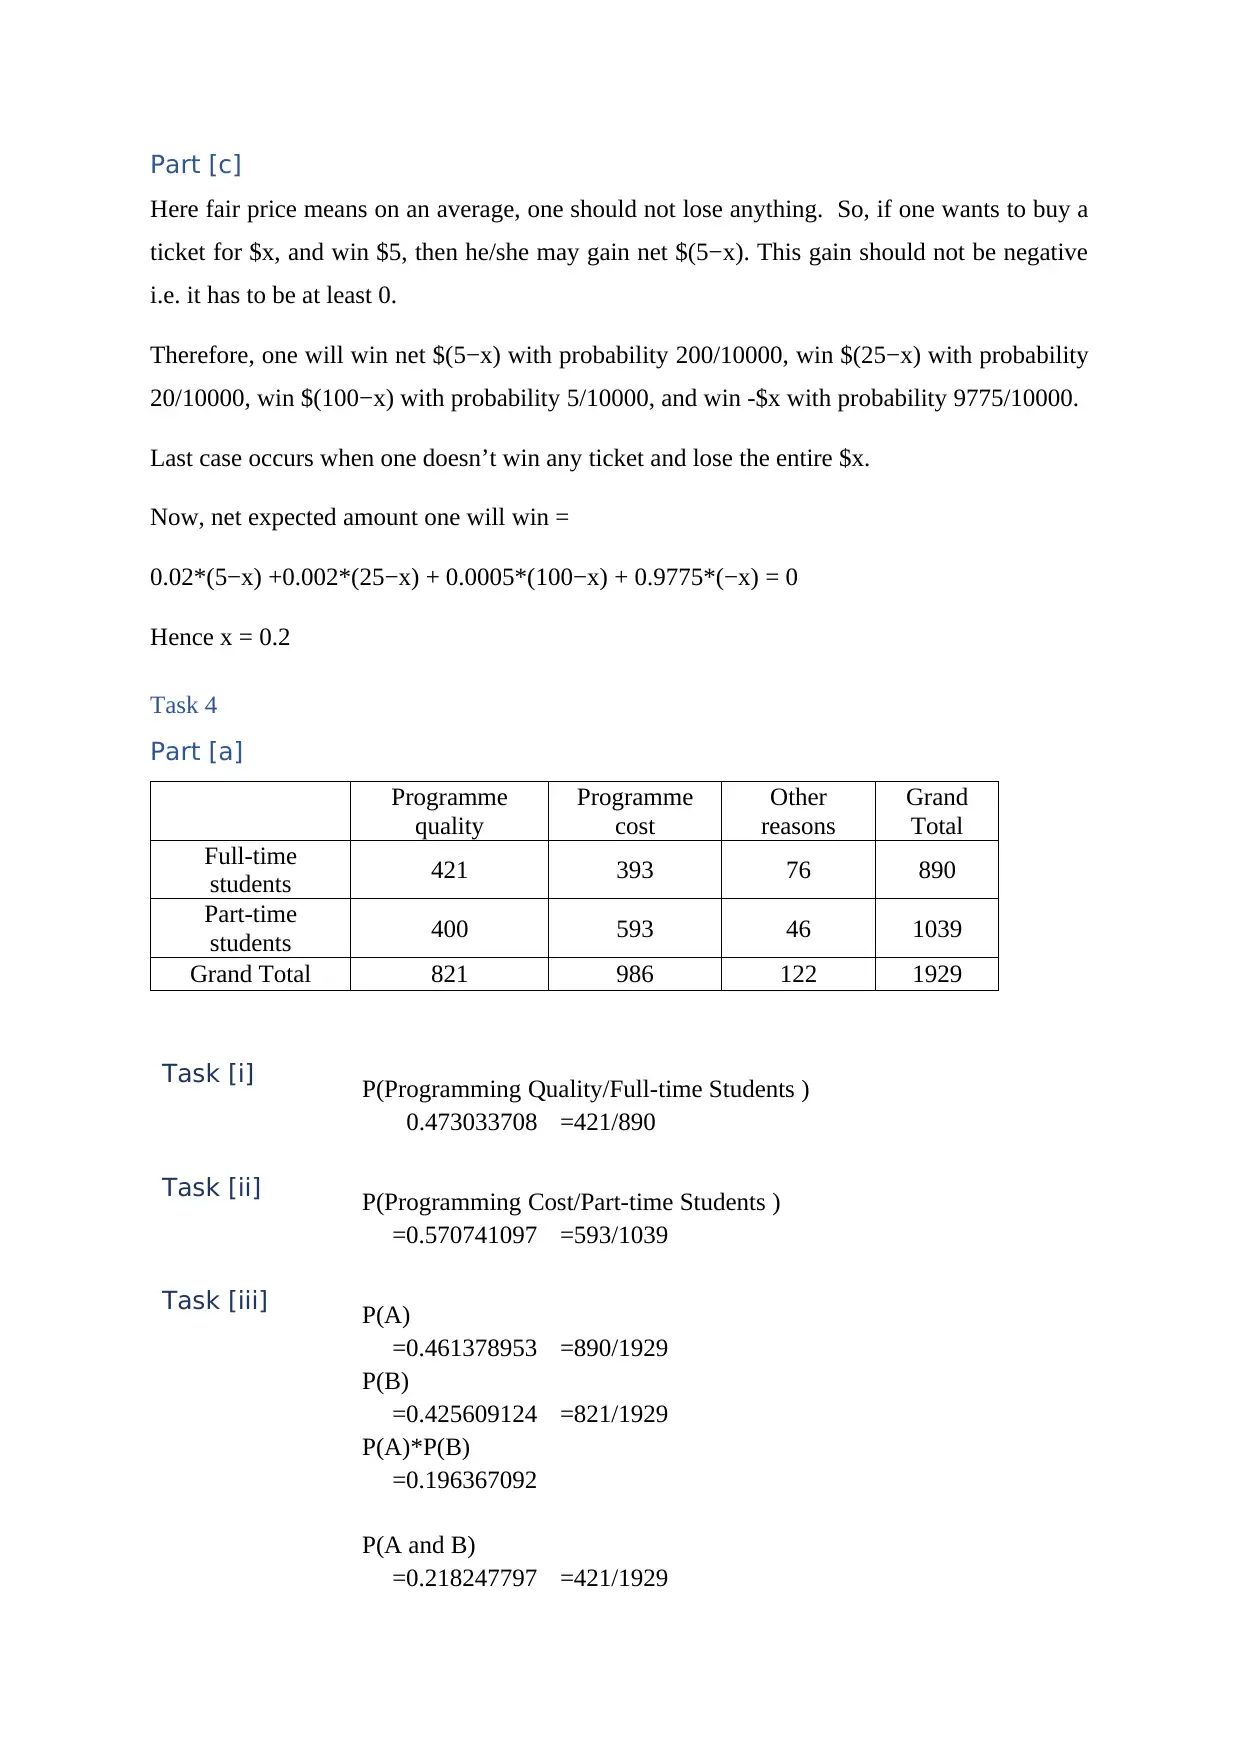
Part [c]
Here fair price means on an average, one should not lose anything. So, if one wants to buy a
ticket for $x, and win $5, then he/she may gain net $(5−x). This gain should not be negative
i.e. it has to be at least 0.
Therefore, one will win net $(5−x) with probability 200/10000, win $(25−x) with probability
20/10000, win $(100−x) with probability 5/10000, and win -$x with probability 9775/10000.
Last case occurs when one doesn’t win any ticket and lose the entire $x.
Now, net expected amount one will win =
0.02*(5−x) +0.002*(25−x) + 0.0005*(100−x) + 0.9775*(−x) = 0
Hence x = 0.2
Task 4
Part [a]
Programme
quality
Programme
cost
Other
reasons
Grand
Total
Full-time
students 421 393 76 890
Part-time
students 400 593 46 1039
Grand Total 821 986 122 1929
Task [i] P(Programming Quality/Full-time Students )
0.473033708 =421/890
Task [ii] P(Programming Cost/Part-time Students )
=0.570741097 =593/1039
Task [iii] P(A)
=0.461378953 =890/1929
P(B)
=0.425609124 =821/1929
P(A)*P(B)
=0.196367092
P(A and B)
=0.218247797 =421/1929
Paraphrase This Document
Need a fresh take? Get an instant paraphrase of this document with our AI Paraphraser
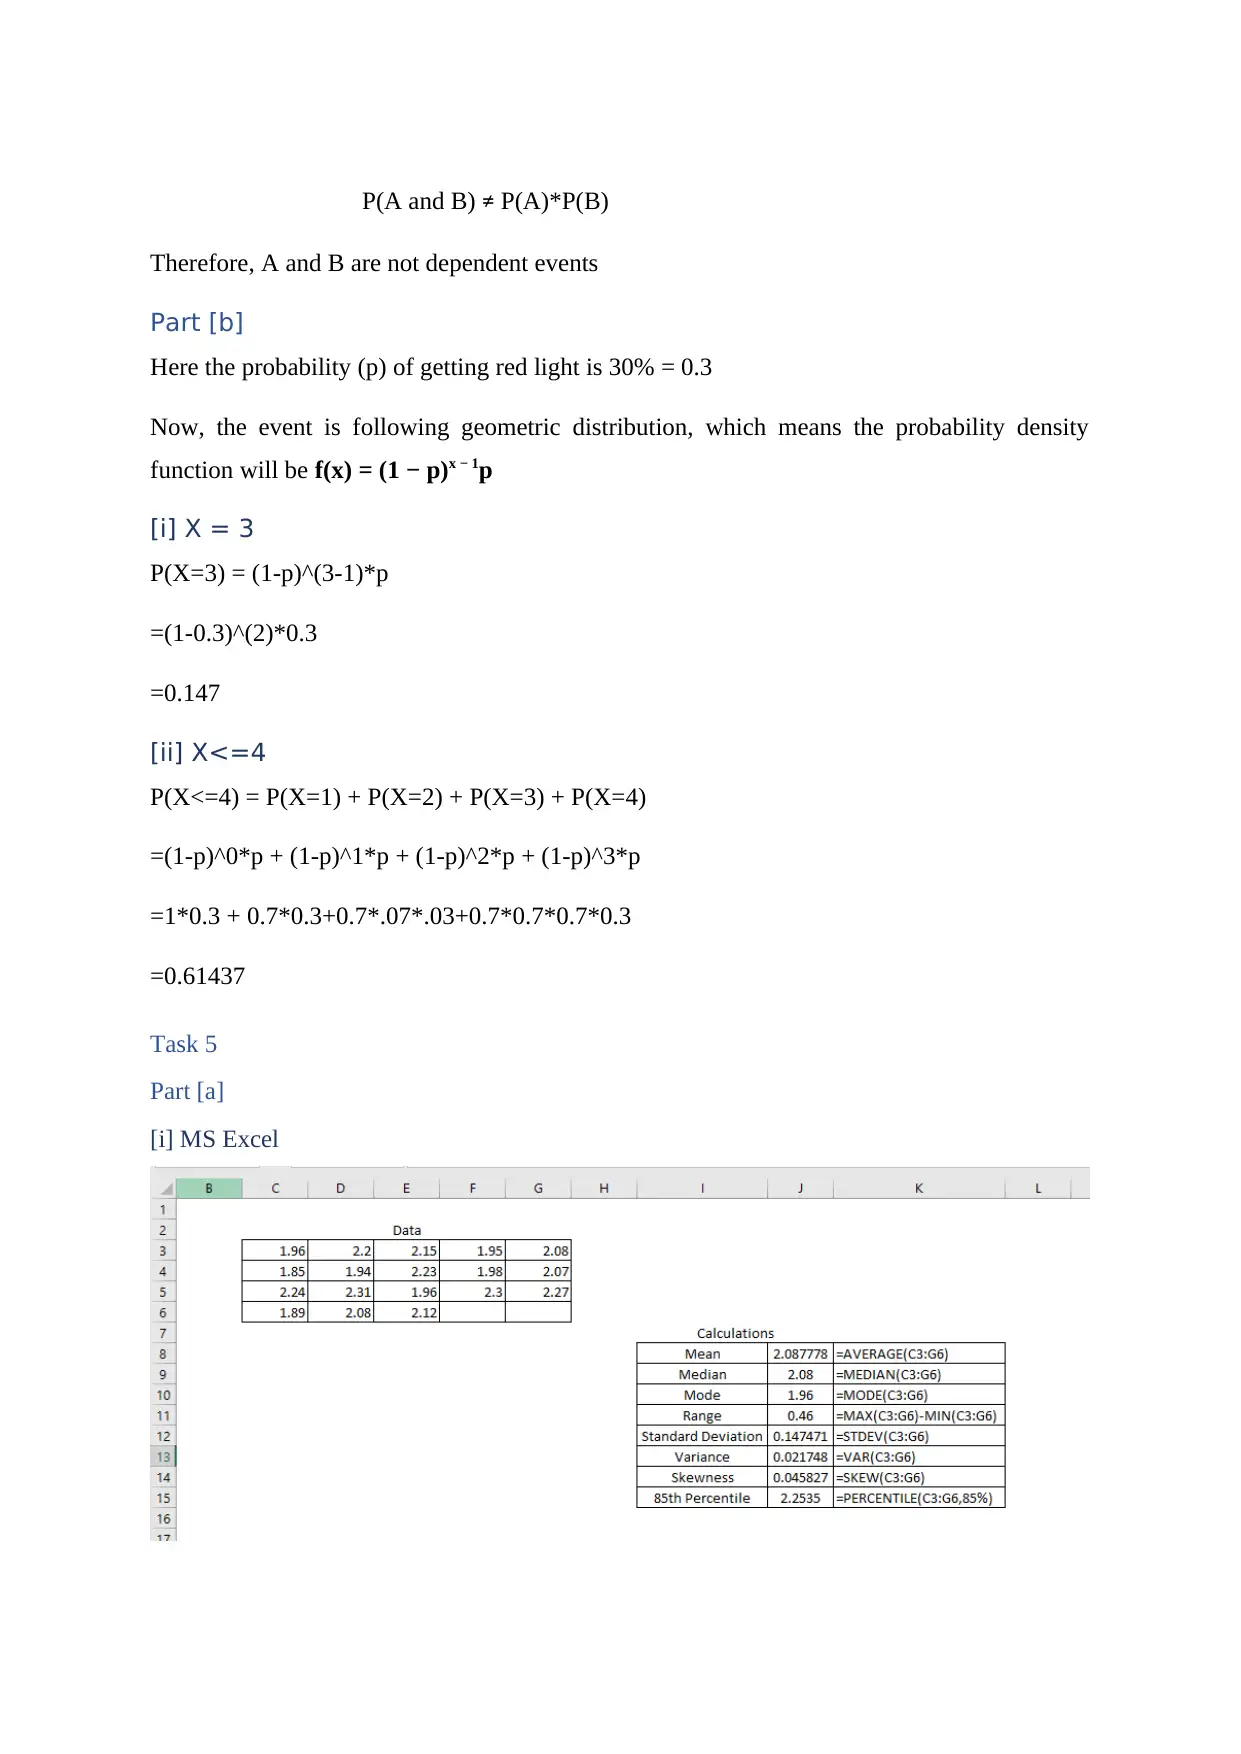
P(A and B) ≠ P(A)*P(B)
Therefore, A and B are not dependent events
Part [b]
Here the probability (p) of getting red light is 30% = 0.3
Now, the event is following geometric distribution, which means the probability density
function will be f(x) = (1 − p)x − 1p
[i] X = 3
P(X=3) = (1-p)^(3-1)*p
=(1-0.3)^(2)*0.3
=0.147
[ii] X<=4
P(X<=4) = P(X=1) + P(X=2) + P(X=3) + P(X=4)
=(1-p)^0*p + (1-p)^1*p + (1-p)^2*p + (1-p)^3*p
=1*0.3 + 0.7*0.3+0.7*.07*.03+0.7*0.7*0.7*0.3
=0.61437
Task 5
Part [a]
[i] MS Excel
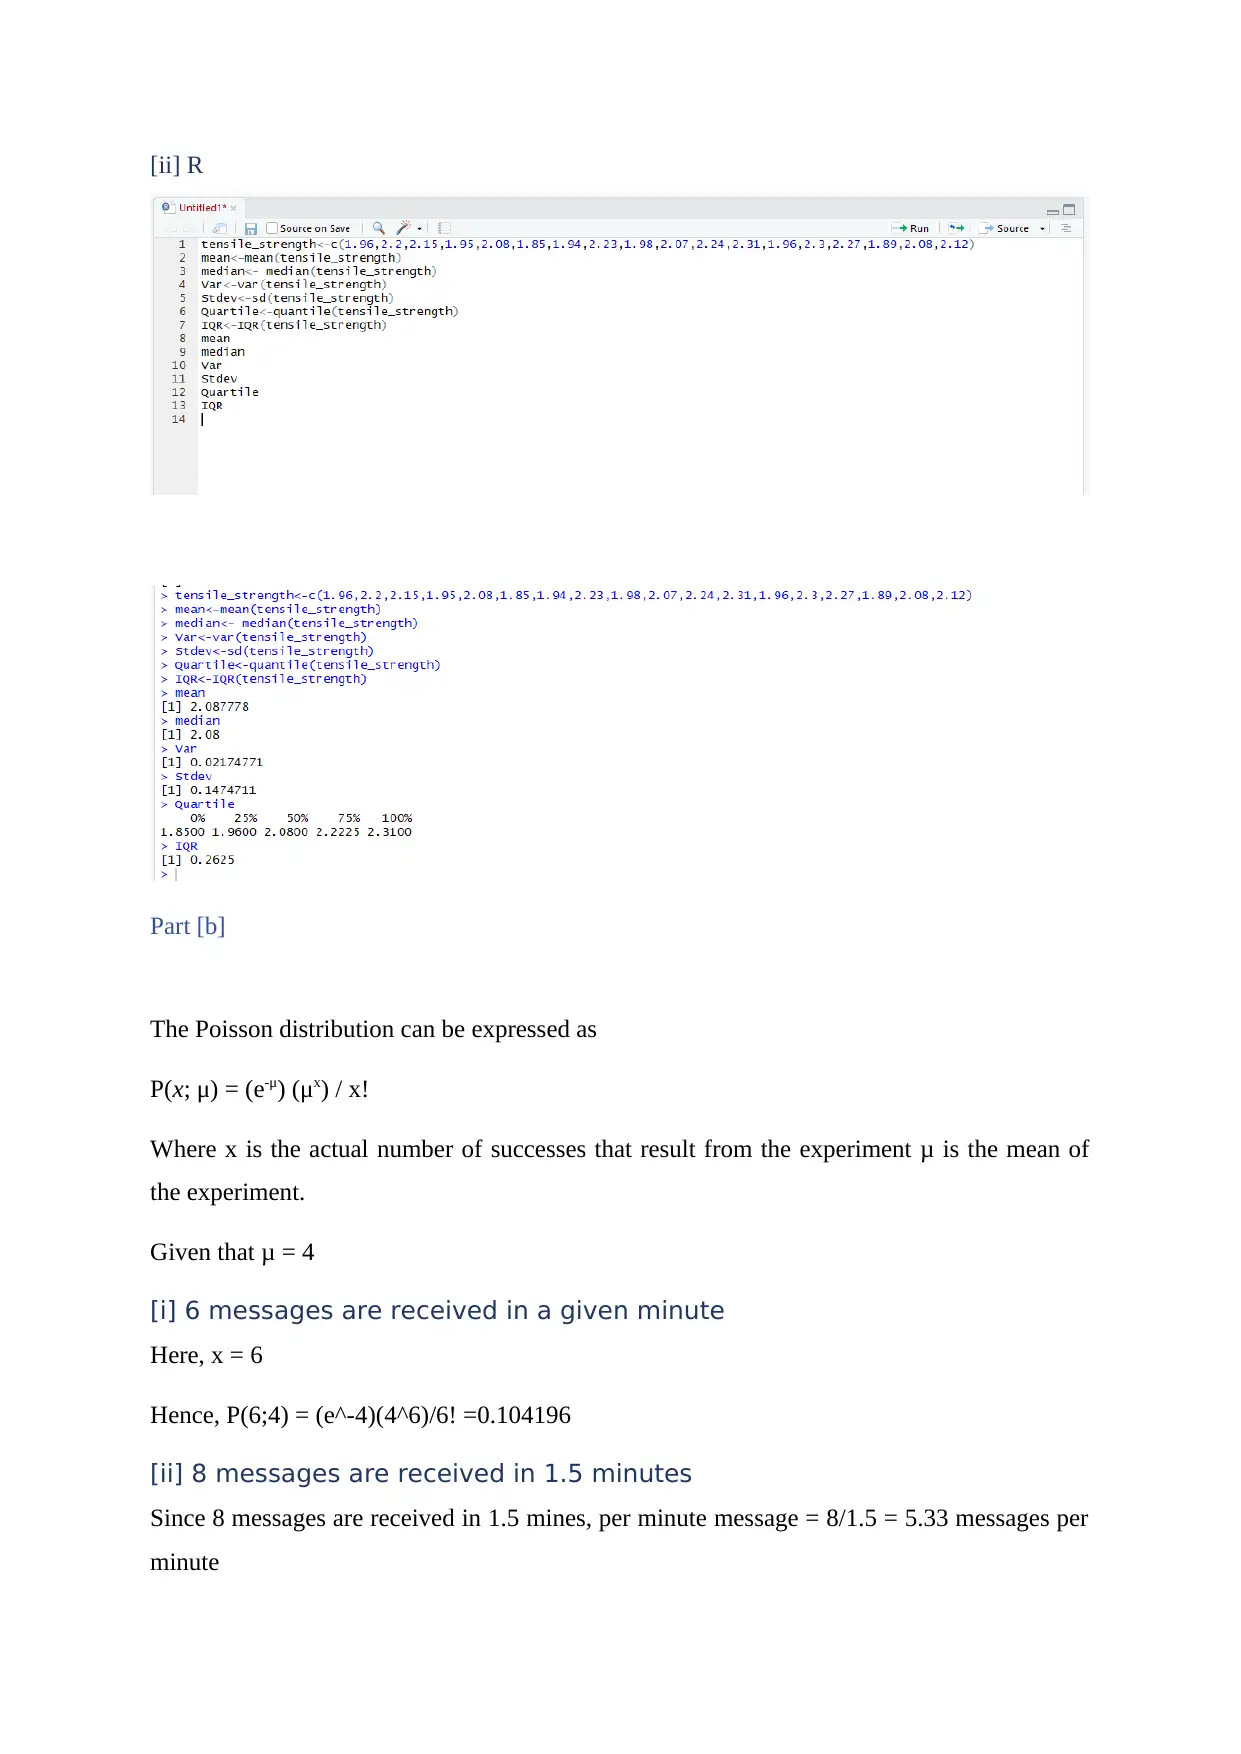
[ii] R
Part [b]
The Poisson distribution can be expressed as
P(x; μ) = (e-μ) (μx) / x!
Where x is the actual number of successes that result from the experiment μ is the mean of
the experiment.
Given that μ = 4
[i] 6 messages are received in a given minute
Here, x = 6
Hence, P(6;4) = (e^-4)(4^6)/6! =0.104196
[ii] 8 messages are received in 1.5 minutes
Since 8 messages are received in 1.5 mines, per minute message = 8/1.5 = 5.33 messages per
minute
⊘ This is a preview!⊘
Do you want full access?
Subscribe today to unlock all pages.
Trusted by 1+ million students worldwide
1 out of 14
Related Documents


Your All-in-One AI-Powered Toolkit for Academic Success.
+13062052269
info@desklib.com
Available 24*7 on WhatsApp / Email
![[object Object]](/_next/static/media/star-bottom.7253800d.svg)
Unlock your academic potential
Copyright © 2020–2026 A2Z Services. All Rights Reserved. Developed and managed by ZUCOL.