Statistics 101: Multiple Linear Regression Analysis Report

Verified

Added on  2022/10/14

|9
|1799
|12
Report
AI Summary
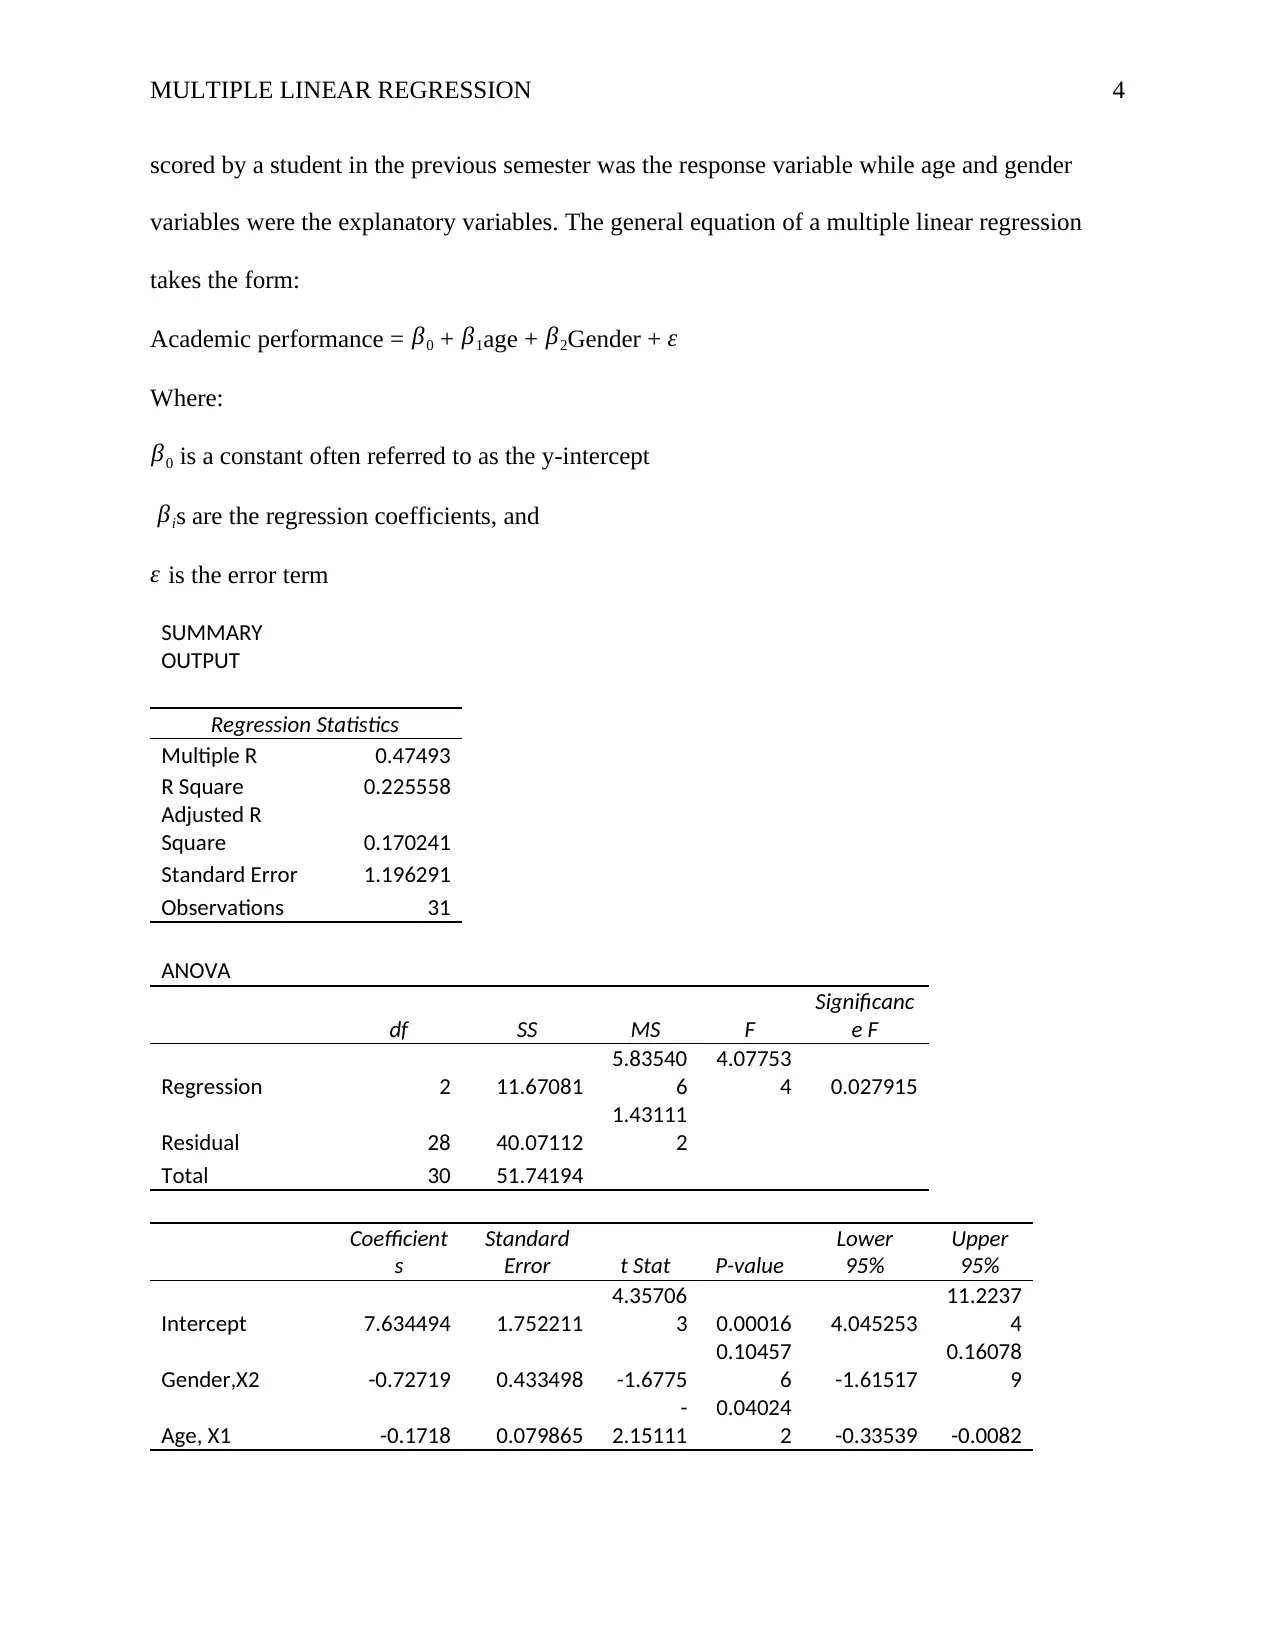
This report presents a multiple linear regression analysis conducted to determine the impact of age and gender on students' academic performance. The study utilized data collected from 31 students in a statistics course, including their age, gender, and previous semester grades. The analysis, performed using Microsoft Excel, established a multiple linear regression equation with academic performance (grade) as the response variable and age and gender as explanatory variables. The results revealed a negative correlation between age and academic performance, indicating that older students tend to have lower grades, while gender showed no significant effect at the 5% significance level. The coefficient of determination indicated that the model explained 22.56% of the variability in academic performance, and the correlation coefficient was 0.4749. The study concludes that age significantly affects academic performance, while gender does not, although the data collection method had limitations. The student also discusses the data collection method and the limitations of the study.
Document Page
Running head: MULTIPLE LINEAR REGRESSION 1
Multiple Linear Regression
Do Age And Gender Affect Students’ Performance?
Student’s Name
Institution
tabler-icon-diamond-filled.svg

Paraphrase This Document

Need a fresh take? Get an instant paraphrase of this document with our AI Paraphraser
Document Page
MULTIPLE LINEAR REGRESSION 2
Introduction
The goal of every student is to perform exemplarily at the end of year exams. However,
not every student performs to his or her expectations for one or another reason.
Underperformance could be as a result of either internal or external reasons. Factors affecting
students’ performance in academics in college is a subject of interest to man scholars and
researchers. Previous researches have attempted to identify loopholes in the current U.S
education system proposing possible recommendations to improve the system. The reason
behind identifying loophole in the education system is to recommend suitable corrective
measures to improve the system.
Different research studies show reveal that gender and age of a student significantly
affect students’ academic performance. Female students perform better in college examinations
compared to their male counterparts (Perkins, Kleiner, Roey & Brown, 2014). Excellent
performance of female students is attributed to high commitment in college studies. Gallagher &
Kaufman (2015) conducted a similar survey to compare the performance of males and female
students in science-related subjects. The study reveals that male students perform much better in
technical subjects as compared to female students. Datu & Yang (2019) conducted a similar
study conducted to find out the relationship between age and academic performance of a student.
The study revealed that younger students performed better than older students. The question of
age and gender effect on academic performance is the subject of interest and requires further
serious attention; therefore, this study aim at establishing the relationship between age, gender,
and academic performance.
Document Page
MULTIPLE LINEAR REGRESSION 3
Hypothesis statement
Null hypothesis: the age and gender of a student significantly affects students’ academic
performance
Alternative hypothesis: age and gender have no significant effect on students’ academic
performance.
Methodology
Data
The research study utilized first-hand data collected from 31 students taking a statistics
course. A total of 31 students entering the lecture hall were randomly sampled. Therefore, a
convenient sampling method was utilized to sample study participants. A study questionnaire
was developed to collect data, and the study participants invited to participate. Before
participation, the study participants were briefed the objective of the study, then later signing an
informed consent letter.
Moreover, the study participants were assured of their confidentiality before filling in the
questionnaire. They participants) were required to record their age, gender, and previous
semester overall grade. Since the collected data was quantitative and qualitative, the coding was
appropriately done to convert the qualitative data to quantitative data. For the grades, “A” was
assigned a value of “5”, B assigned “4”, grade “C” assigned a value of “3”, grade D assigned a
value of “2”, and the F assigned to a value of “1”. Also, the male was assigned a value of “1” and
female gender assigned a value of “0”.
Analysis
To determine the relationship between age, gender, and academic performance of a
student, multiple linear regression is developed using Microsoft excel. The academic grade
Document Page
MULTIPLE LINEAR REGRESSION 4
scored by a student in the previous semester was the response variable while age and gender
variables were the explanatory variables. The general equation of a multiple linear regression
takes the form:
Academic performance = β0 + β1age + β2Gender + ε
Where:
β0 is a constant often referred to as the y-intercept
βis are the regression coefficients, and
ε is the error term
SUMMARY
OUTPUT
Regression Statistics
Multiple R 0.47493
R Square 0.225558
Adjusted R
Square 0.170241
Standard Error 1.196291
Observations 31
ANOVA
df SS MS F
Significanc
e F
Regression 2 11.67081
5.83540
6
4.07753
4 0.027915
Residual 28 40.07112
1.43111
2
Total 30 51.74194
Coefficient
s
Standard
Error t Stat P-value
Lower
95%
Upper
95%
Intercept 7.634494 1.752211
4.35706
3 0.00016 4.045253
11.2237
4
Gender,X2 -0.72719 0.433498 -1.6775
0.10457
6 -1.61517
0.16078
9
Age, X1 -0.1718 0.079865
-
2.15111
0.04024
2 -0.33539 -0.0082
tabler-icon-diamond-filled.svg

Paraphrase This Document

Need a fresh take? Get an instant paraphrase of this document with our AI Paraphraser
Document Page
MULTIPLE LINEAR REGRESSION 5
Results, Interpretation, and Discussion
From the multiple linear regression output; the estimated regression equation is fund as:
Academic performance (Grade)= 7.6345-0.7272*Age -0.1718*Gender
Examining the estimated regression equation above, a negative linear relationship exists between
age, gender, and academic performance because the coefficients of the independent variables age
and gender were both negative. Therefore, a one-unit increase in age decreases academic
performance measured in grade by 0.7272 and vice versa. Even though the estimated regression
equation does not estimate the degree of relationship between the explanatory variable and
response variable, regression statistics such as the coefficient of determination and correlation
coefficient do.
Moreover, the corresponding p-values for age and gender variables are 0.040242 and
0.104576, respectively, at 5% significance level. If hypothesis testing, if the observed p-value is
less than the significance level, reject the null hypothesis otherwise, fail to reject (Davies, 2017;
Aalabaf-Sabaghi, 2011). Moreover, if the test statistic is greater the than the critical value, reject
null hypothesis otherwise fail to reject the null hypothesis (Hartmann, 2016; Lockow, 2012).
Since the corresponding p-value for age is less than 0.05, the variable age significantly affects
the academic performance of a student. In contrast, the p-value of variable gender is greater than
0.05; thus, the variable age does not affect the academic performance of a student significantly at
5% significance level.
The coefficient of determination is 0.2256 indicates that the explanatory variables (age
and gender) explain 22.56% variability of the response variable (academic performance).
Additionally, the correlation coefficient is estimated at 0.4749, indicating that the estimated
regression model explains 47.49% relationship between age, gender, and academic performance.
Document Page
MULTIPLE LINEAR REGRESSION 6
Correlation coefficient above 0.7 signifies a strong linear relationship between response and
explanatory variables (Behara & BarCharts, 2014; Hochkirchen, 2011). Lastly, at α =0.05, the
observed p-value (0.0279) is less than 0.05; thus, the estimated regression model is statistically
significant.
Estimates
Linear in parameters
16 18 20 22 24 26 28
0
1
2
3
4
5
6
Grade Vs Age
Age
Grade
From the trend of the above scatterplot, there is a weak linear relationship between grade and age
of a student because there are many outliers from the line of best fit.
0 0.2 0.4 0.6 0.8 1 1.2
0
1
2
3
4
5
6
Grade Vs Gender
Gender
Grade
Document Page
MULTIPLE LINEAR REGRESSION 7
Looking at the scatterplot above, there seems to be a clear trend. It is hard to discern if this trend
is linear but it looks reasonable given the data.
Random Sampling
This data was not sample randomly. Instead, convenience sampling was utilized for this study.
Therefore, we are unsure where the sample is a true reflection of the entire thus we cannot make
generalizations of the study. First, the data was collected from one college therefore, the results
could not be used for high school students. Secondly, the possible bias would arise where a
participant gives incorrect grade scored in the previous semester. Ideally, sampling of college
campuses and high schools from different locations would minimize possible bias and allow the
researcher to make generalizations.
Sample Variation in Explanatory Variable
The data has wide range of independent variables and a wide range of grades. Therefore,
it is statistically correct to find out the effect of explanatory variables on student grades.
Zero mean of the error term conditional on the independent variables
In reality, every researcher expects zero correlation between error term, explanatory, and
response variables. However, student performance in academics is not only influenced by age
and gender but many other external factors. One of the many factors is the intelligence quotient
(IQ) of a student. Moreover, IQ might also vary from male to female gender. Therefore,
estimates might not be very correct.
Conclusion
The study findings show that age significantly affects academic performance, while
variable gender does not affect the academic performance of a student significantly. Also, the
older a student, the lower the academic performance while the younger a student, the better the
tabler-icon-diamond-filled.svg

Paraphrase This Document

Need a fresh take? Get an instant paraphrase of this document with our AI Paraphraser
Document Page
MULTIPLE LINEAR REGRESSION 8
academic performance. Gender parity between students in colleges does affect the relationship
between students and academic performance Females are known to be committed to studying
than men, while men are known for their social nature. In a nutshell, academic performance and
age are negatively correlated.
Document Page
MULTIPLE LINEAR REGRESSION 9
References
Aalabaf-Sabaghi, M. (2011) ‘Applied Statistics for Business and Economics’, Journal of the
Royal Statistical Society: Series A (Statistics in Society), 174(3), p. 848. doi:
10.1111/j.1467-985X.2011.00709_11.x.
Behara, R. and BarCharts, I. (2014) Business Statistics. [Boca Raton, FL]: QuickStudy Reference
Guides (Quick Study Business). Available at: http://search.ebscohost.com/login.aspx?
direct=true&db=nlebk&AN=1534295&site=ehost-live (Accessed: 6 August 2019).
Datu, J., & Yang, W. (2019). Academic buoyancy, academic motivation, and academic
achievement among filipino high school students. Current Psychology. doi:
10.1007/s12144-019-00358-y
Davies, A. (2017), Understanding Statistics : An Introduction, Libertarianism.org Press,
Washington, D.C., viewed 6 August 2019, <http://search.ebscohost.com/login.aspx?
direct=true&db=nlebk&AN=1667844&site=ehost-live>.
Gallagher, A. M., & Kaufman, J. C. (2015). Gender differences in mathematics: What we know
and what we need to know
Hartmann, H. (2016) ‘Statistics for Engineers’, Communications of the ACM, 59(7), pp. 58–66.
doi: 10.1145/2890780.
Hochkirchen, T. (2011) ‘Applied Statistics for Engineers and Physical Scientists’, Journal of the
Royal Statistical Society: Series A (Statistics in Society),
Lockow, E. (2012) ‘S. J. Morrison: Statistics for Engineers: an introduction’, Statistical Papers,
53(1), pp. 245–246. doi: 10.1007/s00362-010-0358-x.
chevron_up_icon
1 out of 9
circle_padding
hide_on_mobile
zoom_out_icon