Multiple Linear Regression Analysis of Employee Engagement

Verified

Added on  2019/09/18

|8
|1113
|382
Homework Assignment
AI Summary
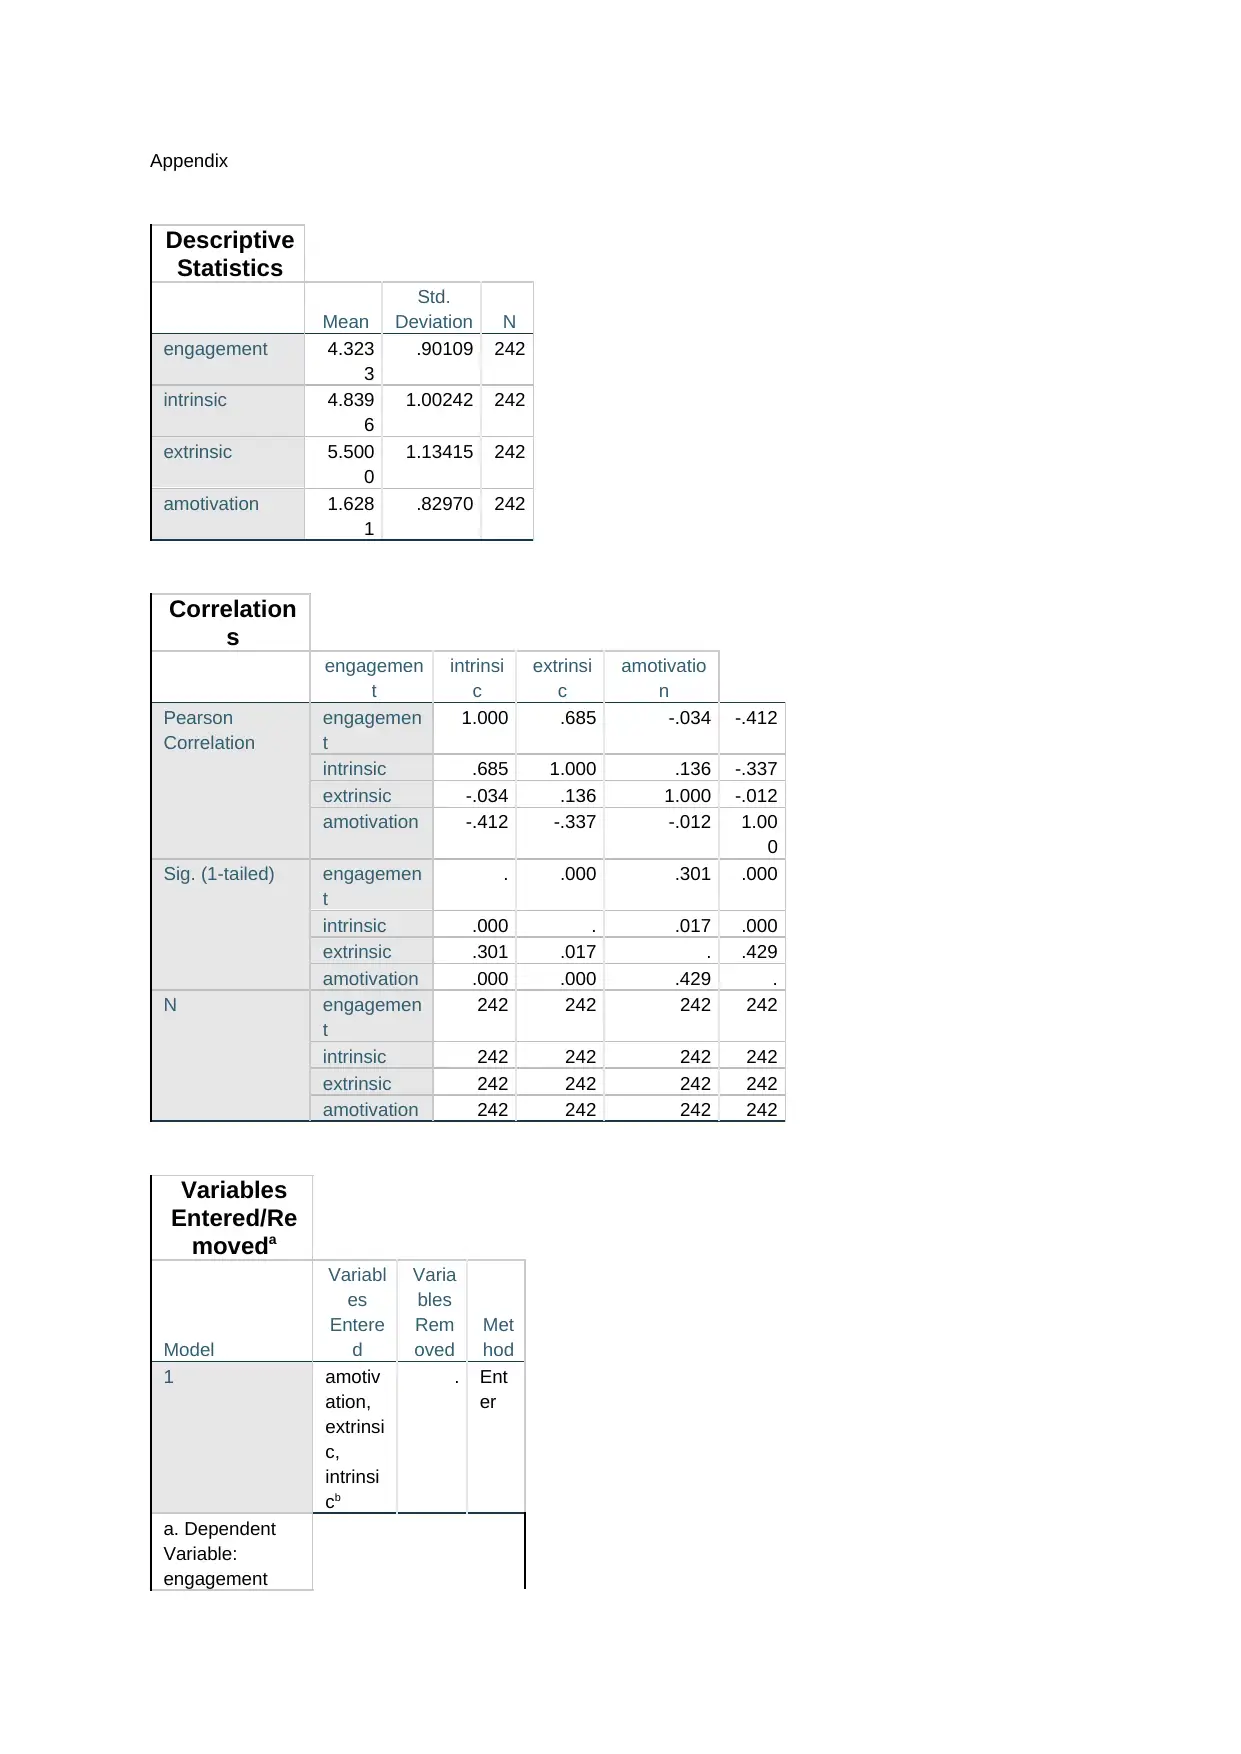
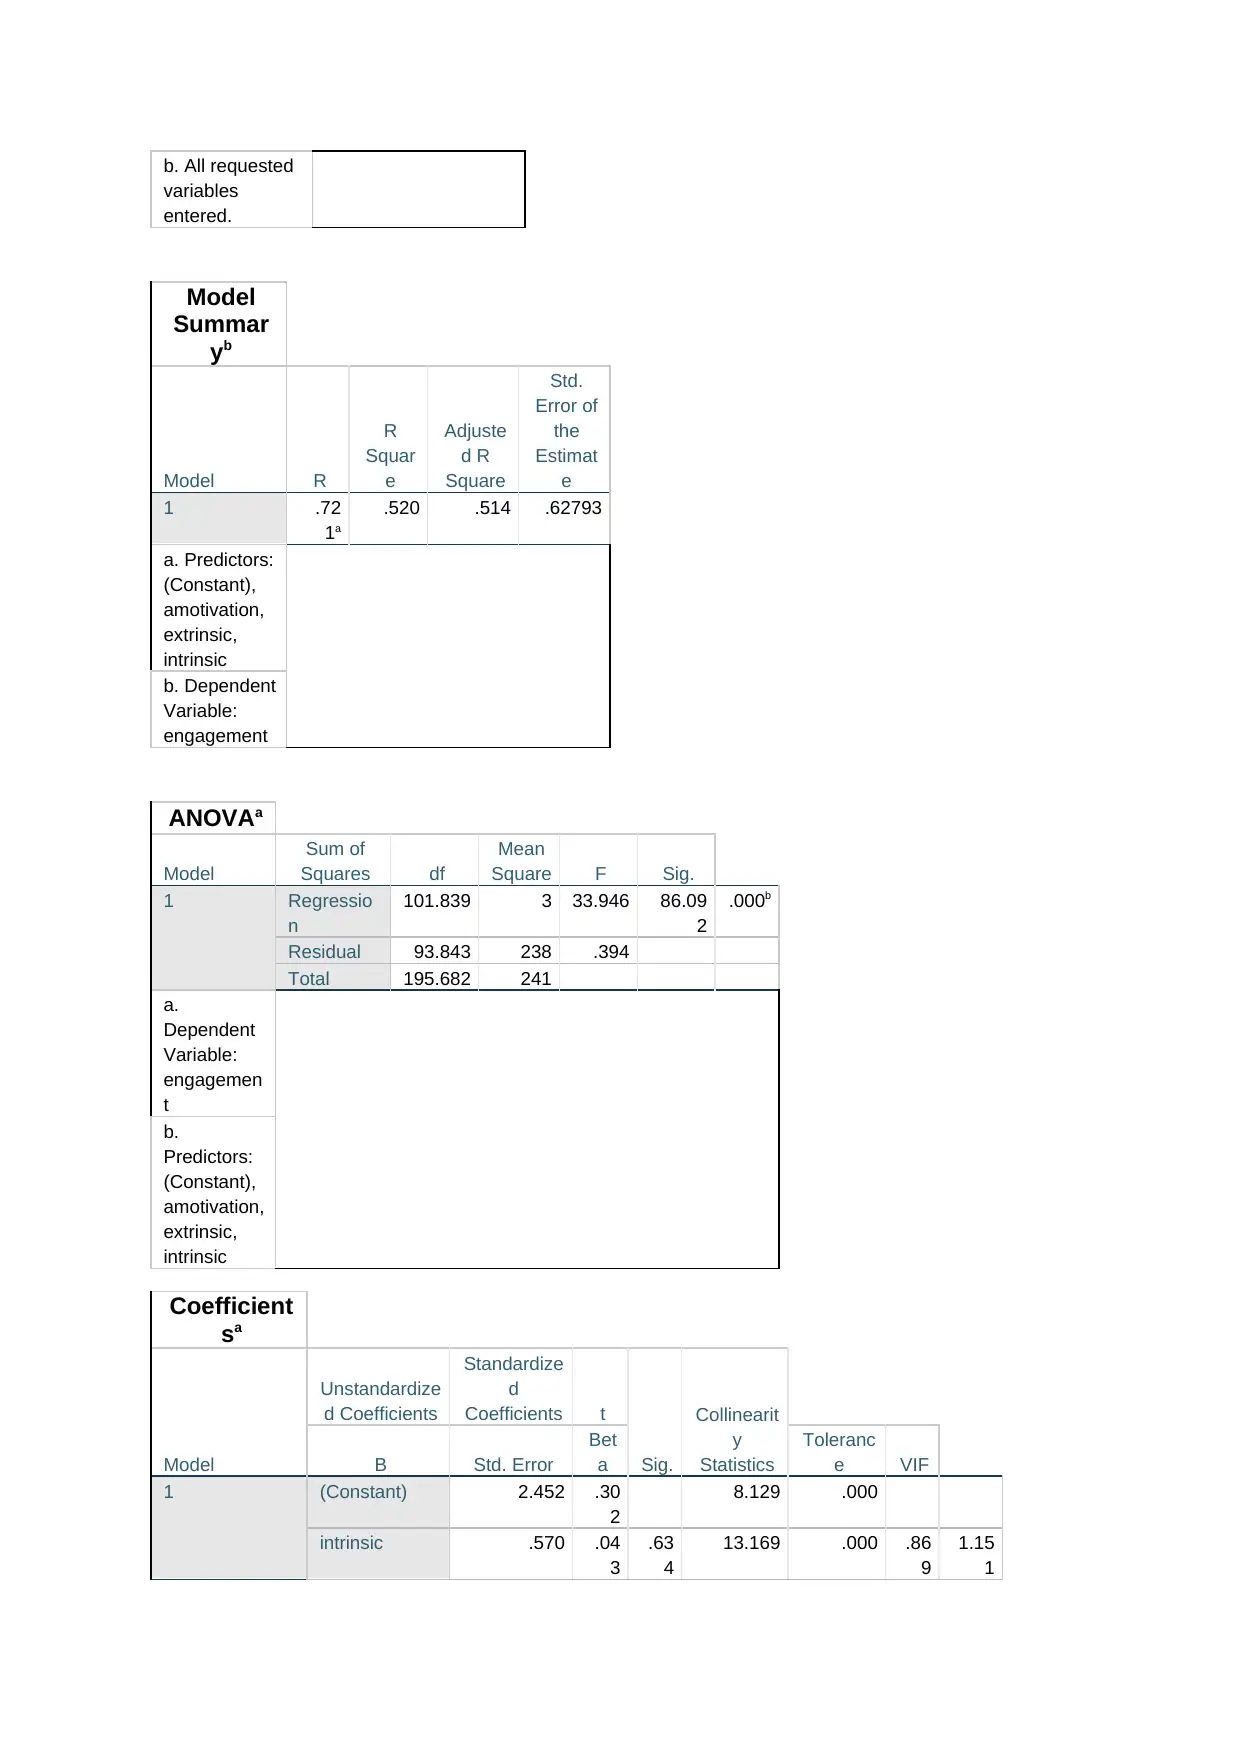
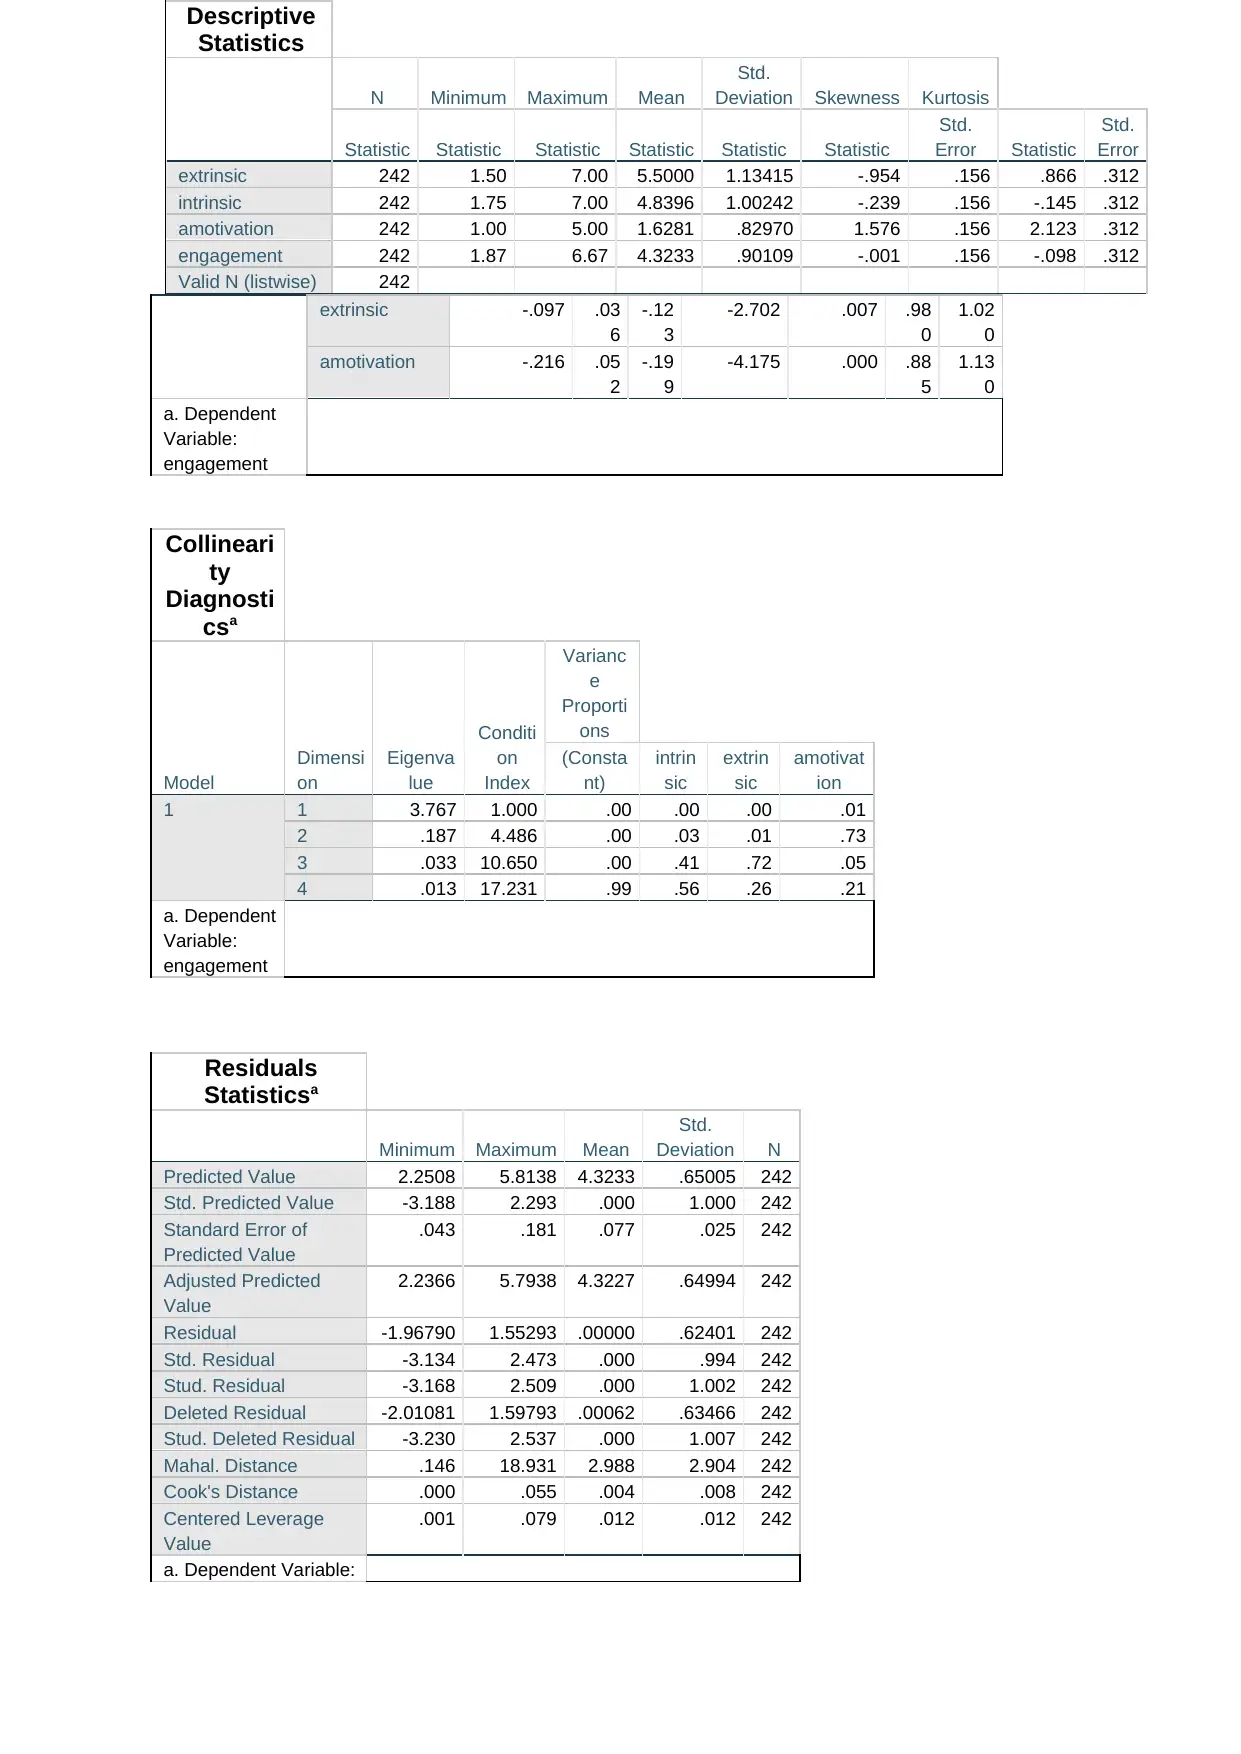
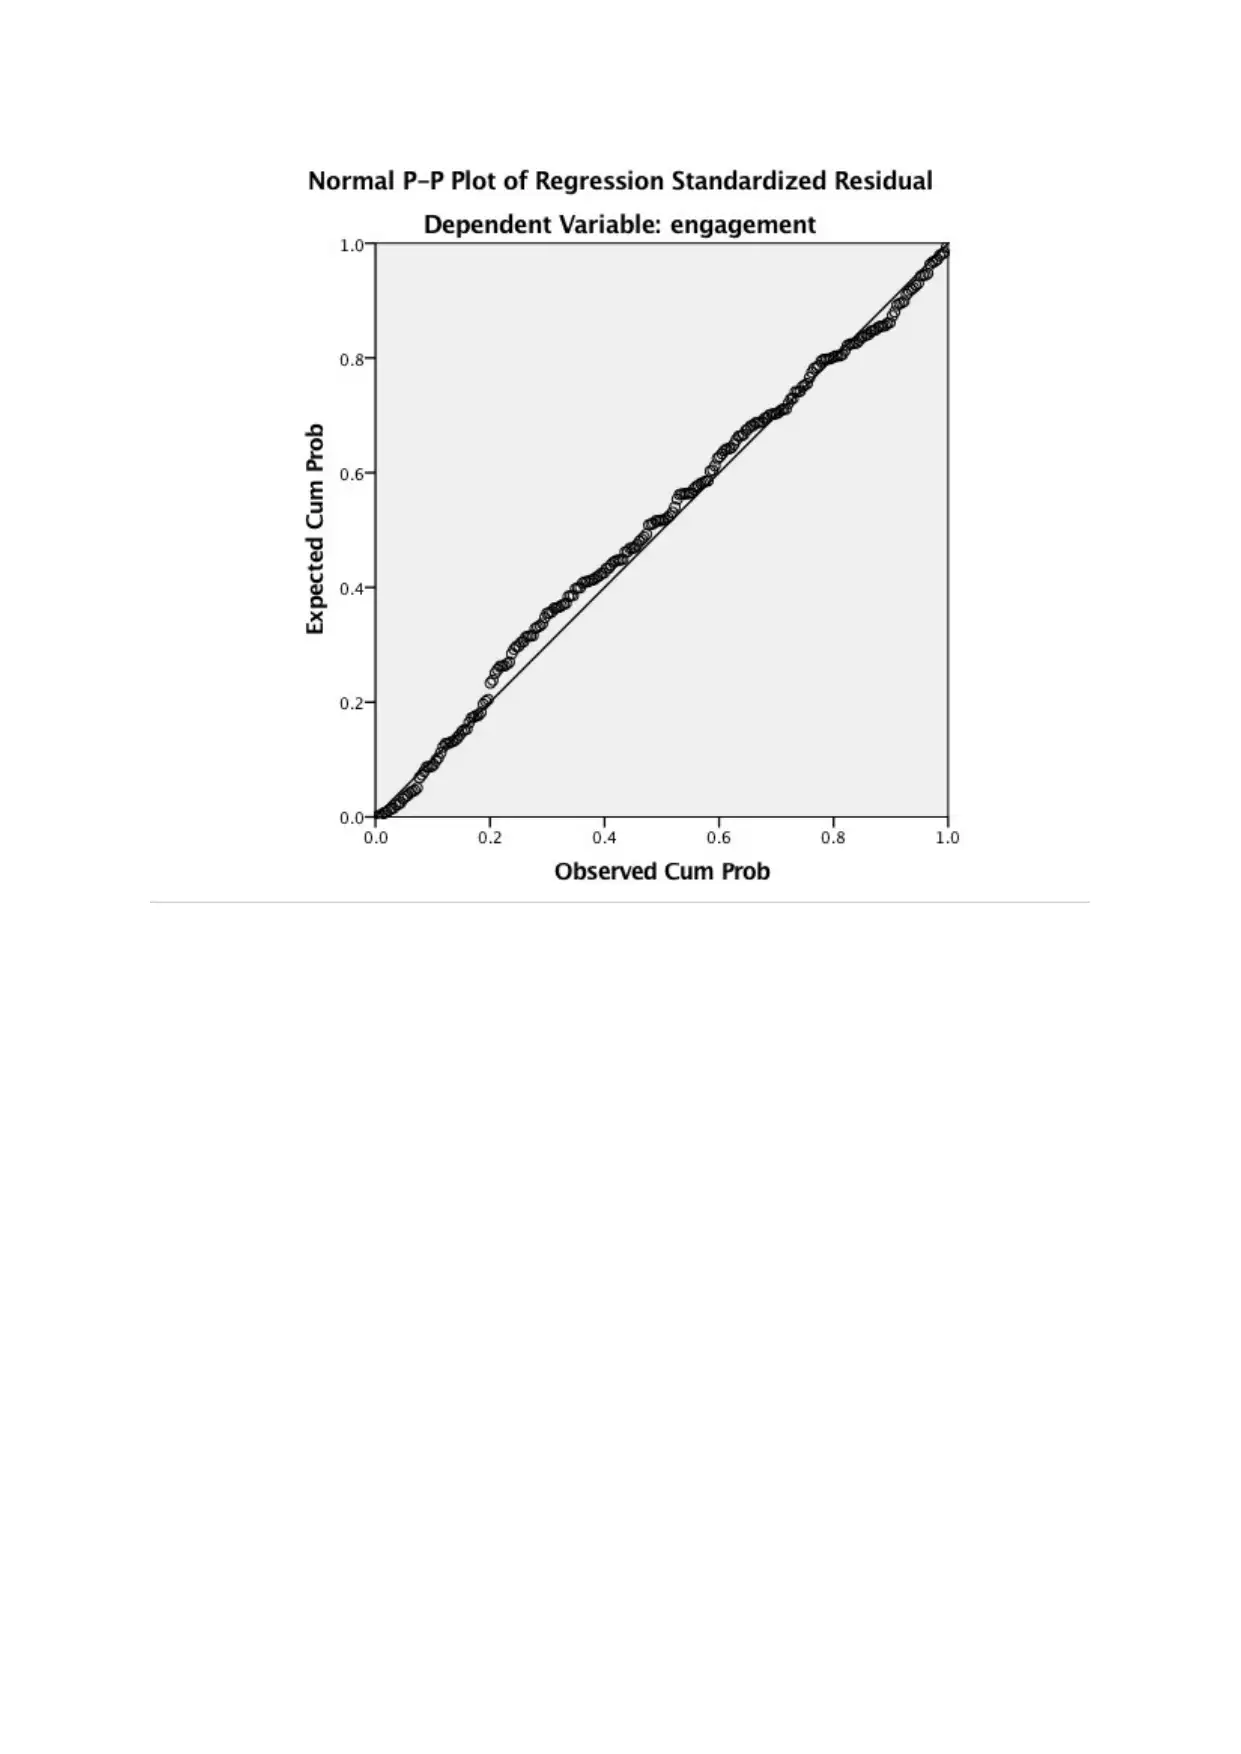
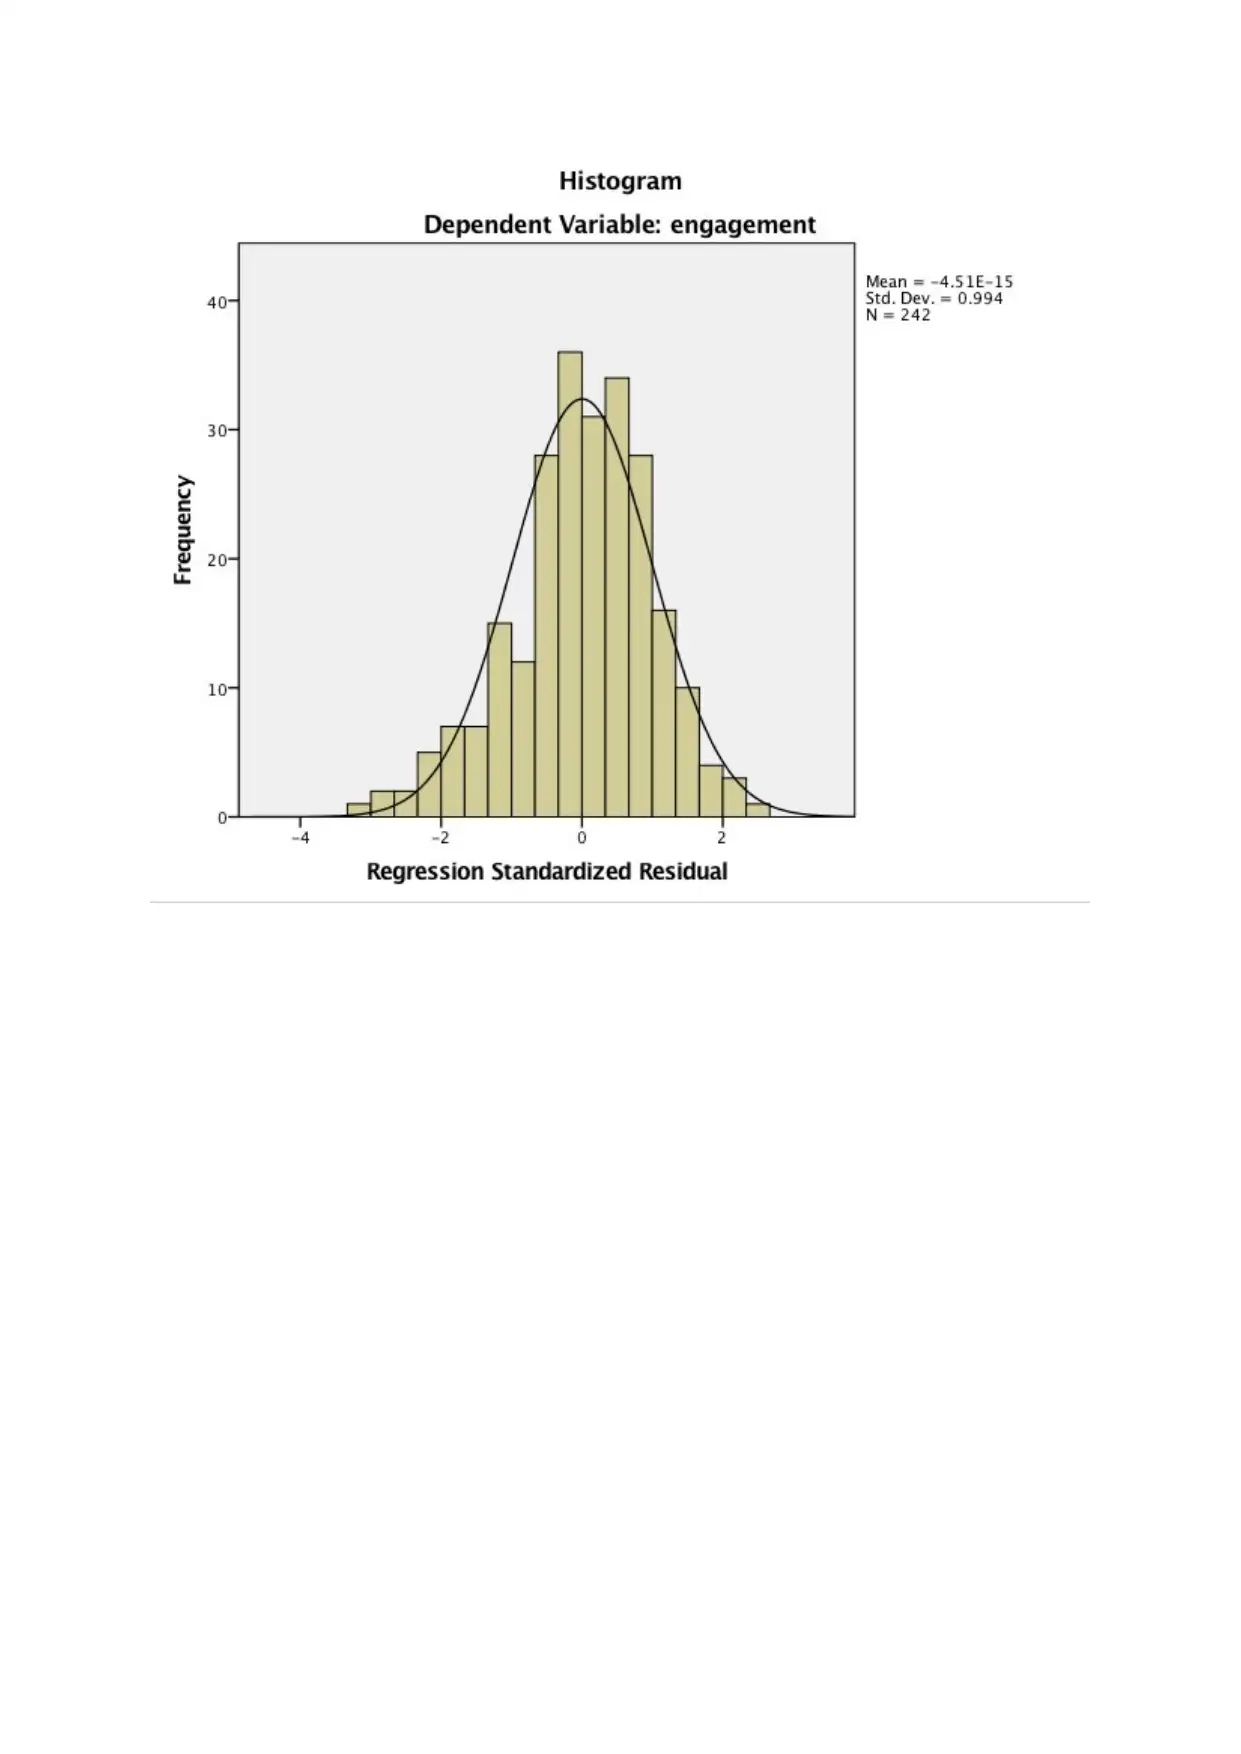
This assignment presents a detailed multiple linear regression analysis investigating the factors influencing employee engagement. The analysis uses a dataset of 242 observations, with engagement as the dependent variable and intrinsic motivation, extrinsic motivation, and amotivation as independent variables. Descriptive statistics reveal the mean and standard deviation for each variable. The study assesses the assumptions of multiple linear regression, including normality of residuals, homogeneity of error variance, and the absence of multicollinearity, which are validated through Cook's distance, normal probability plots, variance inflation factors, and correlation analysis. The results indicate that all assumptions are met, and the regression model explains 72.1% of the variation in engagement. The regression equation is provided, highlighting the significant contributions of intrinsic motivation and amotivation, while extrinsic motivation shows a negative but significant impact. The analysis includes comprehensive statistical tables and references to support the findings.
Document Page
My dependent variable is engagement. And independent variables are amotivation
intrinsic and extrinsic. There are a total of 242 observations for each variable in this data set.
According to the table of descriptive analysis observe that the mean for engagement,
intrinsic, extrinsic and amotivation is 4.3233, 4.839, 5.5000 and 1.6281 respectively. The
mean for extrinsic is observed to be highest. The value of standard deviation for engagement,
intrinsic, extrinsic and amotivation is low indicating that there mean is reliable.
The assumption for multiple linear regression includes normality of residuals,
homogeneity of error variance. Also, there should be no problem of multi-co-linearity in the
data. Multi-co-linearity occurs when the independent variables are strongly related to each
other. There should be no outlier in the data. Fox, J. (1997).
Cook’s distance, D, is used to find outliers in a set of predictor variables. a Cook’s D
of more than 3 times the mean, μ, is a possible outlier. Here there are no outliers as value of
Cooks’s D is less than 3 for all cases. Draper, N. R., & Smith, H. (2014).
From the normal probability plot, S-shaped is formed indicating that assumption of
normality of residuals is followed.
From the column of variance inflation factor in the table of coefficient, I observe and
the value of variance inflation factor is less than 3 for all the three independent variables.
This indicates that there is no problem of multi-co-linearity in data. The same is observed
from the table of correlation, as there is no strong linear relationship observed between the
independent variables. Hence I can say that all the assumptions of multiple linear regression
is satisfied for this model. Seber, G. A., & Lee, A. J. (2012).
tabler-icon-diamond-filled.svg

Paraphrase This Document

Need a fresh take? Get an instant paraphrase of this document with our AI Paraphraser
Document Page
From the table of residual statistics observed at the mean of residual is zero and value
of standard deviation are 0.62. The scatter plot between standardized residuals and
standardized predicted value, I observed that all points are randomly distributed. This
indicates that the variance is constant. This indicates that the assumption of homogeneity of
error variance is also followed.
From the value of coefficient of determination, R^2 =0.721 I can say that, there is
72.1% variation in engagement which is explained by all independent variables namely
amotivation, intrinsic and extrinsic. Regression equation is given by: engagement = 2.452
+ .570* intrinsic -.097* extrinsic -.216* amotivation. Montgomery, D. C., Peck, E. A., &
Vining, G. G. (2012).
References
Bates, D. M., & Watts, D. G. (1988). Nonlinear regression analysis and its applications (Vol.
2). New York: Wiley.
Fox, J. (1997). Applied regression analysis, linear models, and related methods. Sage
Publications, Inc.
Draper, N. R., & Smith, H. (2014). Applied regression analysis. John Wiley & Sons.
Montgomery, D. C., Peck, E. A., & Vining, G. G. (2012). Introduction to linear regression
analysis (Vol. 821). John Wiley & Sons.
Seber, G. A., & Lee, A. J. (2012). Linear regression analysis(Vol. 936). John Wiley & Sons.
Document Page
Appendix
Descriptive
Statistics
Mean
Std.
Deviation N
engagement 4.323
3
.90109 242
intrinsic 4.839
6
1.00242 242
extrinsic 5.500
0
1.13415 242
amotivation 1.628
1
.82970 242
Correlation
s
engagemen
t
intrinsi
c
extrinsi
c
amotivatio
n
Pearson
Correlation
engagemen
t
1.000 .685 -.034 -.412
intrinsic .685 1.000 .136 -.337
extrinsic -.034 .136 1.000 -.012
amotivation -.412 -.337 -.012 1.00
0
Sig. (1-tailed) engagemen
t
. .000 .301 .000
intrinsic .000 . .017 .000
extrinsic .301 .017 . .429
amotivation .000 .000 .429 .
N engagemen
t
242 242 242 242
intrinsic 242 242 242 242
extrinsic 242 242 242 242
amotivation 242 242 242 242
Variables
Entered/Re
moveda
Model
Variabl
es
Entere
d
Varia
bles
Rem
oved
Met
hod
1 amotiv
ation,
extrinsi
c,
intrinsi
cb
. Ent
er
a. Dependent
Variable:
engagement
Document Page
b. All requested
variables
entered.
Model
Summar
yb
Model R
R
Squar
e
Adjuste
d R
Square
Std.
Error of
the
Estimat
e
1 .72
1a
.520 .514 .62793
a. Predictors:
(Constant),
amotivation,
extrinsic,
intrinsic
b. Dependent
Variable:
engagement
ANOVAa
Model
Sum of
Squares df
Mean
Square F Sig.
1 Regressio
n
101.839 3 33.946 86.09
2
.000b
Residual 93.843 238 .394
Total 195.682 241
a.
Dependent
Variable:
engagemen
t
b.
Predictors:
(Constant),
amotivation,
extrinsic,
intrinsic
Coefficient
sa
Model
Unstandardize
d Coefficients
Standardize
d
Coefficients t
Sig.
Collinearit
y
StatisticsB Std. Error
Bet
a
Toleranc
e VIF
1 (Constant) 2.452 .30
2
8.129 .000
intrinsic .570 .04
3
.63
4
13.169 .000 .86
9
1.15
1
tabler-icon-diamond-filled.svg

Paraphrase This Document

Need a fresh take? Get an instant paraphrase of this document with our AI Paraphraser
Document Page
extrinsic -.097 .03
6
-.12
3
-2.702 .007 .98
0
1.02
0
amotivation -.216 .05
2
-.19
9
-4.175 .000 .88
5
1.13
0
a. Dependent
Variable:
engagement
Collineari
ty
Diagnosti
csa
Model
Dimensi
on
Eigenva
lue
Conditi
on
Index
Varianc
e
Proporti
ons
(Consta
nt)
intrin
sic
extrin
sic
amotivat
ion
1 1 3.767 1.000 .00 .00 .00 .01
2 .187 4.486 .00 .03 .01 .73
3 .033 10.650 .00 .41 .72 .05
4 .013 17.231 .99 .56 .26 .21
a. Dependent
Variable:
engagement
Residuals
Statisticsa
Minimum Maximum Mean
Std.
Deviation N
Predicted Value 2.2508 5.8138 4.3233 .65005 242
Std. Predicted Value -3.188 2.293 .000 1.000 242
Standard Error of
Predicted Value
.043 .181 .077 .025 242
Adjusted Predicted
Value
2.2366 5.7938 4.3227 .64994 242
Residual -1.96790 1.55293 .00000 .62401 242
Std. Residual -3.134 2.473 .000 .994 242
Stud. Residual -3.168 2.509 .000 1.002 242
Deleted Residual -2.01081 1.59793 .00062 .63466 242
Stud. Deleted Residual -3.230 2.537 .000 1.007 242
Mahal. Distance .146 18.931 2.988 2.904 242
Cook's Distance .000 .055 .004 .008 242
Centered Leverage
Value
.001 .079 .012 .012 242
a. Dependent Variable:
Descriptive
Statistics
N Minimum Maximum Mean
Std.
Deviation Skewness Kurtosis
Statistic Statistic Statistic Statistic Statistic Statistic
Std.
Error Statistic
Std.
Error
extrinsic 242 1.50 7.00 5.5000 1.13415 -.954 .156 .866 .312
intrinsic 242 1.75 7.00 4.8396 1.00242 -.239 .156 -.145 .312
amotivation 242 1.00 5.00 1.6281 .82970 1.576 .156 2.123 .312
engagement 242 1.87 6.67 4.3233 .90109 -.001 .156 -.098 .312
Valid N (listwise) 242
Document Page
engagement
Document Page
tabler-icon-diamond-filled.svg

Paraphrase This Document

Need a fresh take? Get an instant paraphrase of this document with our AI Paraphraser
Document Page
chevron_up_icon
1 out of 8
circle_padding
hide_on_mobile
zoom_out_icon
[object Object]