Economics Project: Evaluating BMW's Sales Forecast Through Regression

Verified

Added on  2020/05/16

|11
|1054
|146
Project
AI Summary
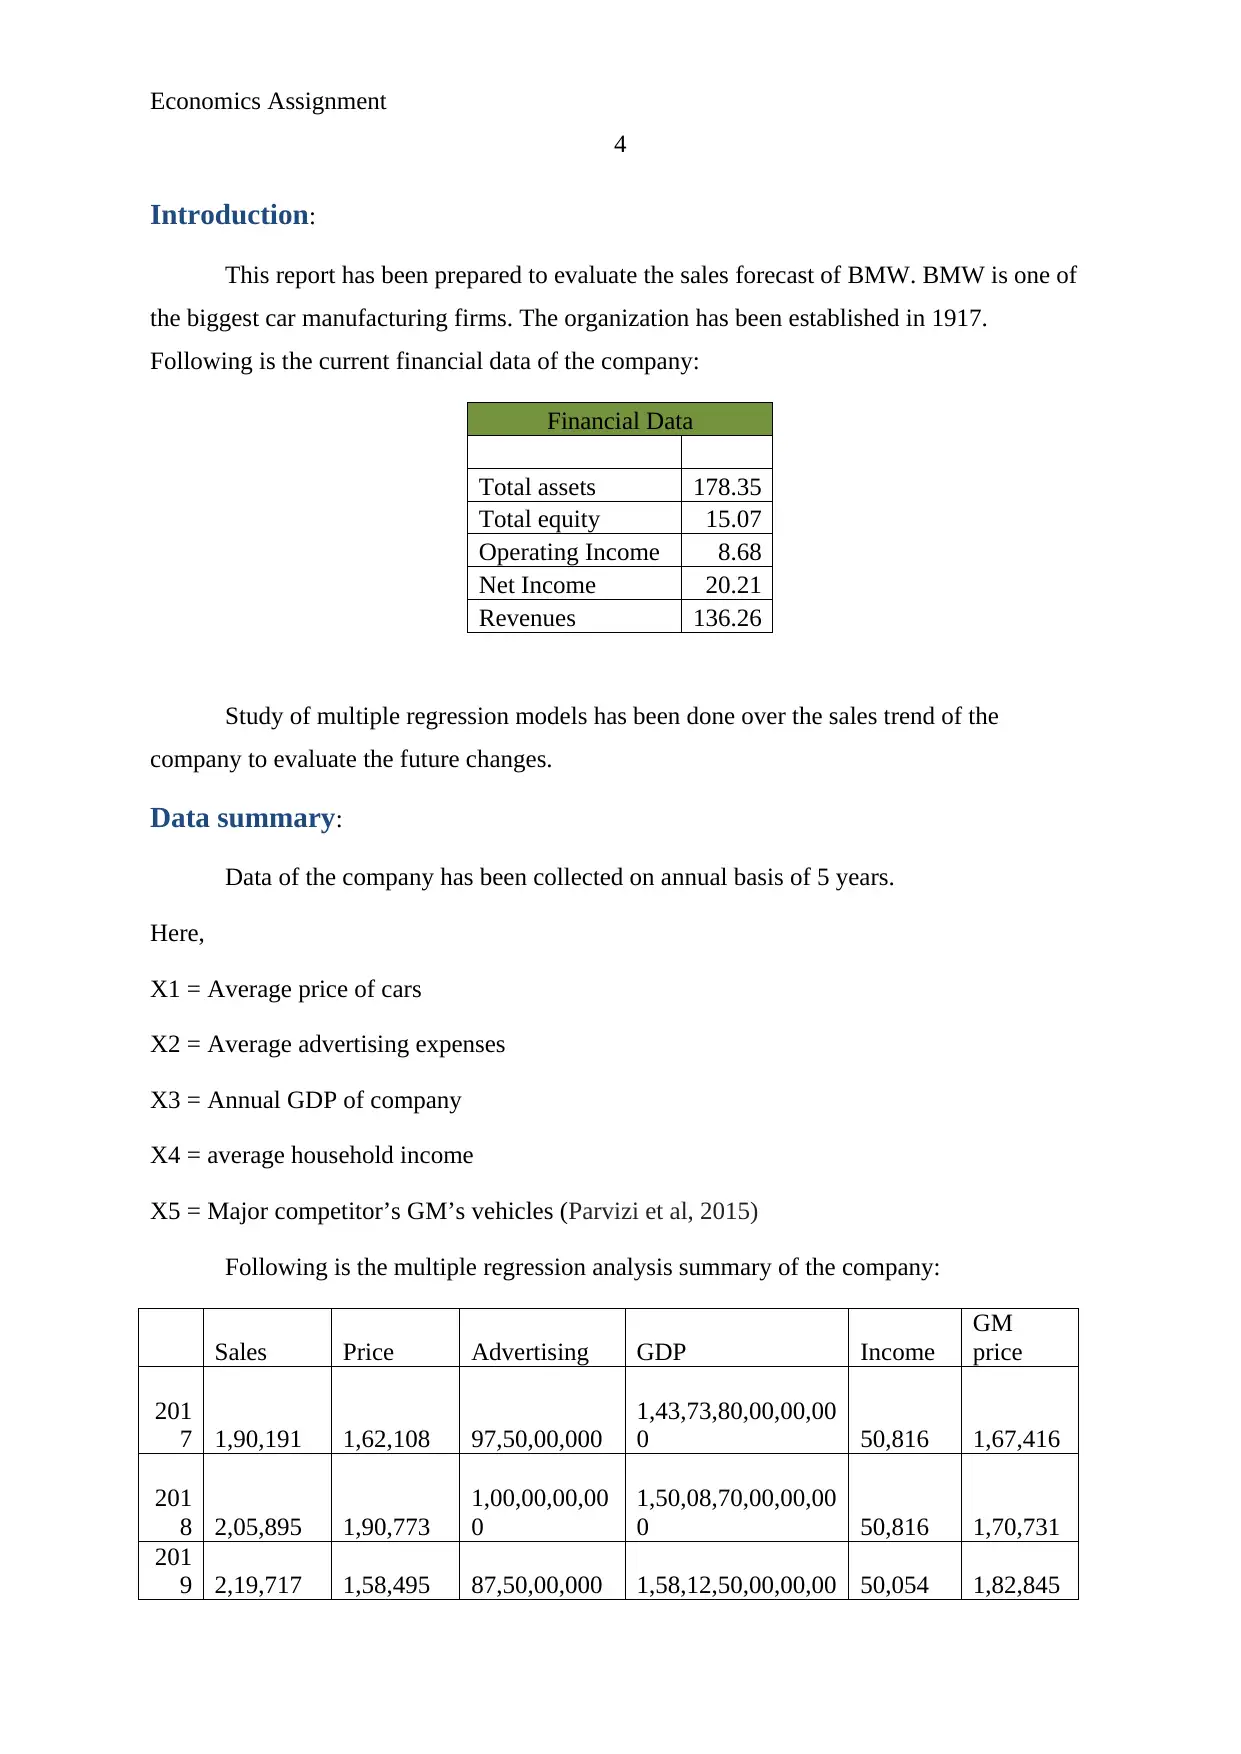
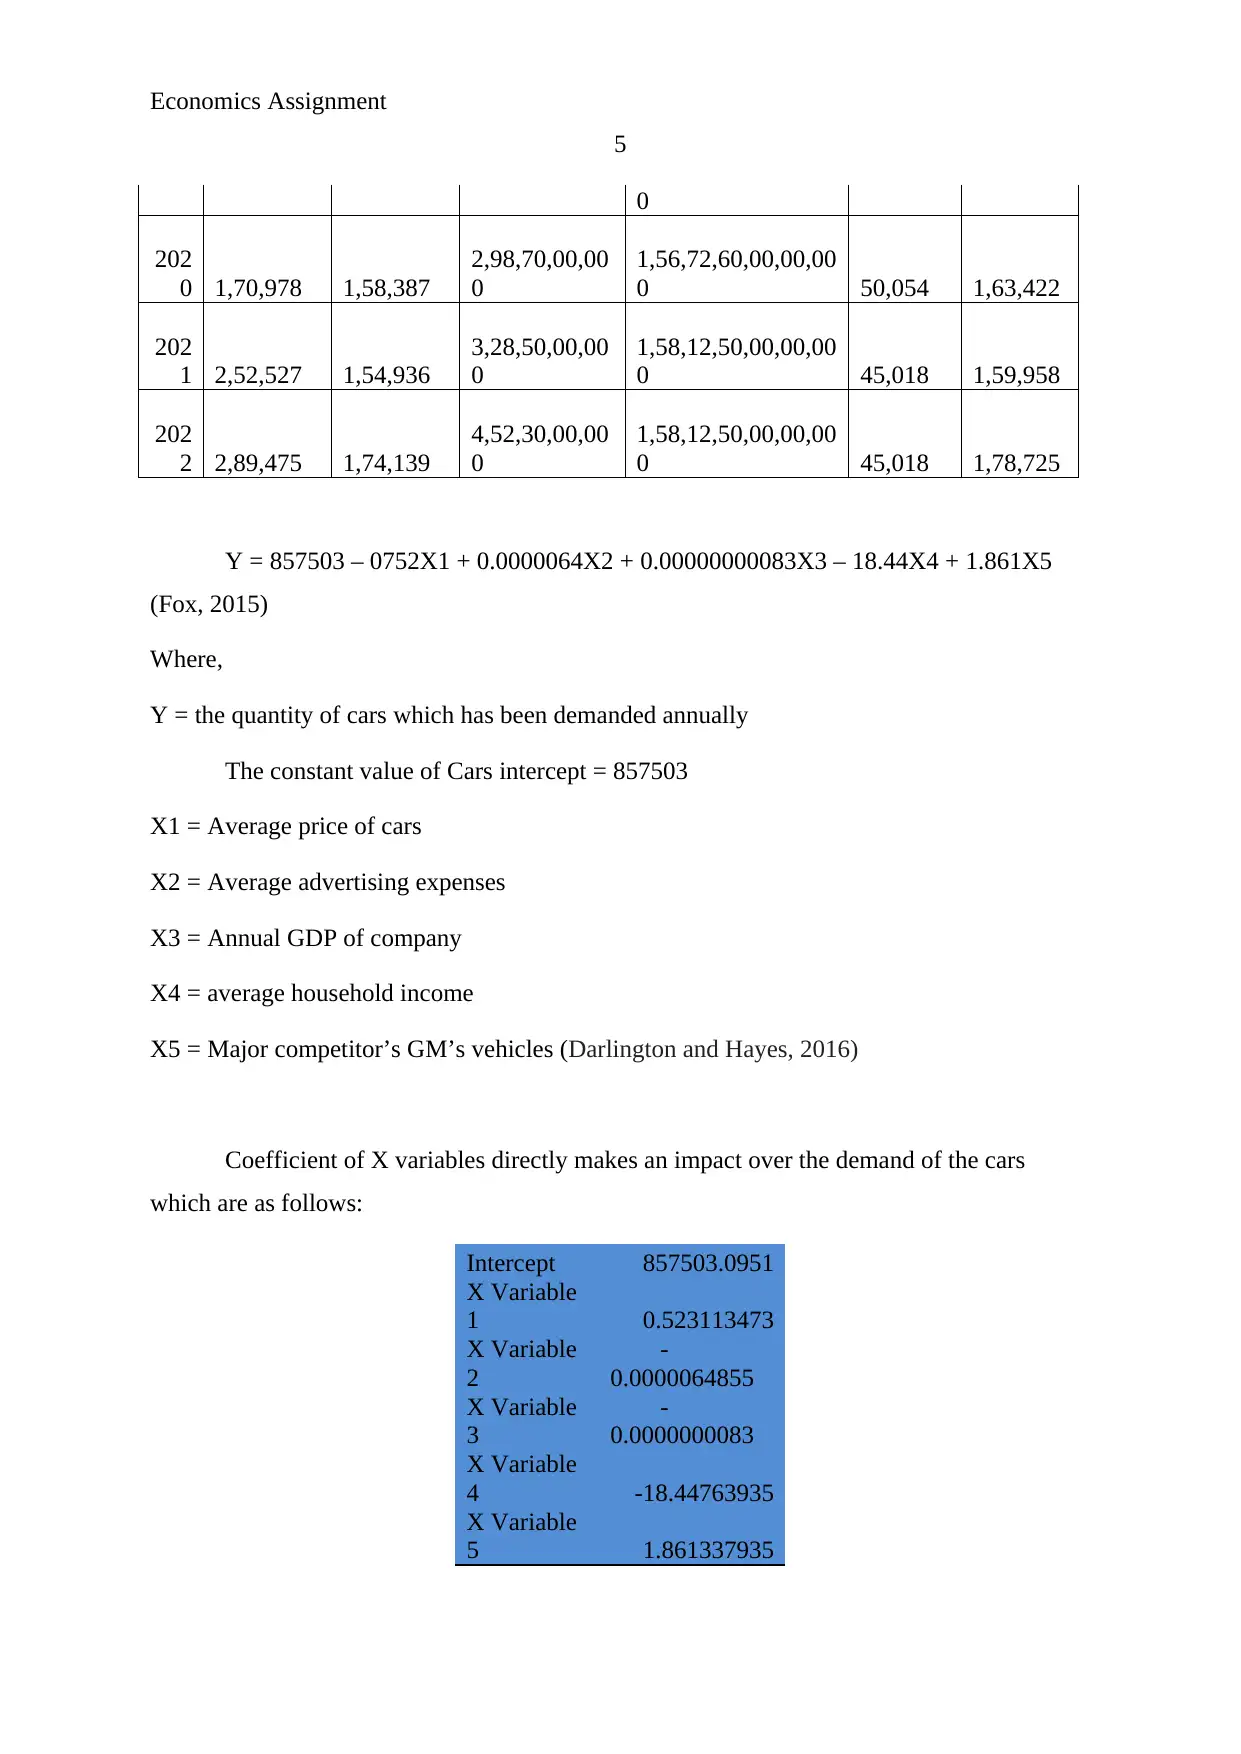
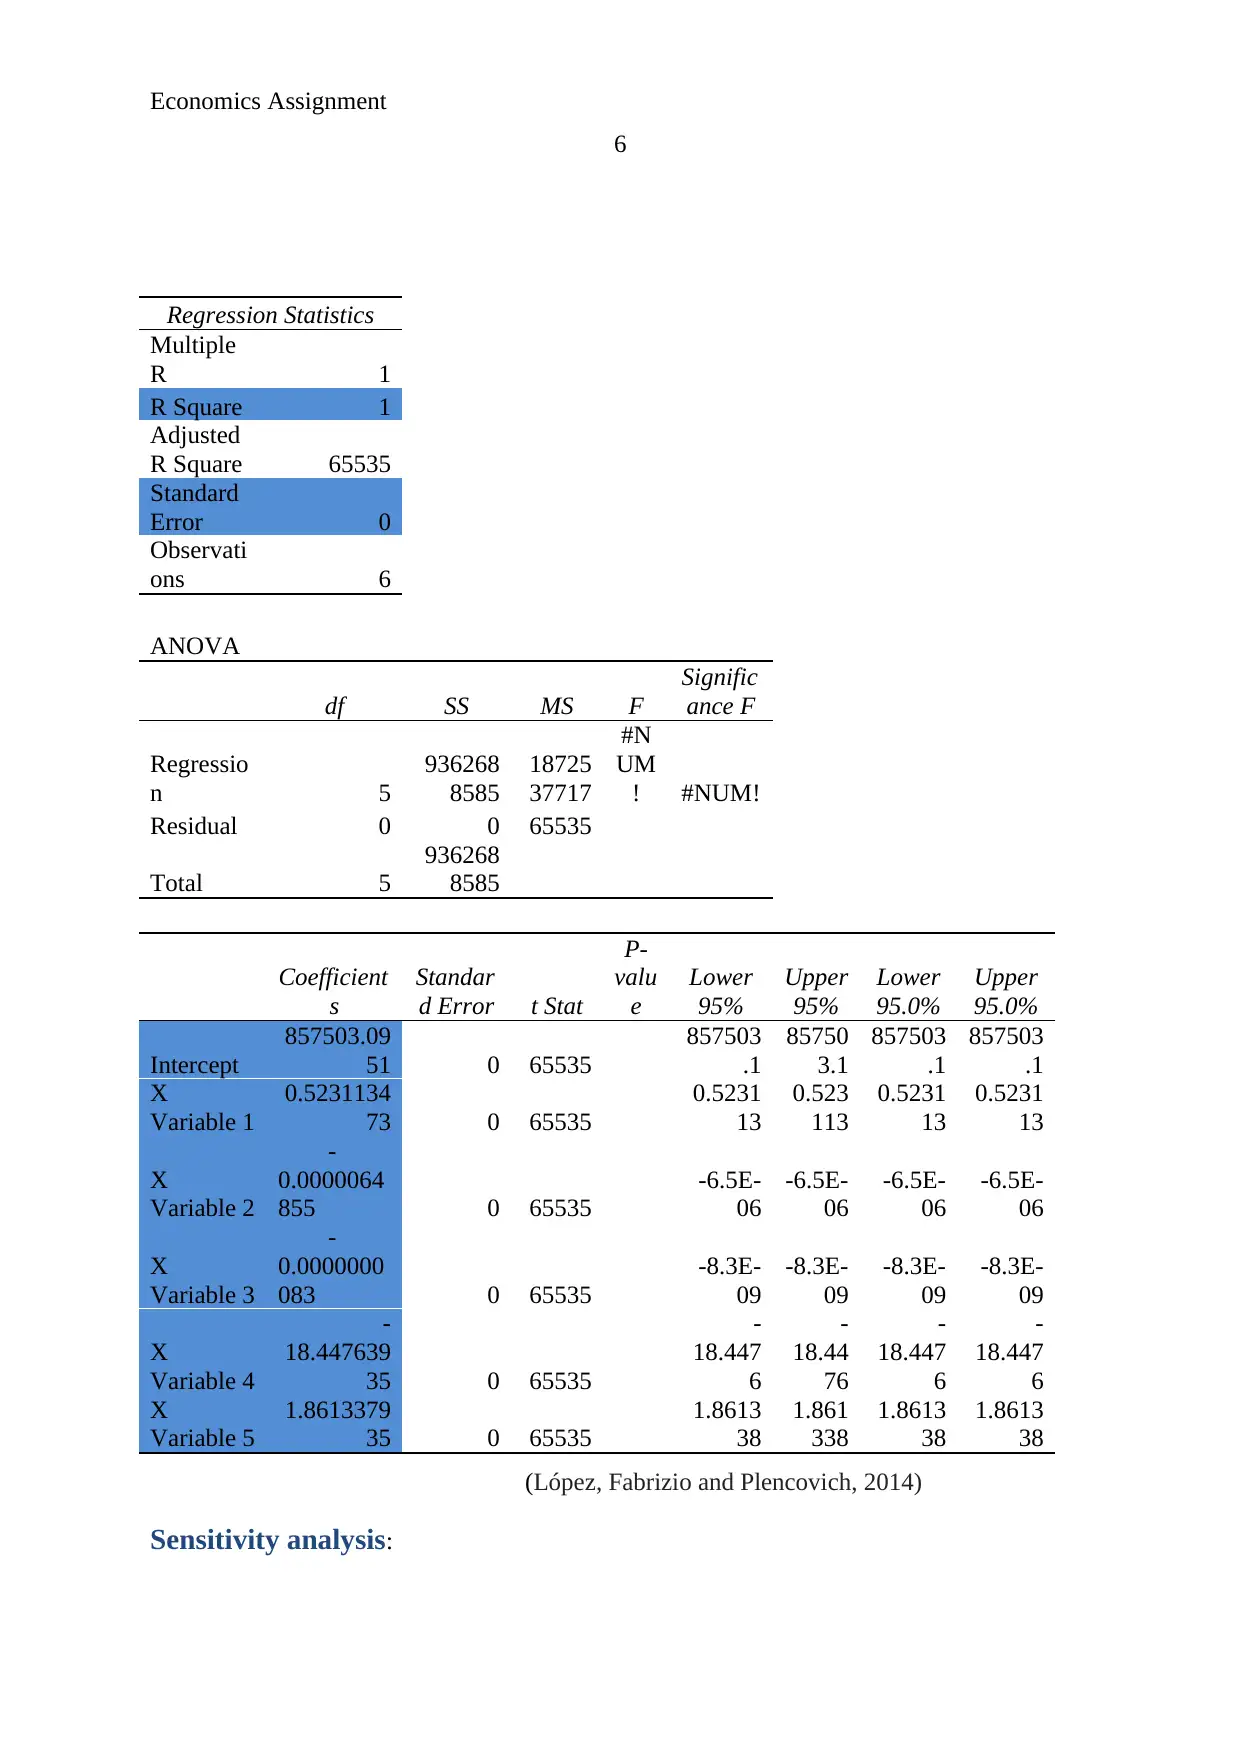
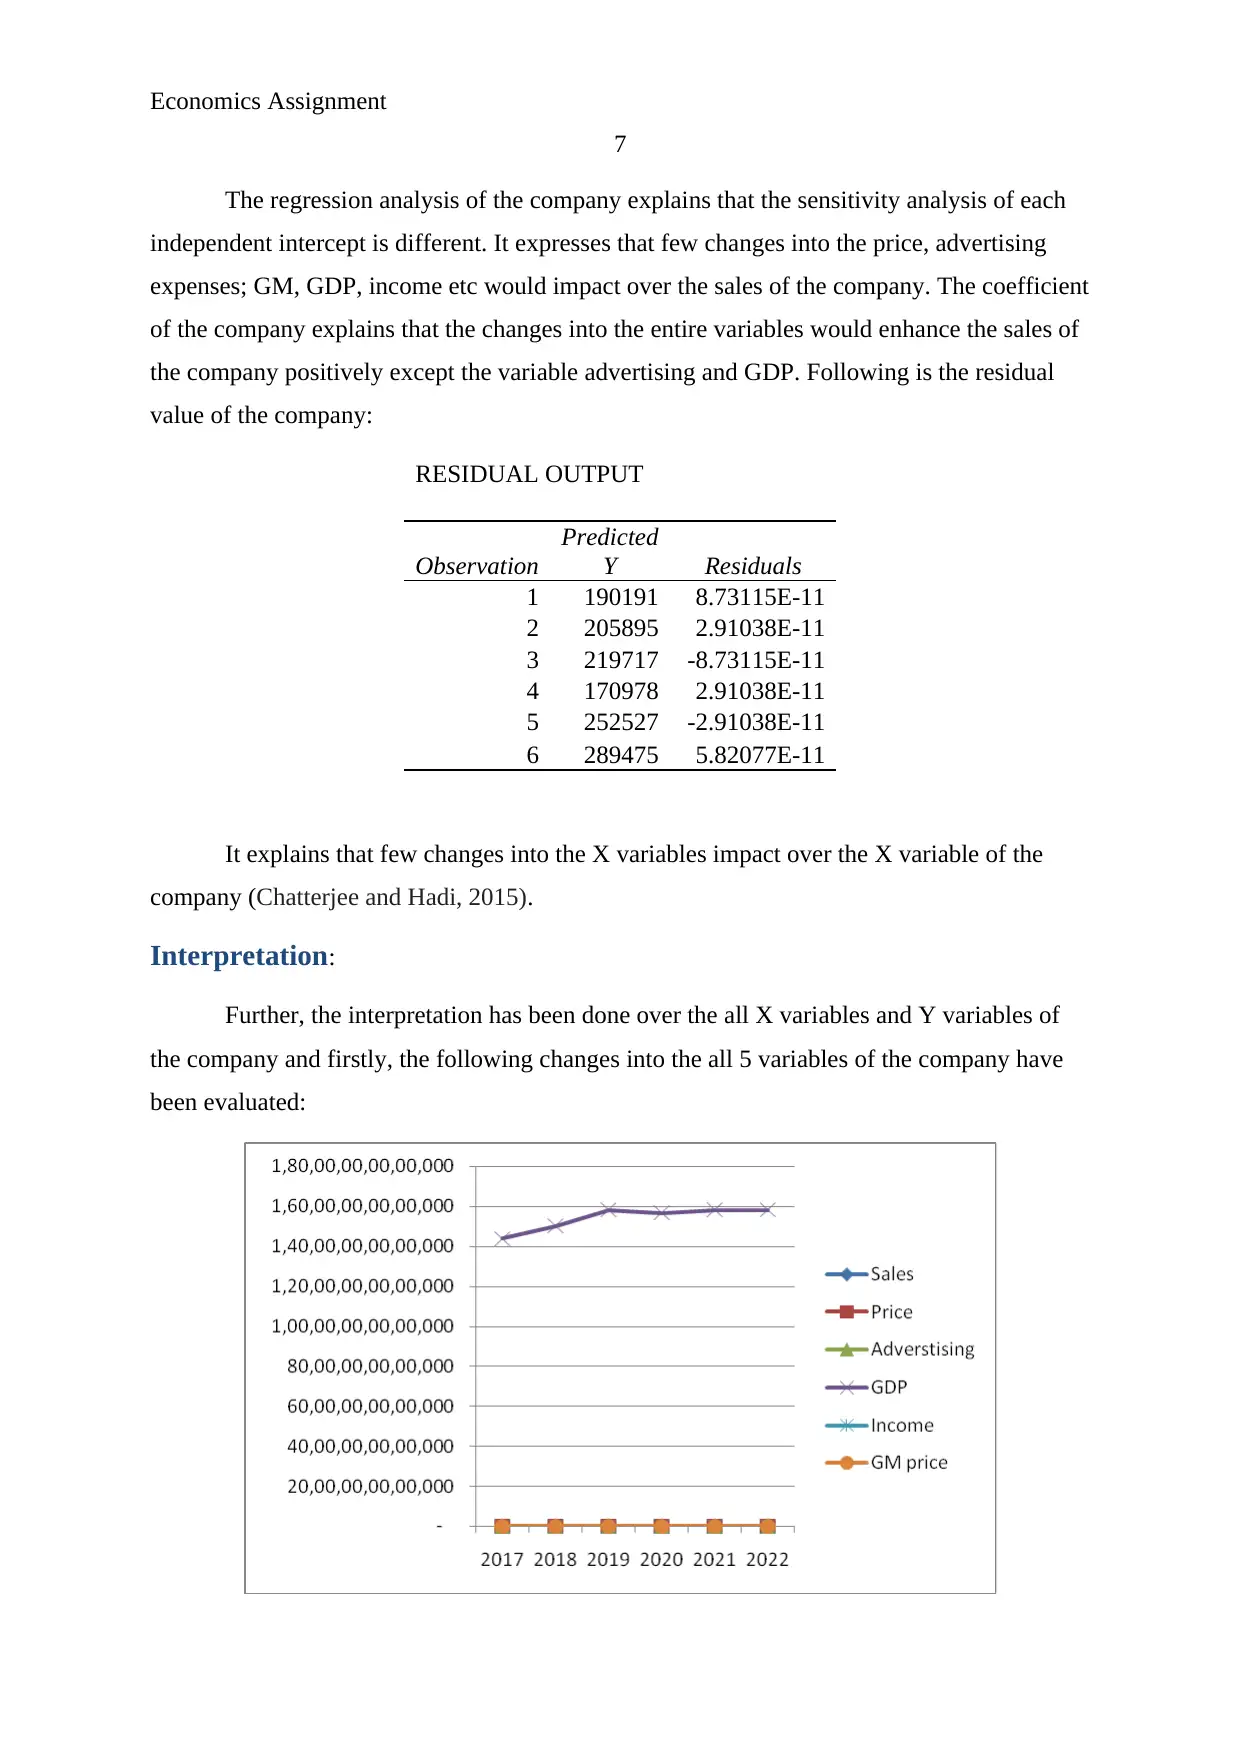
This project report evaluates the sales forecast of BMW, a multinational car manufacturing company, using multiple regression analysis. The study examines financial data and various factors impacting sales, including average car price, advertising expenses, annual GDP, average household income, and competitor's vehicle sales. The report presents a multiple regression model to assess the sensitivity analysis of each independent variable. The interpretation reveals the impact of these variables on car demand, highlighting the effect of changes in price, advertising, GDP, income, and competitor's sales. The conclusion emphasizes the utility of multiple regression in identifying factors influencing sales and their impact on company performance and revenue. The analysis is supported by data from 2017 to 2022 and references several academic sources.
Document Page
Running Head: Economics Assignment
1
Project Report: Economics Assignment
tabler-icon-diamond-filled.svg

Secure Best Marks with AI Grader

Need help grading? Try our AI Grader for instant feedback on your assignments.
Document Page
Economics Assignment
2
Executive Summary
This report has been prepared to evaluate the sales forecast of a multinational
company. BMW has been taken into consideration for this report. Further, for evaluating the
better study of sales forecast of the company, multiple regression analysis has been done. The
regression analysis of the company explains that the sensitivity analysis of each independent
intercept is different.
Document Page
Economics Assignment
3
Contents
Introduction.......................................................................................................................4
Data summary...................................................................................................................4
Sensitivity analysis...........................................................................................................6
Interpretation.....................................................................................................................7
Conclusion........................................................................................................................8
References.........................................................................................................................9
Document Page
Economics Assignment
4
Introduction:
This report has been prepared to evaluate the sales forecast of BMW. BMW is one of
the biggest car manufacturing firms. The organization has been established in 1917.
Following is the current financial data of the company:
Financial Data
Total assets 178.35
Total equity 15.07
Operating Income 8.68
Net Income 20.21
Revenues 136.26
Study of multiple regression models has been done over the sales trend of the
company to evaluate the future changes.
Data summary:
Data of the company has been collected on annual basis of 5 years.
Here,
X1 = Average price of cars
X2 = Average advertising expenses
X3 = Annual GDP of company
X4 = average household income
X5 = Major competitor’s GM’s vehicles (Parvizi et al, 2015)
Following is the multiple regression analysis summary of the company:
Sales Price Advertising GDP Income
GM
price
201
7 1,90,191 1,62,108 97,50,00,000
1,43,73,80,00,00,00
0 50,816 1,67,416
201
8 2,05,895 1,90,773
1,00,00,00,00
0
1,50,08,70,00,00,00
0 50,816 1,70,731
201
9 2,19,717 1,58,495 87,50,00,000 1,58,12,50,00,00,00 50,054 1,82,845
tabler-icon-diamond-filled.svg

Secure Best Marks with AI Grader

Need help grading? Try our AI Grader for instant feedback on your assignments.
Document Page
Economics Assignment
5
0
202
0 1,70,978 1,58,387
2,98,70,00,00
0
1,56,72,60,00,00,00
0 50,054 1,63,422
202
1 2,52,527 1,54,936
3,28,50,00,00
0
1,58,12,50,00,00,00
0 45,018 1,59,958
202
2 2,89,475 1,74,139
4,52,30,00,00
0
1,58,12,50,00,00,00
0 45,018 1,78,725
Y = 857503 – 0752X1 + 0.0000064X2 + 0.00000000083X3 – 18.44X4 + 1.861X5
(Fox, 2015)
Where,
Y = the quantity of cars which has been demanded annually
The constant value of Cars intercept = 857503
X1 = Average price of cars
X2 = Average advertising expenses
X3 = Annual GDP of company
X4 = average household income
X5 = Major competitor’s GM’s vehicles (Darlington and Hayes, 2016)
Coefficient of X variables directly makes an impact over the demand of the cars
which are as follows:
Intercept 857503.0951
X Variable
1 0.523113473
X Variable
2
-
0.0000064855
X Variable
3
-
0.0000000083
X Variable
4 -18.44763935
X Variable
5 1.861337935
Document Page
Economics Assignment
6
Regression Statistics
Multiple
R 1
R Square 1
Adjusted
R Square 65535
Standard
Error 0
Observati
ons 6
ANOVA
df SS MS F
Signific
ance F
Regressio
n 5
936268
8585
18725
37717
#N
UM
! #NUM!
Residual 0 0 65535
Total 5
936268
8585
Coefficient
s
Standar
d Error t Stat
P-
valu
e
Lower
95%
Upper
95%
Lower
95.0%
Upper
95.0%
Intercept
857503.09
51 0 65535
857503
.1
85750
3.1
857503
.1
857503
.1
X
Variable 1
0.5231134
73 0 65535
0.5231
13
0.523
113
0.5231
13
0.5231
13
X
Variable 2
-
0.0000064
855 0 65535
-6.5E-
06
-6.5E-
06
-6.5E-
06
-6.5E-
06
X
Variable 3
-
0.0000000
083 0 65535
-8.3E-
09
-8.3E-
09
-8.3E-
09
-8.3E-
09
X
Variable 4
-
18.447639
35 0 65535
-
18.447
6
-
18.44
76
-
18.447
6
-
18.447
6
X
Variable 5
1.8613379
35 0 65535
1.8613
38
1.861
338
1.8613
38
1.8613
38
(López, Fabrizio and Plencovich, 2014)
Sensitivity analysis:
Document Page
Economics Assignment
7
The regression analysis of the company explains that the sensitivity analysis of each
independent intercept is different. It expresses that few changes into the price, advertising
expenses; GM, GDP, income etc would impact over the sales of the company. The coefficient
of the company explains that the changes into the entire variables would enhance the sales of
the company positively except the variable advertising and GDP. Following is the residual
value of the company:
RESIDUAL OUTPUT
Observation
Predicted
Y Residuals
1 190191 8.73115E-11
2 205895 2.91038E-11
3 219717 -8.73115E-11
4 170978 2.91038E-11
5 252527 -2.91038E-11
6 289475 5.82077E-11
It explains that few changes into the X variables impact over the X variable of the
company (Chatterjee and Hadi, 2015).
Interpretation:
Further, the interpretation has been done over the all X variables and Y variables of
the company and firstly, the following changes into the all 5 variables of the company have
been evaluated:
tabler-icon-diamond-filled.svg

Paraphrase This Document

Need a fresh take? Get an instant paraphrase of this document with our AI Paraphraser
Document Page
Economics Assignment
8
In addition, through the calcualtion os regression analysis of the company, it has been
found that the few changes into 0.52 changes into the price of the product would directly
make an impcat over the 857503 units of the company. Further, the same analysis has been
over other intercept of the company and various macro economical aspcet and it has been
found that the -0.000000064855 changes into the advertsing expenses of the product would
directly make an impcat over the 857503 units of the company. On the other hand, -
0.00000000083 changes into the GDP of the product would directly make an impcat over the
857503 units of the company (Draper and Smith, 2014). At the same time, -18.44 and 1.86
changes into the Income and Gm respectively of the product would directly make an impcat
over the 857503 units of the company.
Further, it expresses that the Standrd error of the product is 0. R square is 1. It
explains that the company would enjoy a great number of saes of car in near future and at the
same time, the performance of the company would also be better.
Conclusion:
To conclude, multiple regression method makes it easy for the company and the
analyst to analyze that what are the factors which have impact over the sales of the company
and how much would they impact over the performance of the company and the sales
revenues of the company.
Document Page
Economics Assignment
9
References:
Chatterjee, S. and Hadi, A.S., 2015. Regression analysis by example. John Wiley & Sons.
Darlington, R.B. and Hayes, A.F., 2016. Regression analysis and linear models: Concepts,
applications, and implementation. Guilford Publications.
Draper, N.R. and Smith, H., 2014. Applied regression analysis. John Wiley & Sons.
Fox, J., 2015. Applied regression analysis and generalized linear models. Sage Publications.
López, M.V., Fabrizio, M.C. and Plencovich, M.C., 2014. Multiple Regression
Analysis. Probability and Statistics: A Didactic Introduction, 416.
Parvizi, D., Friedl, H., Wurzer, P., Kamolz, L.P., Lebo, P., Tuca, A., Rappl, T., Wiedner, M.,
Kuess, K., Grohmann, M. and Koch, H., 2015. A multiple regression analysis of
postoperative complications after body-contouring surgery: a retrospective analysis of 205
patients. Obesity surgery, 25(8), pp.1482-1490.
Document Page
Economics Assignment
10
tabler-icon-diamond-filled.svg

Secure Best Marks with AI Grader

Need help grading? Try our AI Grader for instant feedback on your assignments.
Document Page
Economics Assignment
11
chevron_up_icon
1 out of 11
circle_padding
hide_on_mobile
zoom_out_icon
logo.png

Your All-in-One AI-Powered Toolkit for Academic Success.

Available 24*7 on WhatsApp / Email

[object Object]