Analyzing Business Decisions: A Report on Murano Restaurant
VerifiedAdded on 2020/07/22
|24
|4826
|54
Report
AI Summary
This report analyzes the business decision-making process for Murano Restaurant, focusing on the potential opening of a new branch. The report begins with a plan for gathering primary and secondary data, followed by a description of the survey methodology and sampling frame used. A questionnaire is presented, and the collected data is analyzed using appropriate values, measures of dispersion, quartiles, percentiles, and correlation coefficients. The report includes the creation of graphs and the drawing of conclusions based on the information derived. Trend lines are used in spreadsheet graphs to assist in forecasting business information. Finally, the report covers the use of information processing tools, the preparation of a project plan with a critical path, and the application of financial tools for decision-making. The conclusion summarizes the findings and recommendations regarding the restaurant's expansion strategy.
BUSINESS DECISION
MAKING
MAKING
Paraphrase This Document
Need a fresh take? Get an instant paraphrase of this document with our AI Paraphraser
Table of Contents
INTRODUCTION...........................................................................................................................3
TASK 1 ...........................................................................................................................................3
1.1 Creation of plan for primary and secondary data..................................................................3
1.2 Survey methodology and sampling framing used.................................................................4
1.3 Questionnaire for a business problem ..................................................................................5
TASK 2............................................................................................................................................6
2.1 Create information for decision making using appropriate values.......................................6
2.2 Analyse the results to draw conclusions...............................................................................6
2.3 Analyse the data using measures of dispersion.....................................................................6
2.4 Use of quartiles, percentiles and correlation coefficient.......................................................6
TASK 3............................................................................................................................................7
3.1 Produce graphs and draw conclusions on the information derived.......................................7
3.2 Trend lines in spreadsheet graphs to assist in forecasting for business information............7
3.3 Covered in PPT.....................................................................................................................7
3.4 Formal business report..........................................................................................................7
TASK 4............................................................................................................................................9
4.1 Information processing tools.................................................................................................9
4.2 Prepare a project Plan for an activity and determine the critical Path..................................9
4.3 Use financial tools for decision-making.............................................................................10
CONCLUSION..............................................................................................................................12
REFERENCES..............................................................................................................................13
INTRODUCTION
In this competitive world, the business is required to make an effective decision in the
market which can help company to make them to get stable too. Even though the organization
has alternatives of decision in which best one has to be chose. Normally, selecting the decision is
that which also provide the better result in entity which do have an analysis of various
investment scenario with the help of IRR and NPV. These tools do help in determining as which
will provide the maximum return from investment in different areas. The report is based on
Murano which is situated in London, England. Restaurant is founded in year around 2008 and it
was found by Angela Hartnett and Gordon Ramsay. They provide the best quality of foods
product to customers in great way. Assignment is such which will include primary and secondary
data produce a plan, although framing of samples and methodologies are also there too.
Questionnaire, evaluation of information has to be done and use of different method is also there
with dispersion which has contribution in quartiles, percentiles and correlation that do conclude
result in right context.
TASK 1
1.1 Creation of plan for primary and secondary data.
Murano does come under the best restaurant which do provide the best services to their
clients in UK. Restaurant is that which look forward to new outlet in the heart of London.
Management of the firm decided that they will take feedback from client related to their food
items and services which will help them to open new branch in market (Aharoni, Tihanyi, and
Connelly, 2011). For such thing Murano has adopted the primary and secondary method to
collect information. Research will help them to take better decision and to make proper strategies
by management of company.
Primary source: It is being considered as the important factor and comes under the first
hand collection of information. As, this is such which do help in collecting the authentic data
which do help in getting the idea about taste and preferences of customers that reveal current
trend and scenario which do prevail the food industry of UK in better manner.
Questionnaire: In this various questions are there which is required to be prepared and
has to be asked from many customers and candidates which does help in obtaining
⊘ This is a preview!⊘
Do you want full access?
Subscribe today to unlock all pages.
Trusted by 1+ million students worldwide
information and knowledge in proper way. For many purpose, collecting data from
primary and secondary. This will include the information and regarding to preferences of
today's consumers and different factors in which business environment affects.
Survey: It does face some interaction with respondents on particular topic is by asking
the determined questions and take feedback on some specific topic and for various
purpose and making testing concept, knowing the customer satisfaction level etc.
Secondary sources: Researcher also goes with second hand information which is
collected by the someone and already has been published in magazines and newspapers
or book.
1.2 Survey methodology and sampling framing used.
Research for the Murano restaurant is such which help them to gather the information in
great way and thus it makes them to make better decision for the longer period of time.
Moreover, the company is that who uses the different survey methodologies and this help in
carry out the various right information and data too (Ferrell, and Fraedrich, 2015).
Methodology:- It is being considered as the selection method of survey which also
provide the different optimum things and result as well. Management of Murano has taken
decision to collect information with primary and secondary method. Although a better
questionnaire is such which has helped in making an effective research and provide the needed
information in right context too. Even though there are some question which is being covered to
have different aspect.
Sample framework: It is that which do consider the method by researcher with many
other respondents as well. Different method is that which cluster, stratifies and having random
calling with many more too. Therefore, many things are there which needs to choose the random
sampling method and having almost 30 candidates with the given choose scenario from various
population which include several question and it is being asked to questionnaire. Some of the
main topic which is considered in this are as follows:
Looking forward to have an open branch in UK.
It is required to know the quality of product and services which they do offer to people.
Strength and weakness with their current performance too in better way.
Paraphrase This Document
Need a fresh take? Get an instant paraphrase of this document with our AI Paraphraser
1.3 Questionnaire for a business problem
This is that which include the different important topics which needed to have questions.
Questionnaire is done with various things that has an advantage in with comparison to other
things like saving, collecting the various information etc. in various better manner too. Normally,
behaviours are facts which can be collected in various great way too (Ford and Richardson,
2013).
QUESTIONNAIRE
Name of a candidate:
Residential Address:
Email Id:
Gender:
1.) Is it profitable for restaurant to open a new branch in London?
Yes
No
2.) Are customers happy with the decision or not?
Yes
No
Moderate
3.) Are clients satisfied with the quality of products offer by the restaurant?
Yes
No
4.) Is staff personnel behave properly or not?
Yes
No
5.) Do you think that Murano is working well in their industry?
Yes
No
6.) Do you think Murano is fulfilling the ultimate demands of customers?
Yes
No
7.) Is restaurant offer pleasant environment or not?
Yes
No
8.) Is restaurant offer all type of food items or not?
Yes
No
9.) Any suggestions for the Murano restaurant?
…......................................................................................................................................................
.....................................................................................................................................
TASK 2
2.1 Create information for decision making using appropriate values
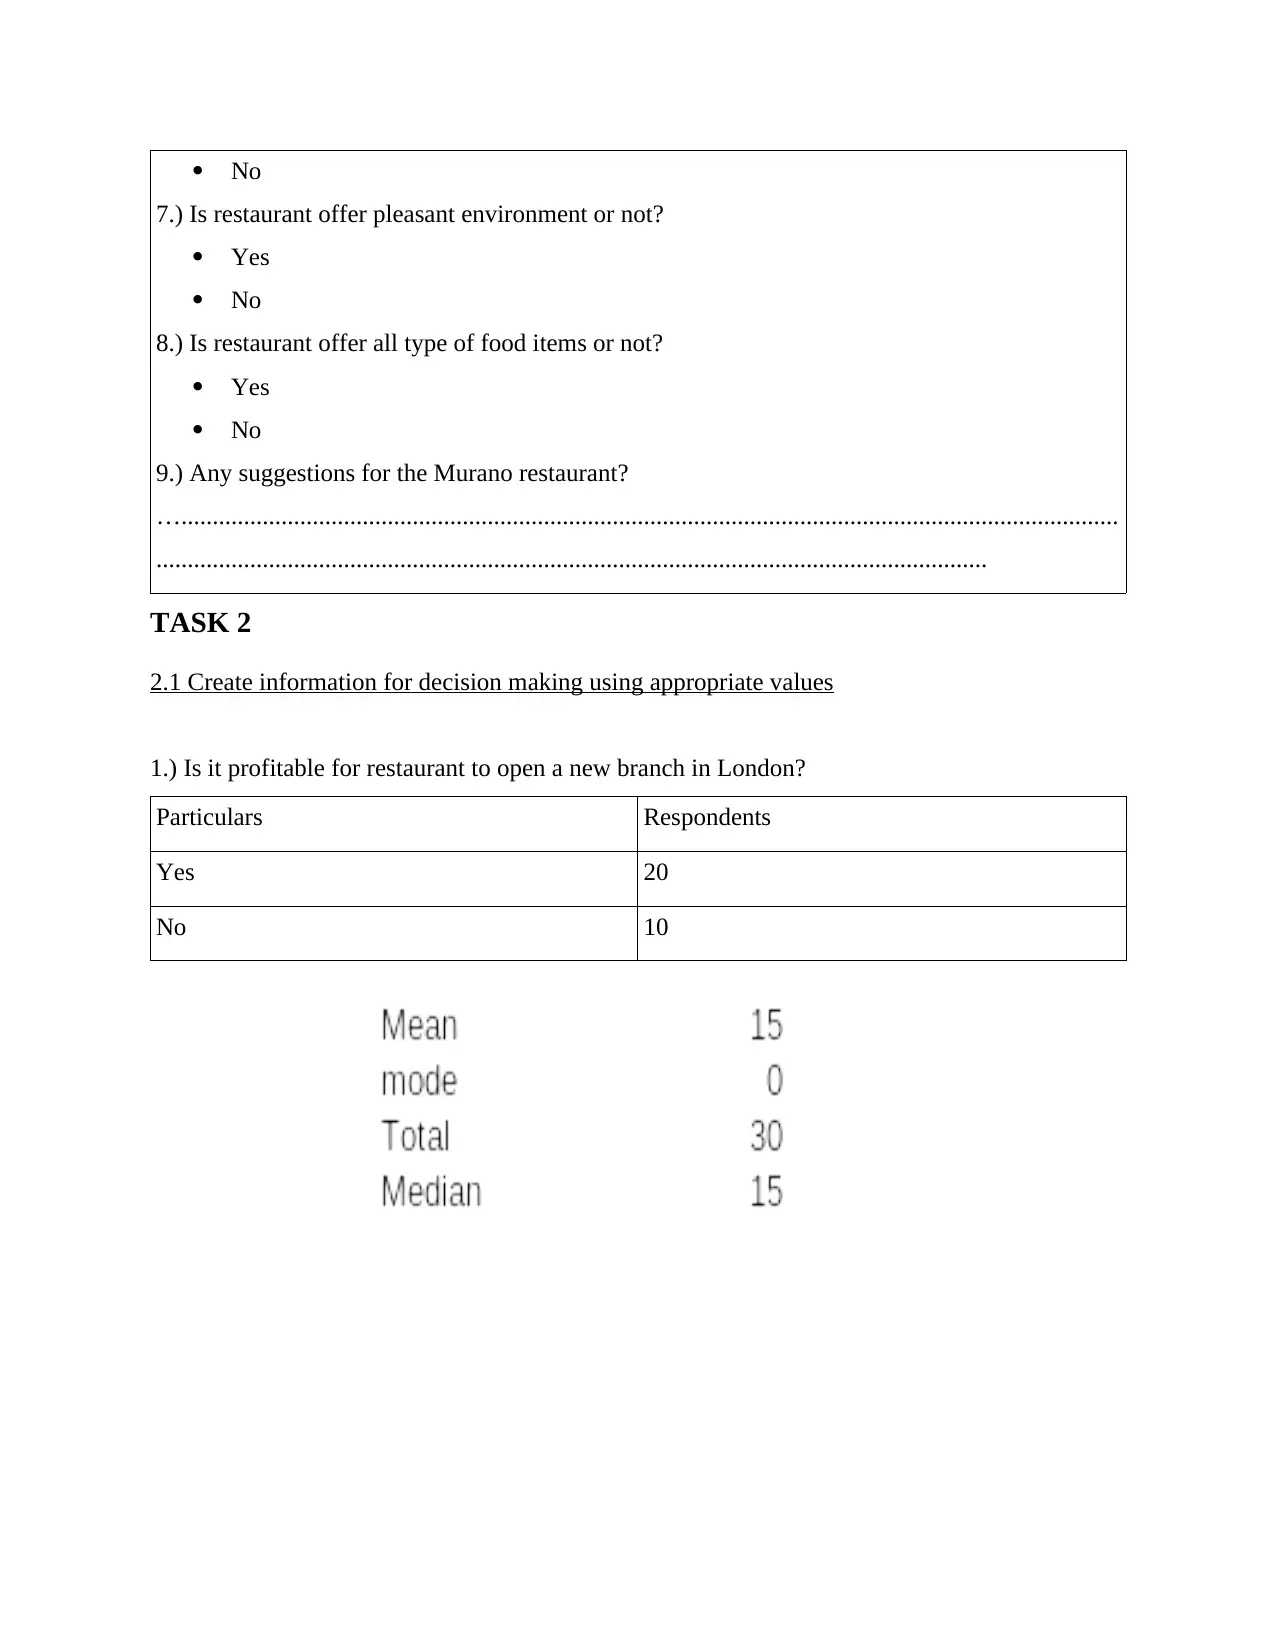
1.) Is it profitable for restaurant to open a new branch in London?
Particulars Respondents
Yes 20
No 10
7.) Is restaurant offer pleasant environment or not?
Yes
No
8.) Is restaurant offer all type of food items or not?
Yes
No
9.) Any suggestions for the Murano restaurant?
…......................................................................................................................................................
.....................................................................................................................................
TASK 2
2.1 Create information for decision making using appropriate values
1.) Is it profitable for restaurant to open a new branch in London?
Particulars Respondents
Yes 20
No 10
⊘ This is a preview!⊘
Do you want full access?
Subscribe today to unlock all pages.
Trusted by 1+ million students worldwide
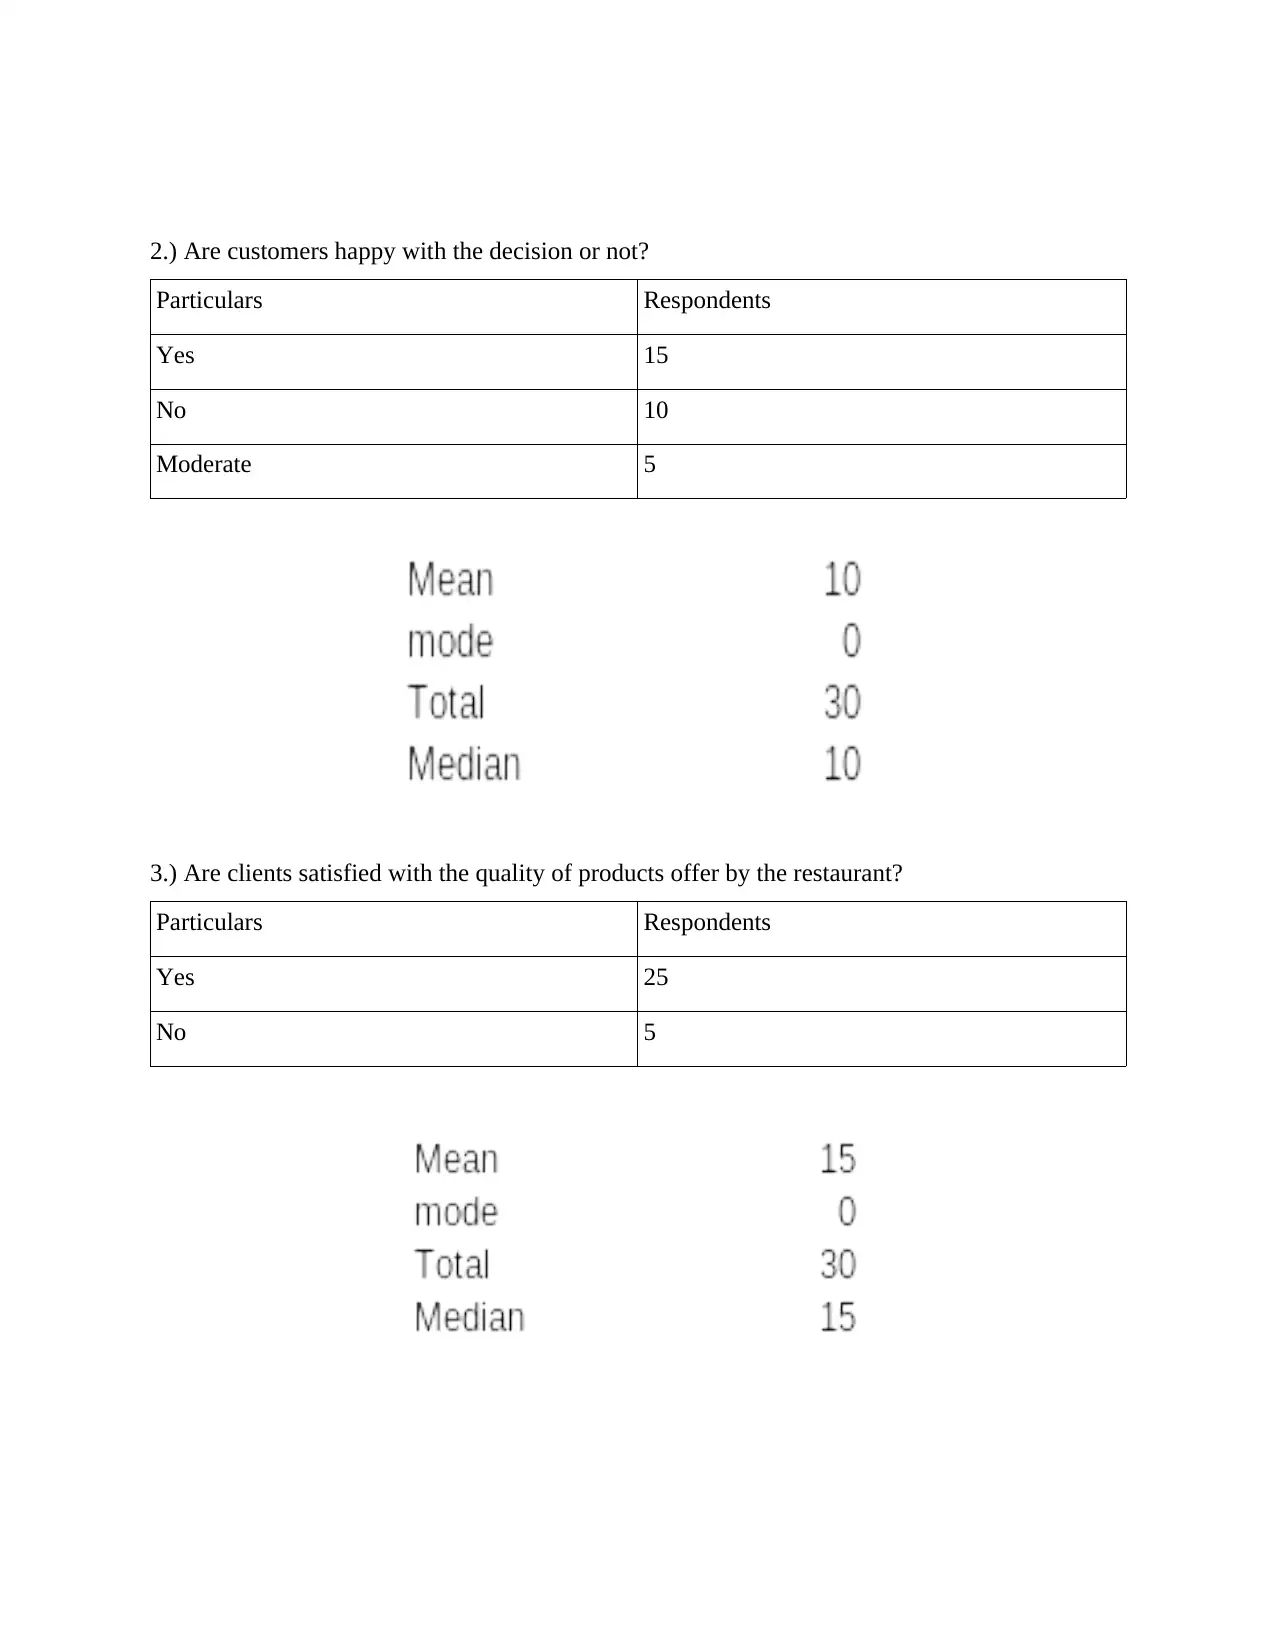
2.) Are customers happy with the decision or not?
Particulars Respondents
Yes 15
No 10
Moderate 5
3.) Are clients satisfied with the quality of products offer by the restaurant?
Particulars Respondents
Yes 25
No 5
Particulars Respondents
Yes 15
No 10
Moderate 5
3.) Are clients satisfied with the quality of products offer by the restaurant?
Particulars Respondents
Yes 25
No 5
Paraphrase This Document
Need a fresh take? Get an instant paraphrase of this document with our AI Paraphraser
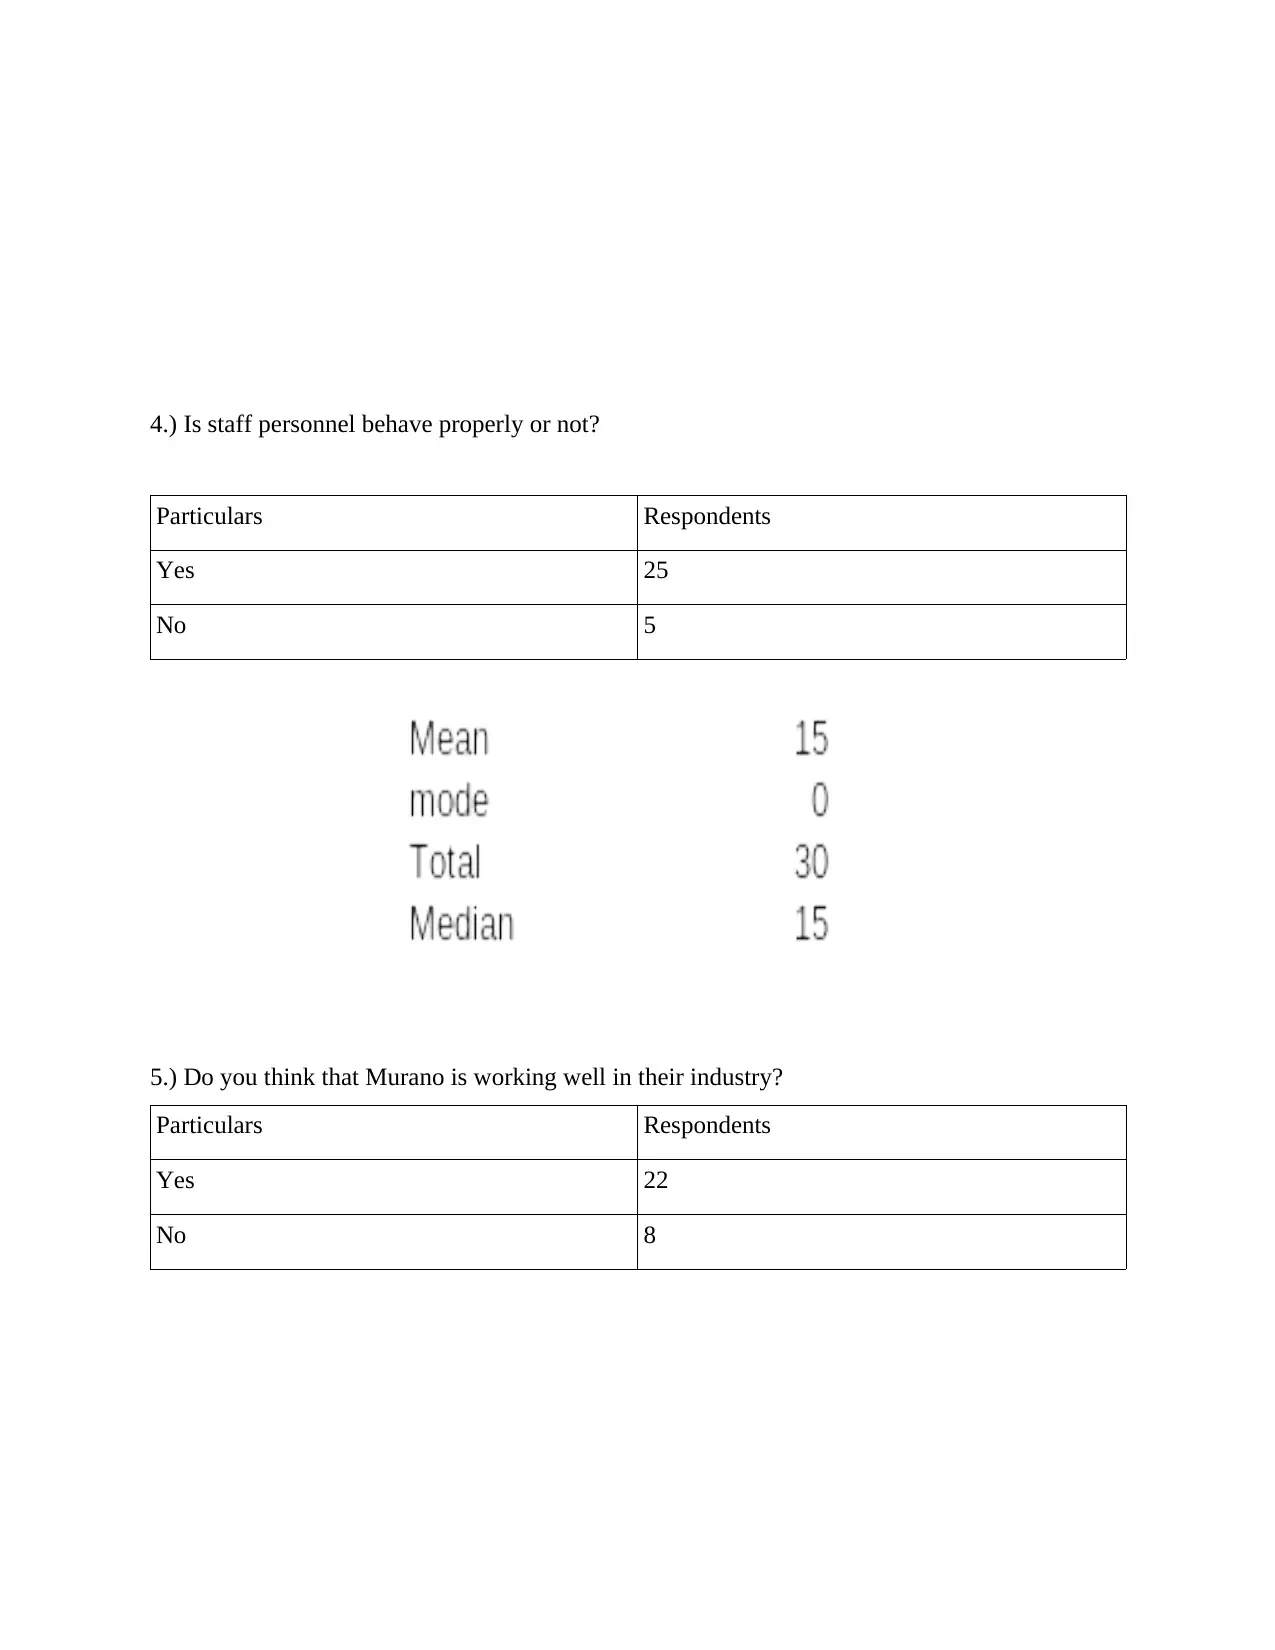
4.) Is staff personnel behave properly or not?
Particulars Respondents
Yes 25
No 5
5.) Do you think that Murano is working well in their industry?
Particulars Respondents
Yes 22
No 8
Particulars Respondents
Yes 25
No 5
5.) Do you think that Murano is working well in their industry?
Particulars Respondents
Yes 22
No 8
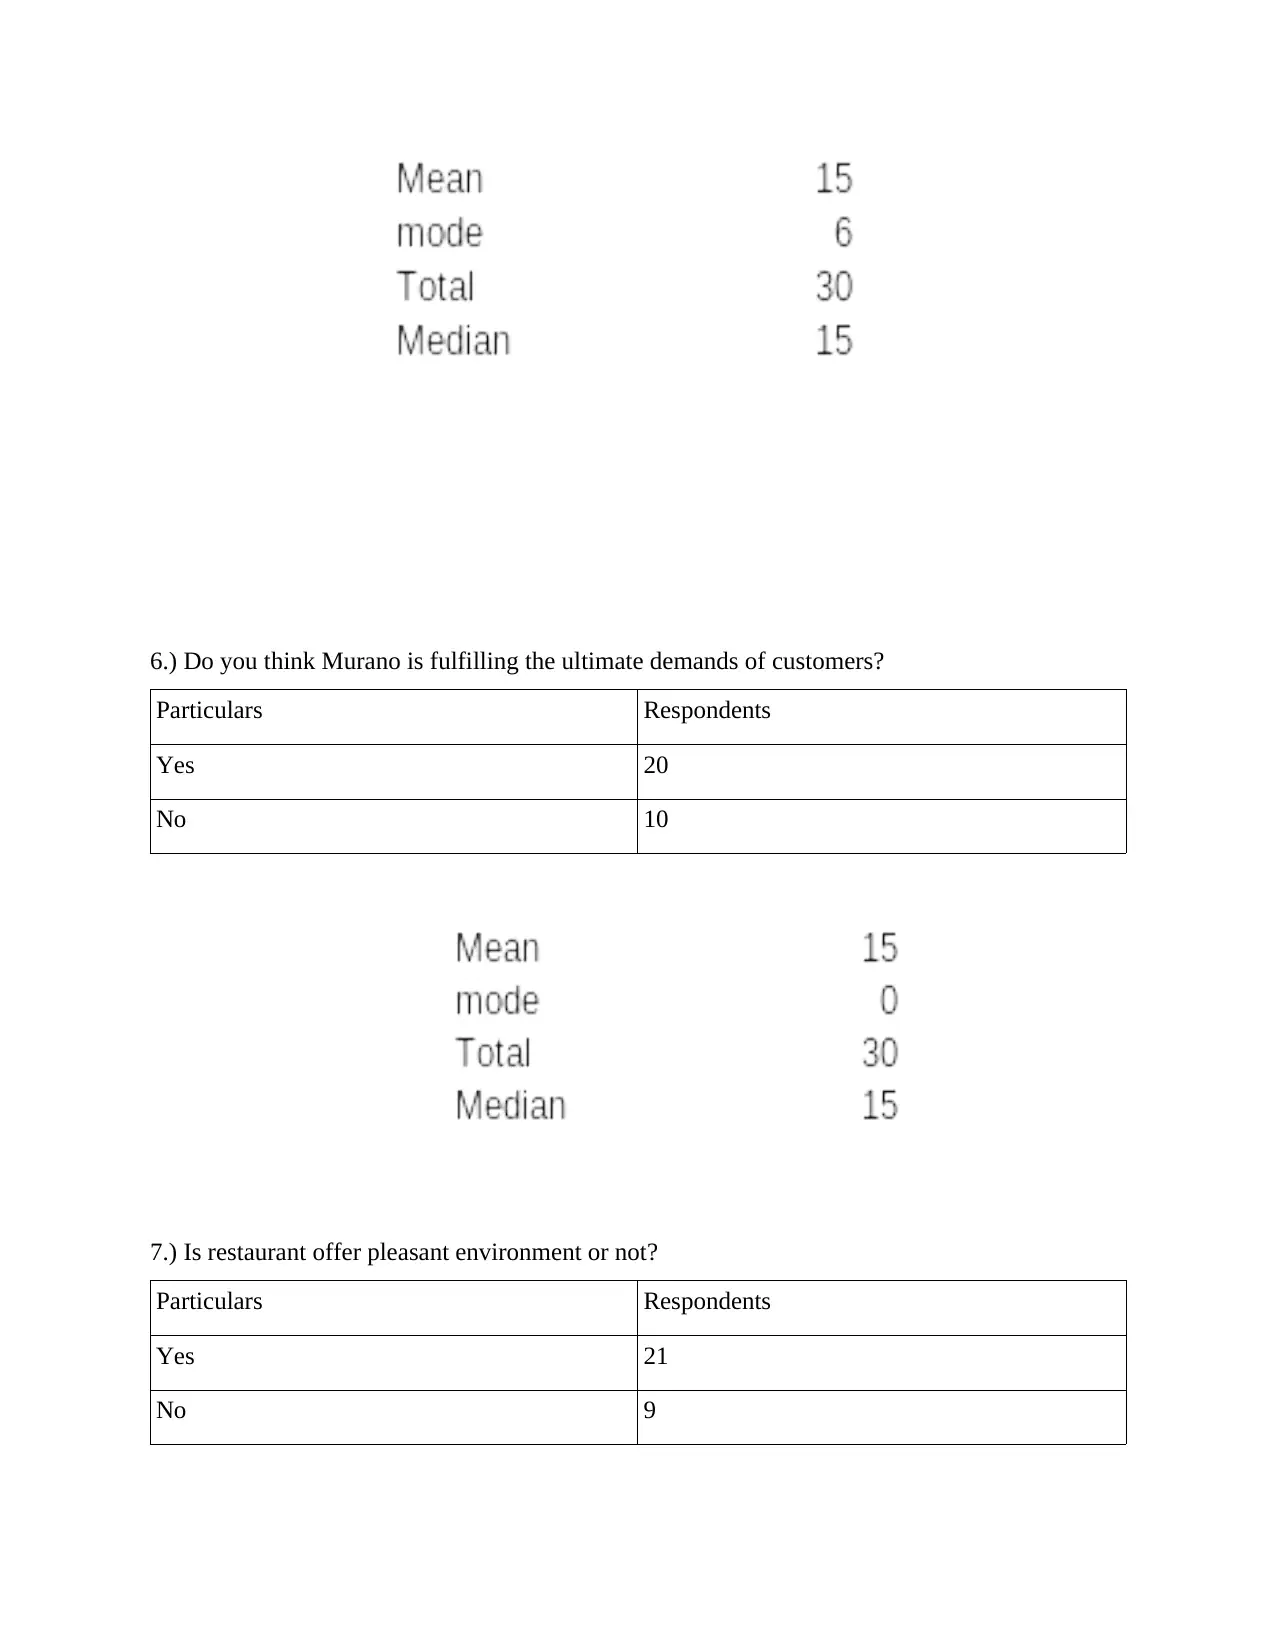
6.) Do you think Murano is fulfilling the ultimate demands of customers?
Particulars Respondents
Yes 20
No 10
7.) Is restaurant offer pleasant environment or not?
Particulars Respondents
Yes 21
No 9
Particulars Respondents
Yes 20
No 10
7.) Is restaurant offer pleasant environment or not?
Particulars Respondents
Yes 21
No 9
⊘ This is a preview!⊘
Do you want full access?
Subscribe today to unlock all pages.
Trusted by 1+ million students worldwide

8.) Is restaurant offer all type of food items or not?
Particulars Respondents
Yes 23
No 7
2.2 Analyse the results to draw conclusions
Year Sales Net Profit
2009 2560 1000
2010 4050 1200
2011 6000 1500
2012 2800 1800
2013 5990 1760
2014 8100 2000
2015 5200 1700
2016 7800 1896
2017 8000 1100
Particulars Sales Net Profit
Particulars Respondents
Yes 23
No 7
2.2 Analyse the results to draw conclusions
Year Sales Net Profit
2009 2560 1000
2010 4050 1200
2011 6000 1500
2012 2800 1800
2013 5990 1760
2014 8100 2000
2015 5200 1700
2016 7800 1896
2017 8000 1100
Particulars Sales Net Profit
Paraphrase This Document
Need a fresh take? Get an instant paraphrase of this document with our AI Paraphraser
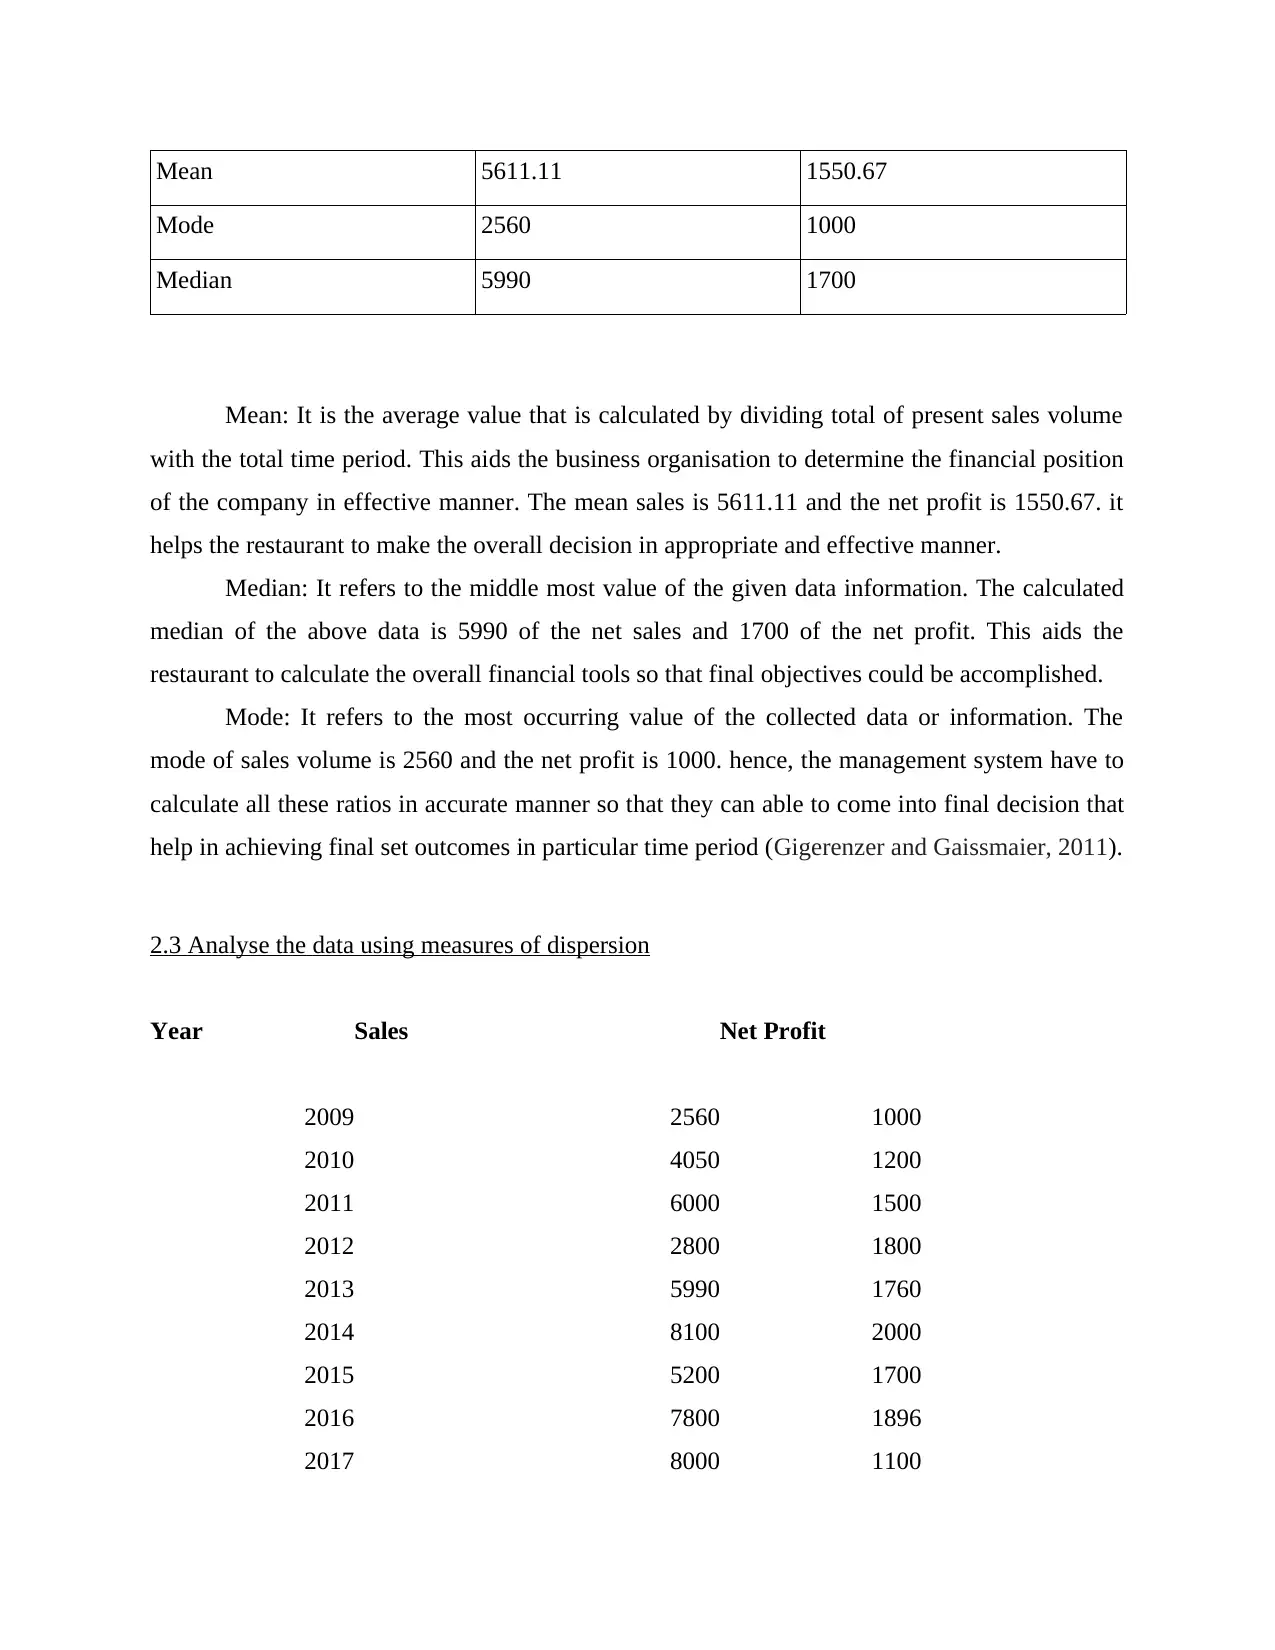
Mean 5611.11 1550.67
Mode 2560 1000
Median 5990 1700
Mean: It is the average value that is calculated by dividing total of present sales volume
with the total time period. This aids the business organisation to determine the financial position
of the company in effective manner. The mean sales is 5611.11 and the net profit is 1550.67. it
helps the restaurant to make the overall decision in appropriate and effective manner.
Median: It refers to the middle most value of the given data information. The calculated
median of the above data is 5990 of the net sales and 1700 of the net profit. This aids the
restaurant to calculate the overall financial tools so that final objectives could be accomplished.
Mode: It refers to the most occurring value of the collected data or information. The
mode of sales volume is 2560 and the net profit is 1000. hence, the management system have to
calculate all these ratios in accurate manner so that they can able to come into final decision that
help in achieving final set outcomes in particular time period (Gigerenzer and Gaissmaier, 2011).
2.3 Analyse the data using measures of dispersion
Year Sales Net Profit
2009 2560 1000
2010 4050 1200
2011 6000 1500
2012 2800 1800
2013 5990 1760
2014 8100 2000
2015 5200 1700
2016 7800 1896
2017 8000 1100
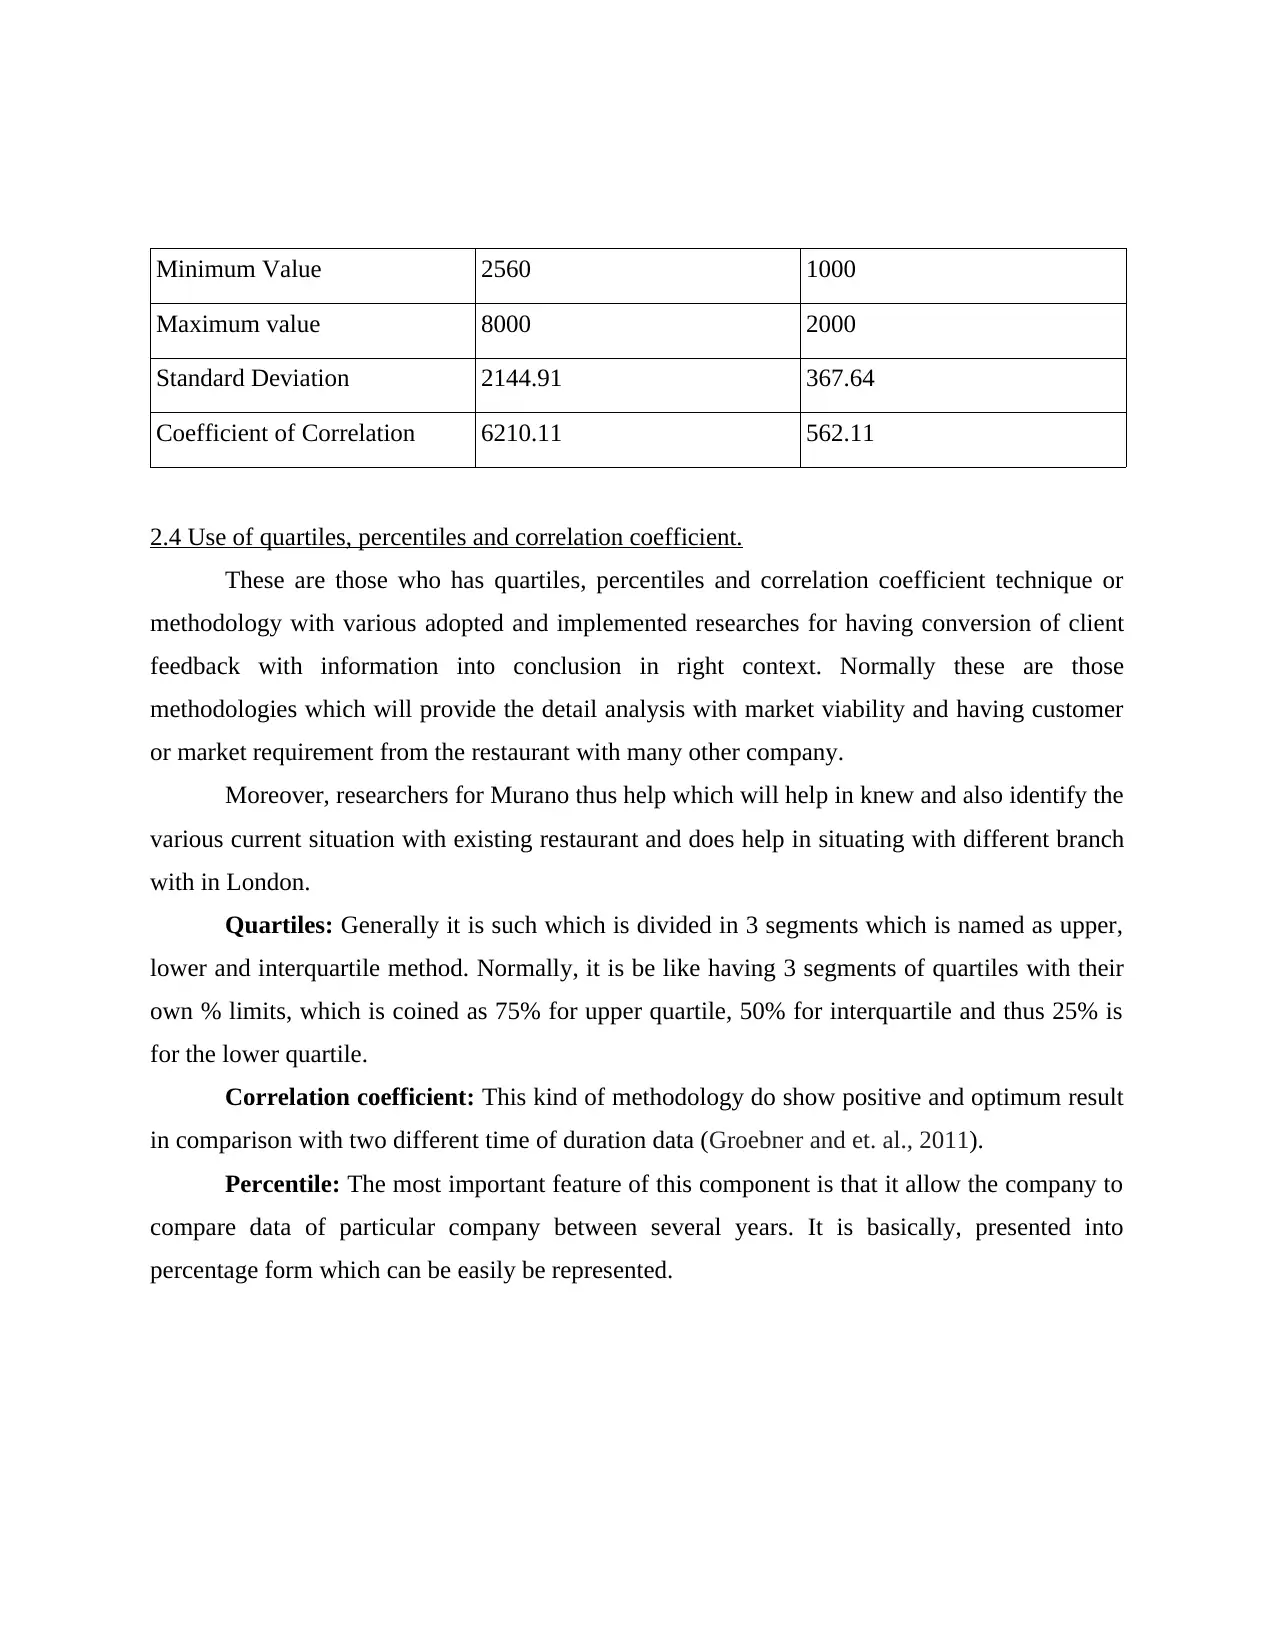
Minimum Value 2560 1000
Maximum value 8000 2000
Standard Deviation 2144.91 367.64
Coefficient of Correlation 6210.11 562.11
2.4 Use of quartiles, percentiles and correlation coefficient.
These are those who has quartiles, percentiles and correlation coefficient technique or
methodology with various adopted and implemented researches for having conversion of client
feedback with information into conclusion in right context. Normally these are those
methodologies which will provide the detail analysis with market viability and having customer
or market requirement from the restaurant with many other company.
Moreover, researchers for Murano thus help which will help in knew and also identify the
various current situation with existing restaurant and does help in situating with different branch
with in London.
Quartiles: Generally it is such which is divided in 3 segments which is named as upper,
lower and interquartile method. Normally, it is be like having 3 segments of quartiles with their
own % limits, which is coined as 75% for upper quartile, 50% for interquartile and thus 25% is
for the lower quartile.
Correlation coefficient: This kind of methodology do show positive and optimum result
in comparison with two different time of duration data (Groebner and et. al., 2011).
Percentile: The most important feature of this component is that it allow the company to
compare data of particular company between several years. It is basically, presented into
percentage form which can be easily be represented.
⊘ This is a preview!⊘
Do you want full access?
Subscribe today to unlock all pages.
Trusted by 1+ million students worldwide
1 out of 24
Related Documents


Your All-in-One AI-Powered Toolkit for Academic Success.
+13062052269
info@desklib.com
Available 24*7 on WhatsApp / Email
![[object Object]](/_next/static/media/star-bottom.7253800d.svg)
Unlock your academic potential
Copyright © 2020–2026 A2Z Services. All Rights Reserved. Developed and managed by ZUCOL.