Murano Restaurant: London Branch Business Decision Making Report
VerifiedAdded on  2020/07/23
|21
|3724
|51
Report
AI Summary
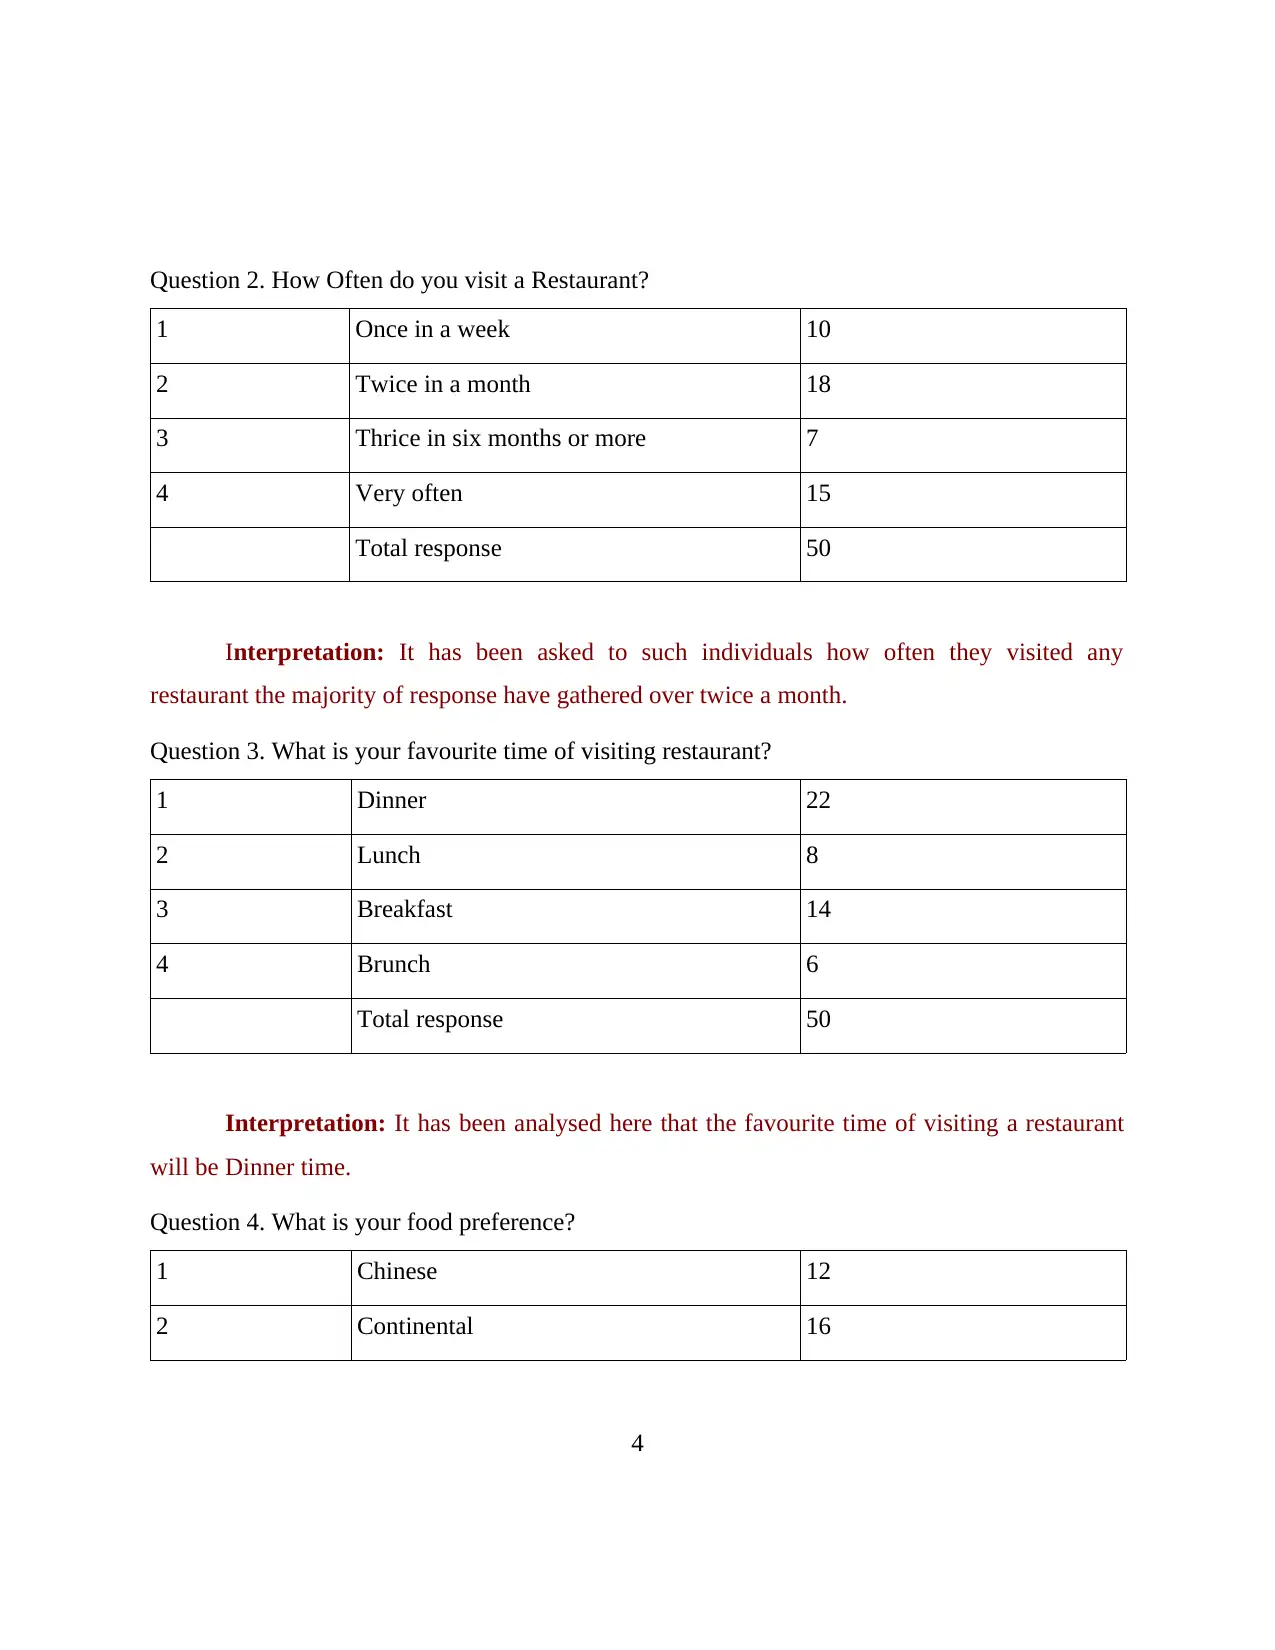
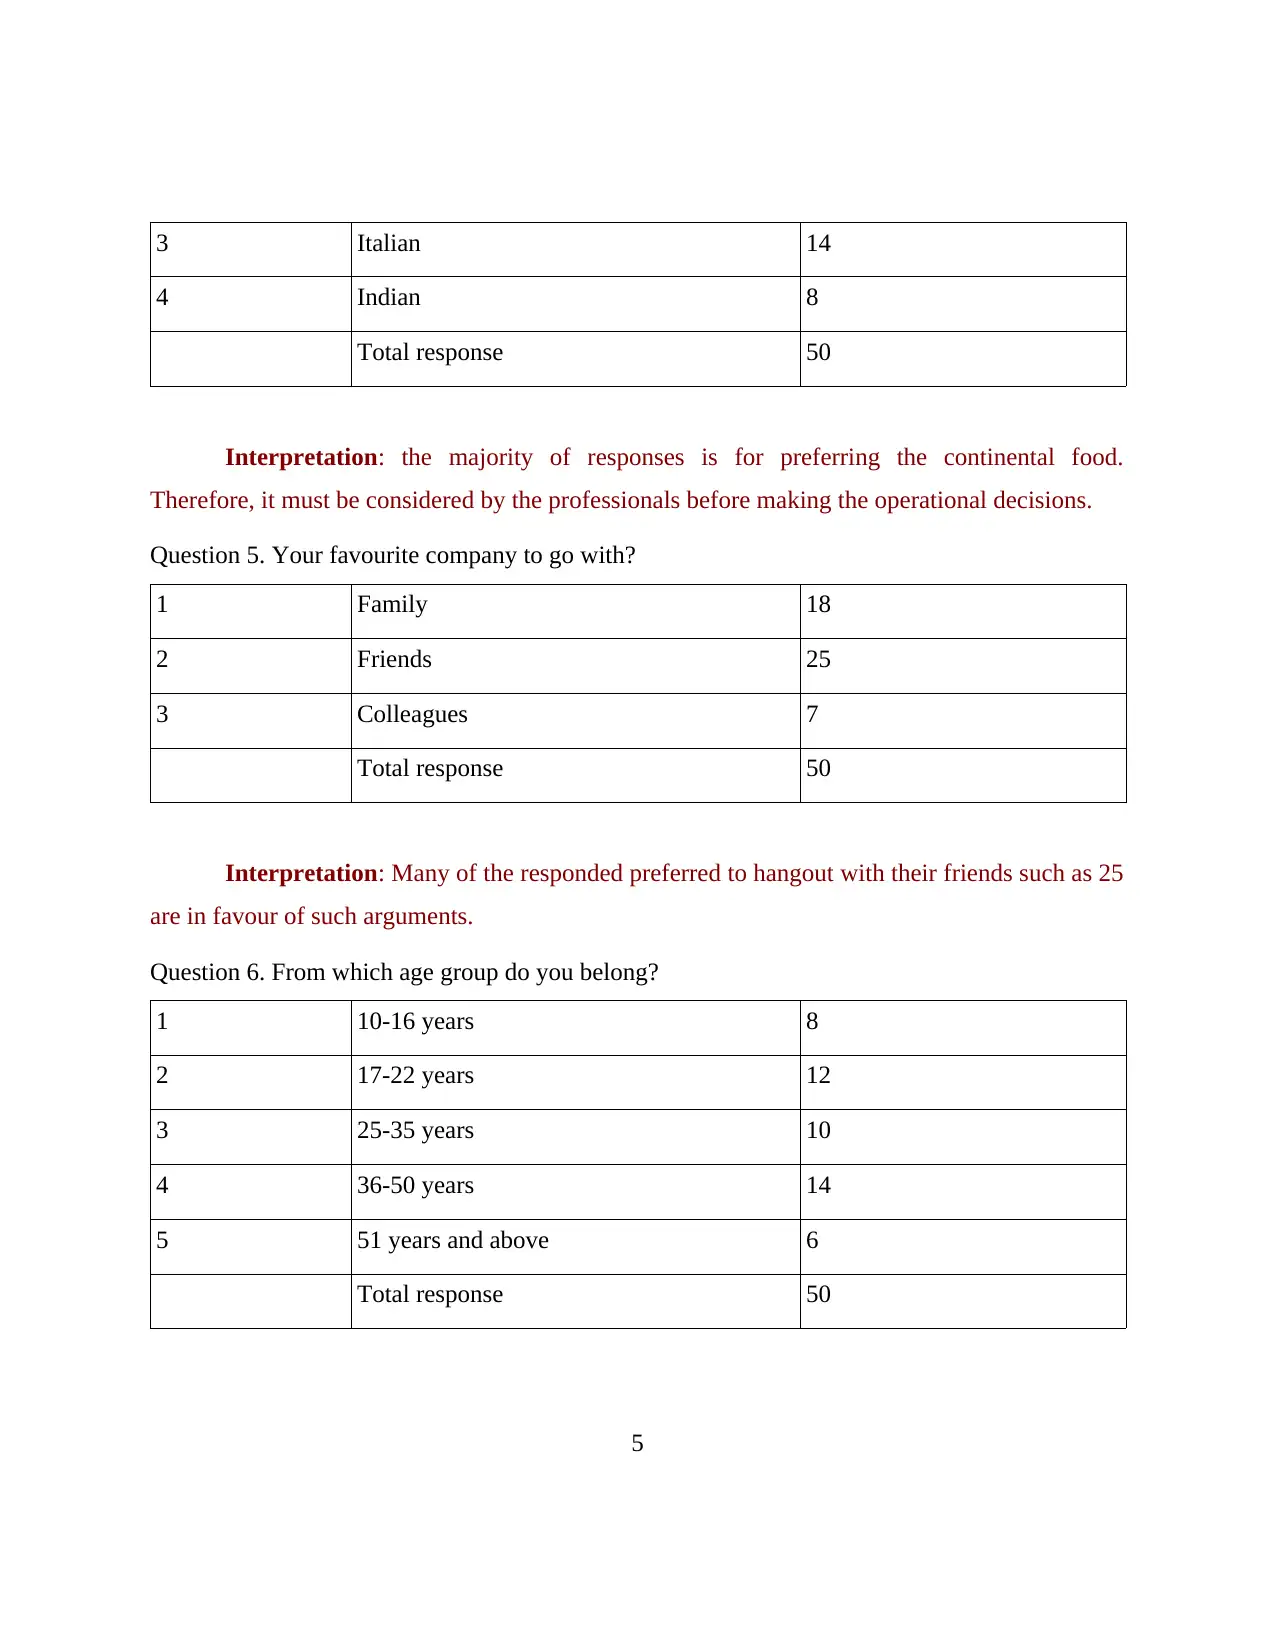
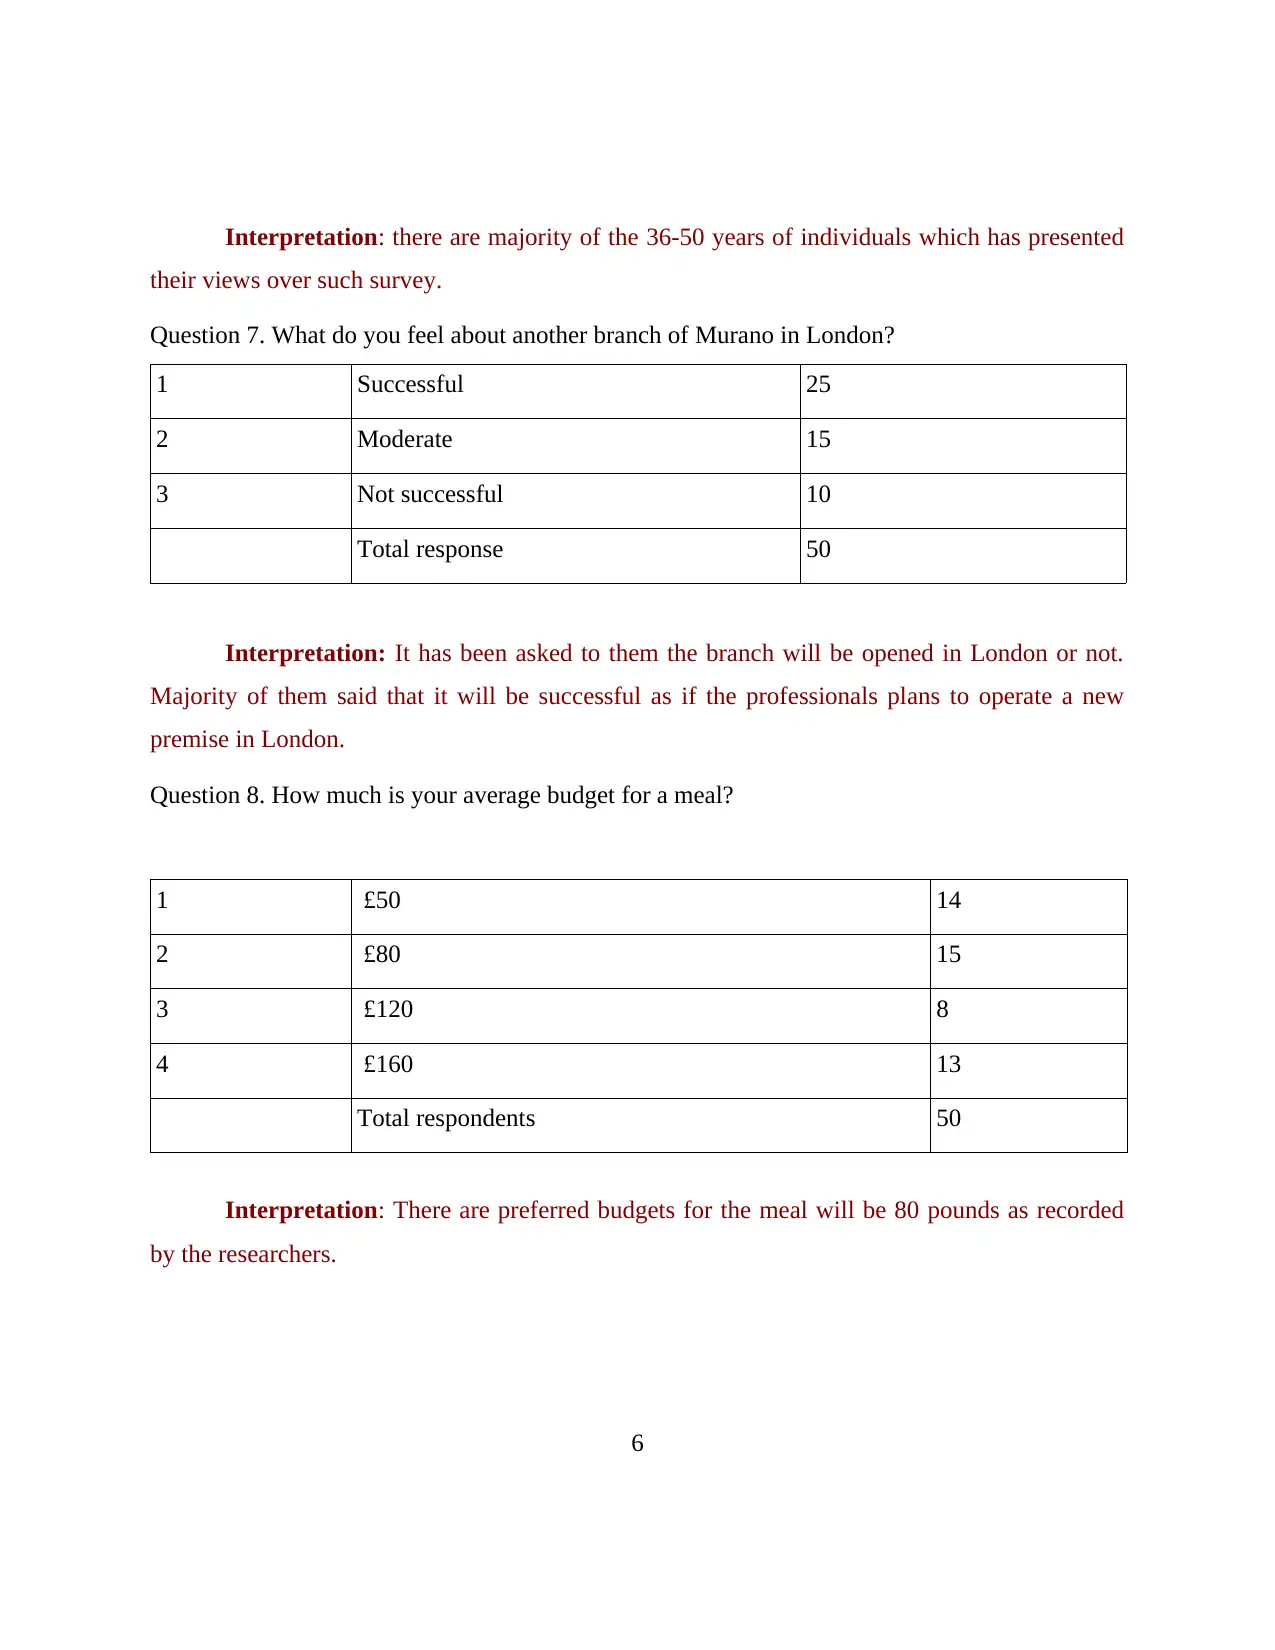
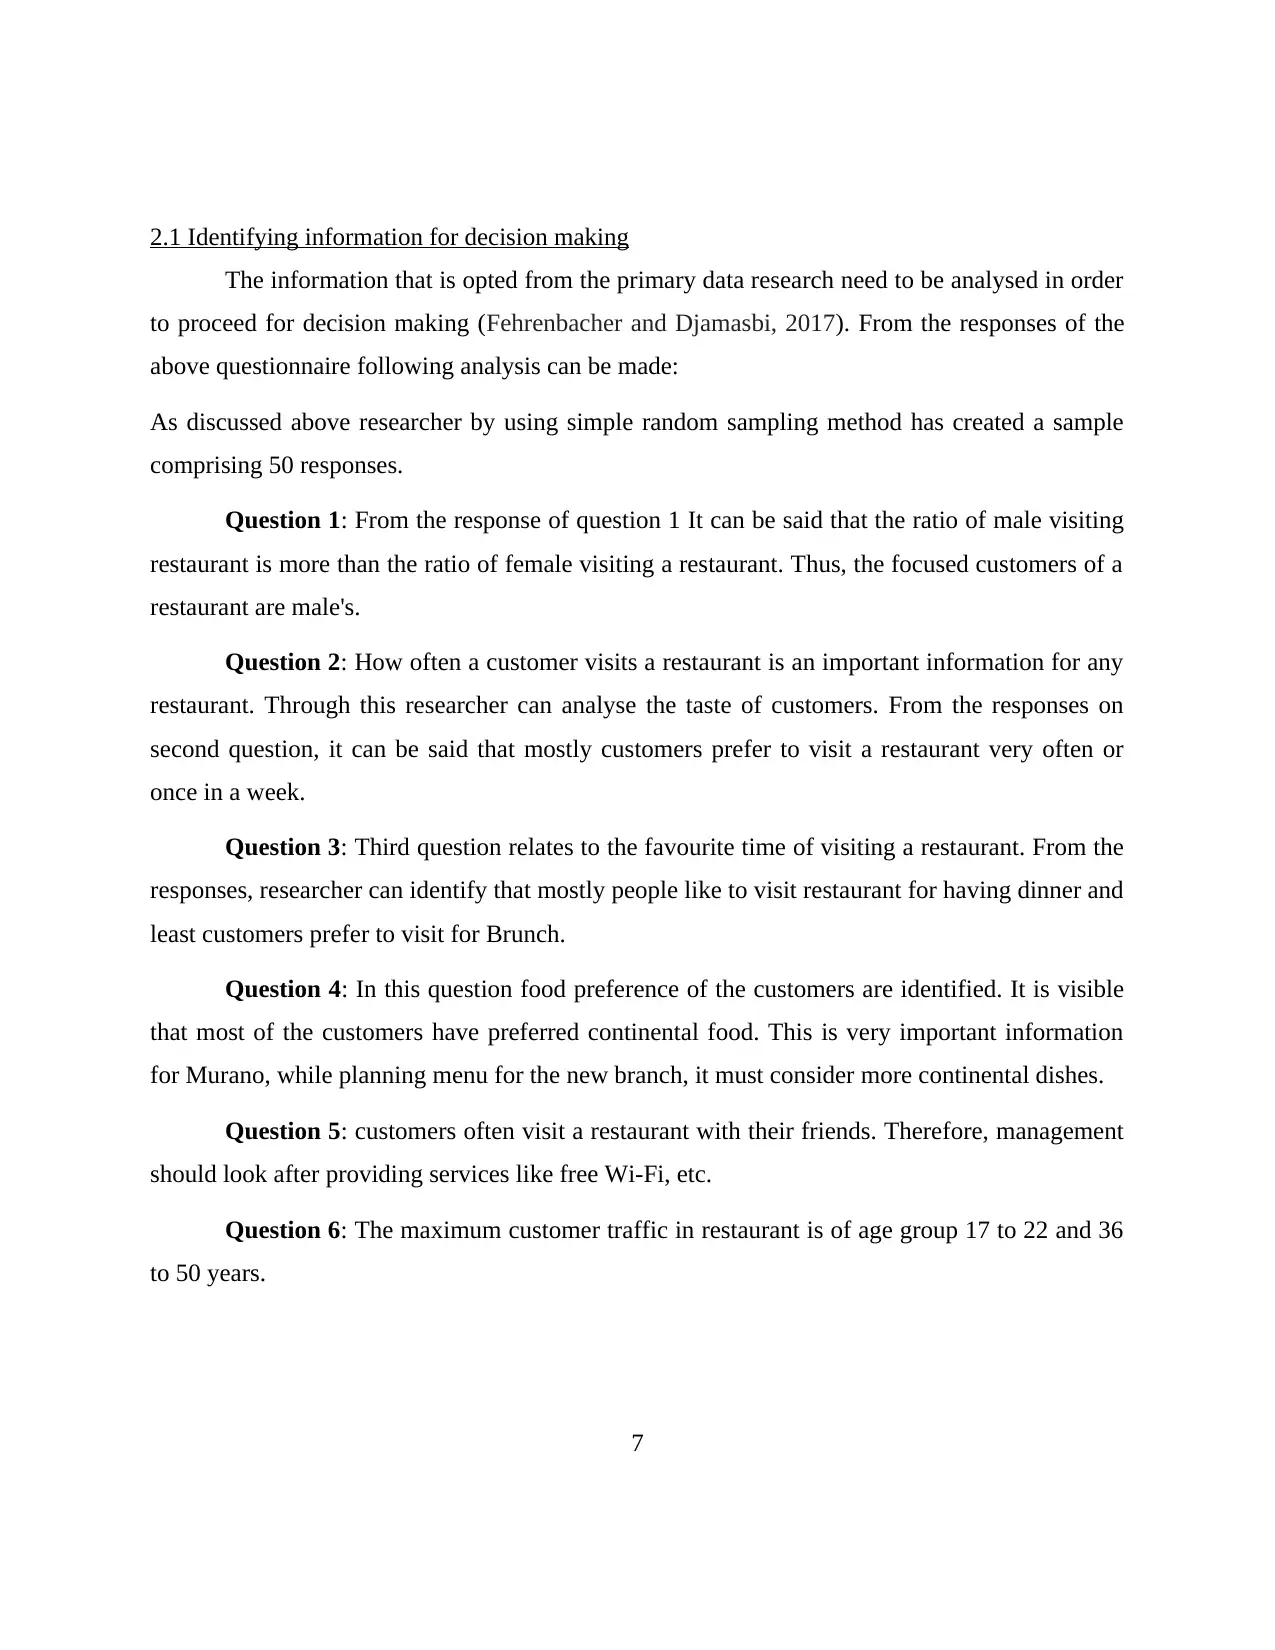
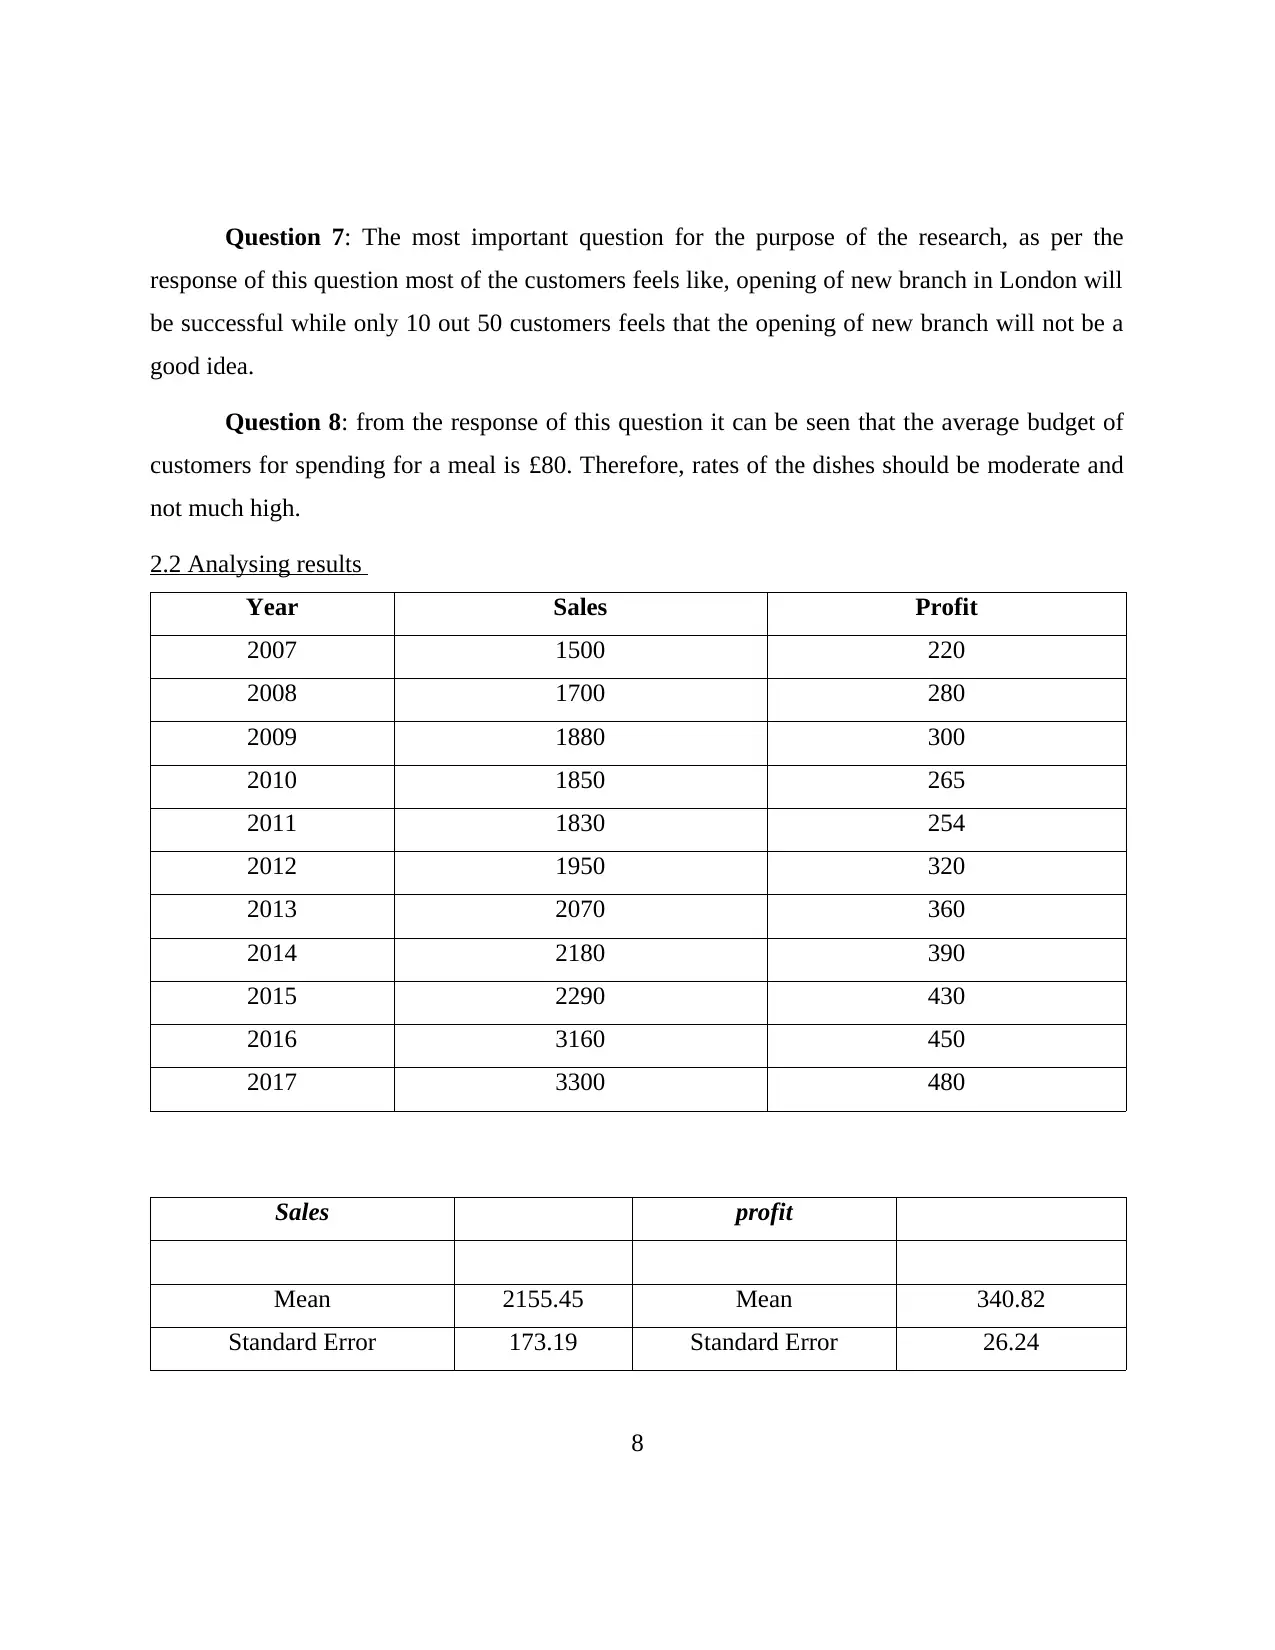
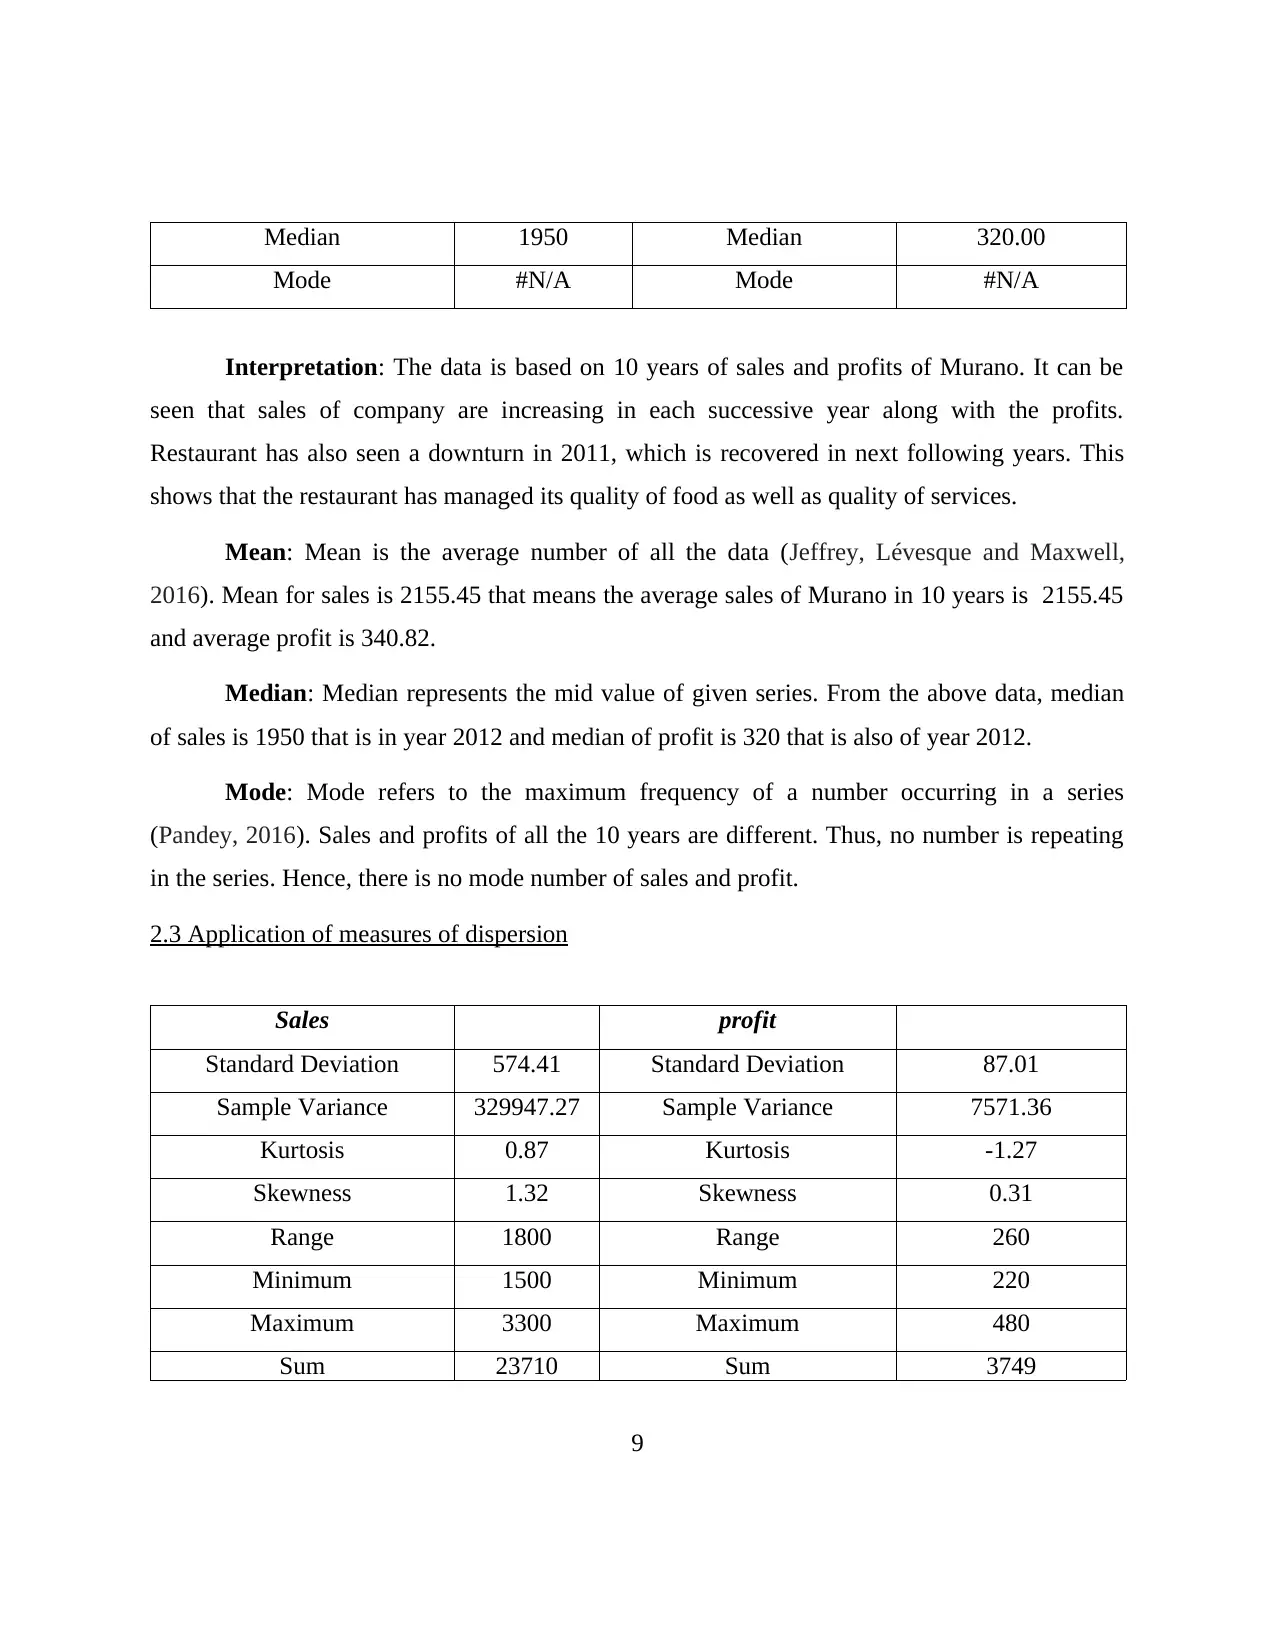
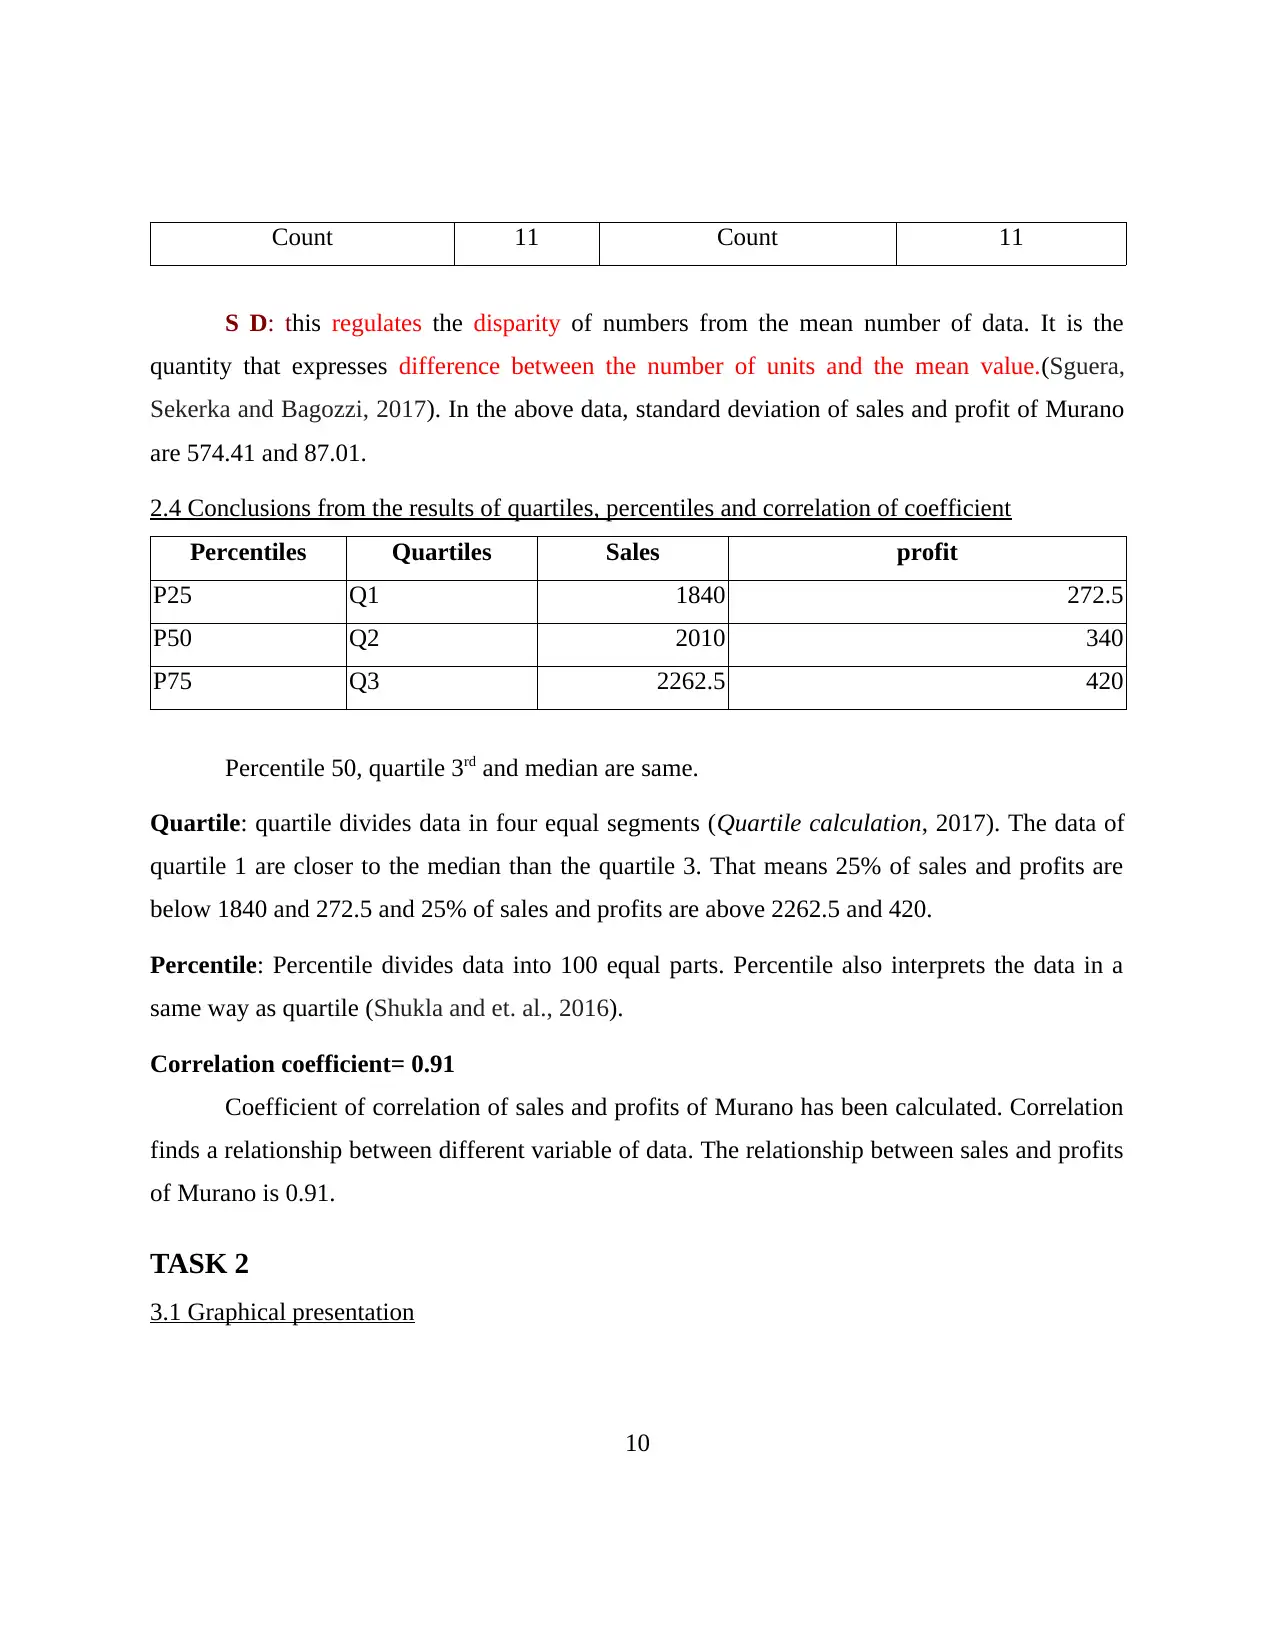
This report analyzes the business decision-making process for Murano Restaurant, focusing on the potential opening of a new branch in London. It details the collection of primary and secondary data, including methods like surveys and internal/external sources. The report discusses sampling frames and survey methodologies, highlighting the use of a questionnaire to gather customer preferences. It presents the results of the questionnaire, analyzing gender, restaurant visit frequency, preferred dining times, food preferences, company, age groups, opinions on the new branch, and average meal budgets. Furthermore, the report analyzes sales and profit data over several years, calculating measures of dispersion like mean, median, standard deviation, and applying quartile and percentile analysis to interpret the financial performance. A correlation coefficient is also calculated. The report concludes with recommendations based on the findings and includes a project plan for the proposed London branch.

Business Decision Making
Paraphrase This Document
Need a fresh take? Get an instant paraphrase of this document with our AI Paraphraser


INTRODUCTION
Decision making is ongoing process of any organisation. In order to run a business,
management and owners need to take various decisions regarding various matters of the
organisation. These decisions help in increasing the performance as well as increasing the
profitability of the organisation. And also helps in fetching solutions to many problems. The
present report is based on a similar decision making of a business. For this report the business
problems that has been considered is Opening a new branch of Murano restaurant in London.
The report involves procedures and methods of collection of data that will provide useful
information in the context of business problem. Sampling and survey method that a researcher
can use in further processing of data collected. The report also provides a sample questionnaire
that researcher can use in obtaining necessary information and data. Further, in this report,
measures of dispersion on the sales and profit amount of Murano has been applied, analysed and
interpreted. A project plan is also provided along with the formal report to the Board of directors
of Murano.
TASK 1
1.1 Collection of primary and secondary data
Data collection refers to process of preparing and collecting data for research subject. It
involves gathering of data that has been systematically organised, observed and recorded in a
systematic form, from various different sources. In the process of decision making in any
organisation, data are the basic inputs which are then processed to get the outputs. The main
purpose of data collection is to obtain information, maintaining records, and making of decisions
regarding important issues (Beach and Lipshitz, 2017). For the purpose of planning the opening
of second restaurant in London, Primary and secondary data can be collected by Murano.
Primary data collection method
Primary data is the specific information which is collected for assessing crucial
information specially for the purpose of research question. These can be collected by:
1
⊘ This is a preview!⊘
Do you want full access?
Subscribe today to unlock all pages.

Trusted by 1+ million students worldwide

ï‚· Conducting personal surveys that includes organising interviews, telephonic
communication, etc.
ï‚· By conducting experiments.
ï‚· By mechanical observation and simulation (Bennun and et.al., 2017).
ï‚· By human observation and referring case studies.
Methods of collecting secondary data
Secondary data is the data that has been used already for any purpose. These are the data
that are gathered and collected by someone else for some another purpose. This is cost effective
and requires less consumption of time. These can be collected by:
ï‚· Internal sources that includes cost information, feedbacks from customers, sales records,
distributor's feedback and report, etc.
ï‚· External sources that includes collection of data from internet, journals, books,
newspapers, library, etc.
1.2 Sampling frame and survey methodology used in data collection
The researcher for the purpose of collecting relevant data can chose to collect primary
data by sending questionnaire to the customers by email and asking for response. Through this
method researcher will get the exact data regarding the needs and expectation of customers. And
from the response's researcher can also interpret the success of the new branch in London.
Sampling methods are of two types that are probability sampling and non-probability sampling
(Calabrese and et.al., 2017).
The Probability sampling method: This method revolves around the facts and figures, that each
and every individual present on this earth has equal chance of being selected. Following are the
methods of probability sampling:
ï‚· Basic Sampling
2
Paraphrase This Document
Need a fresh take? Get an instant paraphrase of this document with our AI Paraphraser

ï‚· Stratified
ï‚· Cluster
ï‚· Systematicï‚· Multistage
The Non-probability Sampling method: This technique does not contain any units of the
population does not have a known probability of being selected (Chen, 2017). Instead, the
sample units under this method is selected as per the convenience of researcher. Following are
the methods of Non-probability sampling:
ï‚· Volunteer
ï‚· Convenience or haphazard
Researcher has an option of choosing any of the sampling method mentioned above for
the purpose of obtaining a sample from responses that he got from the questionnaire. The best
method of sampling for researcher would be Simple random sampling. It is assumed that the
researcher has sent questionnaire to 200 customers, out of which he got responses of 180
customers. From these 180 responses, researcher has taken a sample of 50 responses using
simple random sampling method.
1.3 Questionnaire for opening second restaurant in London
Question 1. Gender
1 Male 32
2 Female 18
Total responses 50
Interpretation: In the above mentioned question It has been asked to the 50 responded
over which 32 were male and 18 were female.
3

Question 2. How Often do you visit a Restaurant?
1 Once in a week 10
2 Twice in a month 18
3 Thrice in six months or more 7
4 Very often 15
Total response 50
Interpretation: It has been asked to such individuals how often they visited any
restaurant the majority of response have gathered over twice a month.
Question 3. What is your favourite time of visiting restaurant?
1 Dinner 22
2 Lunch 8
3 Breakfast 14
4 Brunch 6
Total response 50
Interpretation: It has been analysed here that the favourite time of visiting a restaurant
will be Dinner time.
Question 4. What is your food preference?
1 Chinese 12
2 Continental 16
4
⊘ This is a preview!⊘
Do you want full access?
Subscribe today to unlock all pages.

Trusted by 1+ million students worldwide

3 Italian 14
4 Indian 8
Total response 50
Interpretation: the majority of responses is for preferring the continental food.
Therefore, it must be considered by the professionals before making the operational decisions.
Question 5. Your favourite company to go with?
1 Family 18
2 Friends 25
3 Colleagues 7
Total response 50
Interpretation: Many of the responded preferred to hangout with their friends such as 25
are in favour of such arguments.
Question 6. From which age group do you belong?
1 10-16 years 8
2 17-22 years 12
3 25-35 years 10
4 36-50 years 14
5 51 years and above 6
Total response 50
5
Paraphrase This Document
Need a fresh take? Get an instant paraphrase of this document with our AI Paraphraser

Interpretation: there are majority of the 36-50 years of individuals which has presented
their views over such survey.
Question 7. What do you feel about another branch of Murano in London?
1 Successful 25
2 Moderate 15
3 Not successful 10
Total response 50
Interpretation: It has been asked to them the branch will be opened in London or not.
Majority of them said that it will be successful as if the professionals plans to operate a new
premise in London.
Question 8. How much is your average budget for a meal?
1 £50 14
2 £80 15
3 £120 8
4 £160 13
Total respondents 50
Interpretation: There are preferred budgets for the meal will be 80 pounds as recorded
by the researchers.
6

2.1 Identifying information for decision making
The information that is opted from the primary data research need to be analysed in order
to proceed for decision making (Fehrenbacher and Djamasbi, 2017). From the responses of the
above questionnaire following analysis can be made:
As discussed above researcher by using simple random sampling method has created a sample
comprising 50 responses.
Question 1: From the response of question 1 It can be said that the ratio of male visiting
restaurant is more than the ratio of female visiting a restaurant. Thus, the focused customers of a
restaurant are male's.
Question 2: How often a customer visits a restaurant is an important information for any
restaurant. Through this researcher can analyse the taste of customers. From the responses on
second question, it can be said that mostly customers prefer to visit a restaurant very often or
once in a week.
Question 3: Third question relates to the favourite time of visiting a restaurant. From the
responses, researcher can identify that mostly people like to visit restaurant for having dinner and
least customers prefer to visit for Brunch.
Question 4: In this question food preference of the customers are identified. It is visible
that most of the customers have preferred continental food. This is very important information
for Murano, while planning menu for the new branch, it must consider more continental dishes.
Question 5: customers often visit a restaurant with their friends. Therefore, management
should look after providing services like free Wi-Fi, etc.
Question 6: The maximum customer traffic in restaurant is of age group 17 to 22 and 36
to 50 years.
7
⊘ This is a preview!⊘
Do you want full access?
Subscribe today to unlock all pages.

Trusted by 1+ million students worldwide

Question 7: The most important question for the purpose of the research, as per the
response of this question most of the customers feels like, opening of new branch in London will
be successful while only 10 out 50 customers feels that the opening of new branch will not be a
good idea.
Question 8: from the response of this question it can be seen that the average budget of
customers for spending for a meal is £80. Therefore, rates of the dishes should be moderate and
not much high.
2.2 Analysing results
Year Sales Profit
2007 1500 220
2008 1700 280
2009 1880 300
2010 1850 265
2011 1830 254
2012 1950 320
2013 2070 360
2014 2180 390
2015 2290 430
2016 3160 450
2017 3300 480
Sales profit
Mean 2155.45 Mean 340.82
Standard Error 173.19 Standard Error 26.24
8
Paraphrase This Document
Need a fresh take? Get an instant paraphrase of this document with our AI Paraphraser

Median 1950 Median 320.00
Mode #N/A Mode #N/A
Interpretation: The data is based on 10 years of sales and profits of Murano. It can be
seen that sales of company are increasing in each successive year along with the profits.
Restaurant has also seen a downturn in 2011, which is recovered in next following years. This
shows that the restaurant has managed its quality of food as well as quality of services.
Mean: Mean is the average number of all the data (Jeffrey, Lévesque and Maxwell,
2016). Mean for sales is 2155.45 that means the average sales of Murano in 10 years is 2155.45
and average profit is 340.82.
Median: Median represents the mid value of given series. From the above data, median
of sales is 1950 that is in year 2012 and median of profit is 320 that is also of year 2012.
Mode: Mode refers to the maximum frequency of a number occurring in a series
(Pandey, 2016). Sales and profits of all the 10 years are different. Thus, no number is repeating
in the series. Hence, there is no mode number of sales and profit.
2.3 Application of measures of dispersion
Sales profit
Standard Deviation 574.41 Standard Deviation 87.01
Sample Variance 329947.27 Sample Variance 7571.36
Kurtosis 0.87 Kurtosis -1.27
Skewness 1.32 Skewness 0.31
Range 1800 Range 260
Minimum 1500 Minimum 220
Maximum 3300 Maximum 480
Sum 23710 Sum 3749
9

Count 11 Count 11
S D: this regulates the disparity of numbers from the mean number of data. It is the
quantity that expresses difference between the number of units and the mean value.(Sguera,
Sekerka and Bagozzi, 2017). In the above data, standard deviation of sales and profit of Murano
are 574.41 and 87.01.
2.4 Conclusions from the results of quartiles, percentiles and correlation of coefficient
Percentiles Quartiles Sales profit
P25 Q1 1840 272.5
P50 Q2 2010 340
P75 Q3 2262.5 420
Percentile 50, quartile 3rd and median are same.
Quartile: quartile divides data in four equal segments (Quartile calculation, 2017). The data of
quartile 1 are closer to the median than the quartile 3. That means 25% of sales and profits are
below 1840 and 272.5 and 25% of sales and profits are above 2262.5 and 420.
Percentile: Percentile divides data into 100 equal parts. Percentile also interprets the data in a
same way as quartile (Shukla and et. al., 2016).
Correlation coefficient= 0.91
Coefficient of correlation of sales and profits of Murano has been calculated. Correlation
finds a relationship between different variable of data. The relationship between sales and profits
of Murano is 0.91.
TASK 2
3.1 Graphical presentation
10
⊘ This is a preview!⊘
Do you want full access?
Subscribe today to unlock all pages.

Trusted by 1+ million students worldwide
1 out of 21
Related Documents

Your All-in-One AI-Powered Toolkit for Academic Success.
 +13062052269
info@desklib.com
Available 24*7 on WhatsApp / Email
Unlock your academic potential
Copyright © 2020–2025 A2Z Services. All Rights Reserved. Developed and managed by ZUCOL.