Business Decision Making: Analyzing Murano Restaurant's Strategy
VerifiedAdded on 2023/04/04
|19
|3425
|143
Report
AI Summary
This report provides a comprehensive analysis of business decision-making processes for Murano Restaurant, focusing on its potential expansion in London. The report begins with an introduction to the importance of business decisions and the context of Murano Restaurant. It outlines the plan for collecting primary and secondary data, including survey methodology, sampling framework, and questionnaire design. The analysis includes calculations of mean, mode, median, dispersion, percentiles, and correlation coefficients to assess sales performance and identify trends. Furthermore, the report analyzes survey results, provides a trend line analysis, and discusses the development of a business presentation and formal business report. Finally, it explores appropriate information processing tools, critical path analysis, network diagrams, and financial tools relevant to the restaurant's expansion. The conclusion summarizes key findings and recommendations, supported by relevant references.
Business Decision Making
Paraphrase This Document
Need a fresh take? Get an instant paraphrase of this document with our AI Paraphraser
Contents
Introduction.................................................................................................................................................3
Task 1..........................................................................................................................................................3
1.1 Plan for collection of primary and secondary data.............................................................................3
1.2 Survey methodology and sampling frame work.................................................................................4
1.3 Design questionnaire.........................................................................................................................5
Task 2..........................................................................................................................................................6
2.1 Mean mode and median calculation...................................................................................................6
2.2 Analyses of the results.......................................................................................................................7
2.3 Calculation of Dispersion..................................................................................................................8
2.4 Calculation of percentiles and correlation coefficient........................................................................9
Task 3........................................................................................................................................................11
3.1 Data analyses...................................................................................................................................11
3.2 trend line..........................................................................................................................................14
3.3 Business presentation.......................................................................................................................14
3.4 Formal business report.....................................................................................................................14
Task 4........................................................................................................................................................15
4.1 Appropriate information processing tool.........................................................................................15
4.2 Critical path and network diagram...................................................................................................16
4.3 Financial tools.................................................................................................................................16
Conclusion.................................................................................................................................................18
References.................................................................................................................................................19
Introduction
Business decisions are most important part of any organization that can influence the
overall performance of an entity. Organizations have too many options but they have to
select most appropriate so that they can sustain in the corporate market for longer duration
(Laureiro‐Martínez and et.al, 2015). London is the most dynamic city of world, there are
many opportunities for a new firm to get high profit. Present report is based on Murano
restaurant which is working well in London, cited firm is planning to open its second
restaurant. Current assignment will create a plan for collecting a data from reliable sources.
Survey methodology and sampling frame work will be described in this study (Amankwah-
Amoah, 2015). In addition questionnaire will be designed and on the bases of collected
information, data will be analyzed. Investment appraisal techniques will be discussed in order
to take correct decision for the growth of Murano restaurant .
Task 1
1.1 Plan for collection of primary and secondary data
Collection of data is the most important part of any study, by this way company can
identify the root cause of the problems and can take proper decisions in order to resolve
business problems (Vitell, Singhapakdi and Nishihara, 2015). Currently Murano restaurant is
planning to open second restaurant in London city so it is necessary for the cited firm to do
research on business problems. There are several sources that can help in collection of
relevant information:
Primary sources
Secondary sources
Primary information are such data which have been collected by researcher by own and
these are first hand information. There are several sources that can support in collecting
primary information such as questionnaire, survey, interview etc (Saaty and Peniwati, 2013).
Murano restaurant is working well but before opening its new branch it will have to know
about needs and wants of consumers, so that in the new restaurant cited firm can serve
delicious food to them as per their demand. That would help in getting higher returns and
⊘ This is a preview!⊘
Do you want full access?
Subscribe today to unlock all pages.
Trusted by 1+ million students worldwide
new restaurant will get established soon. For the needs of users, scholar has prepared
questionnaire and 40 people of London has been taken as respondent those who can fill this
questionnaire (Lerner and et.al, 2015).
Secondary sources is another method of collecting the information. These are such
information which are already available and researcher can use it as per the necessity
of subject matter. There have been many researches conducted on the same topic so
investigator can take support of these information in order to find out the current
situation (Bernroider and Mitlohner, 2015). These sources are such as books,
journals, internet articles etc. With the help of this source company will be able to
analyses the overview and accordingly it will be able to make sound decision.
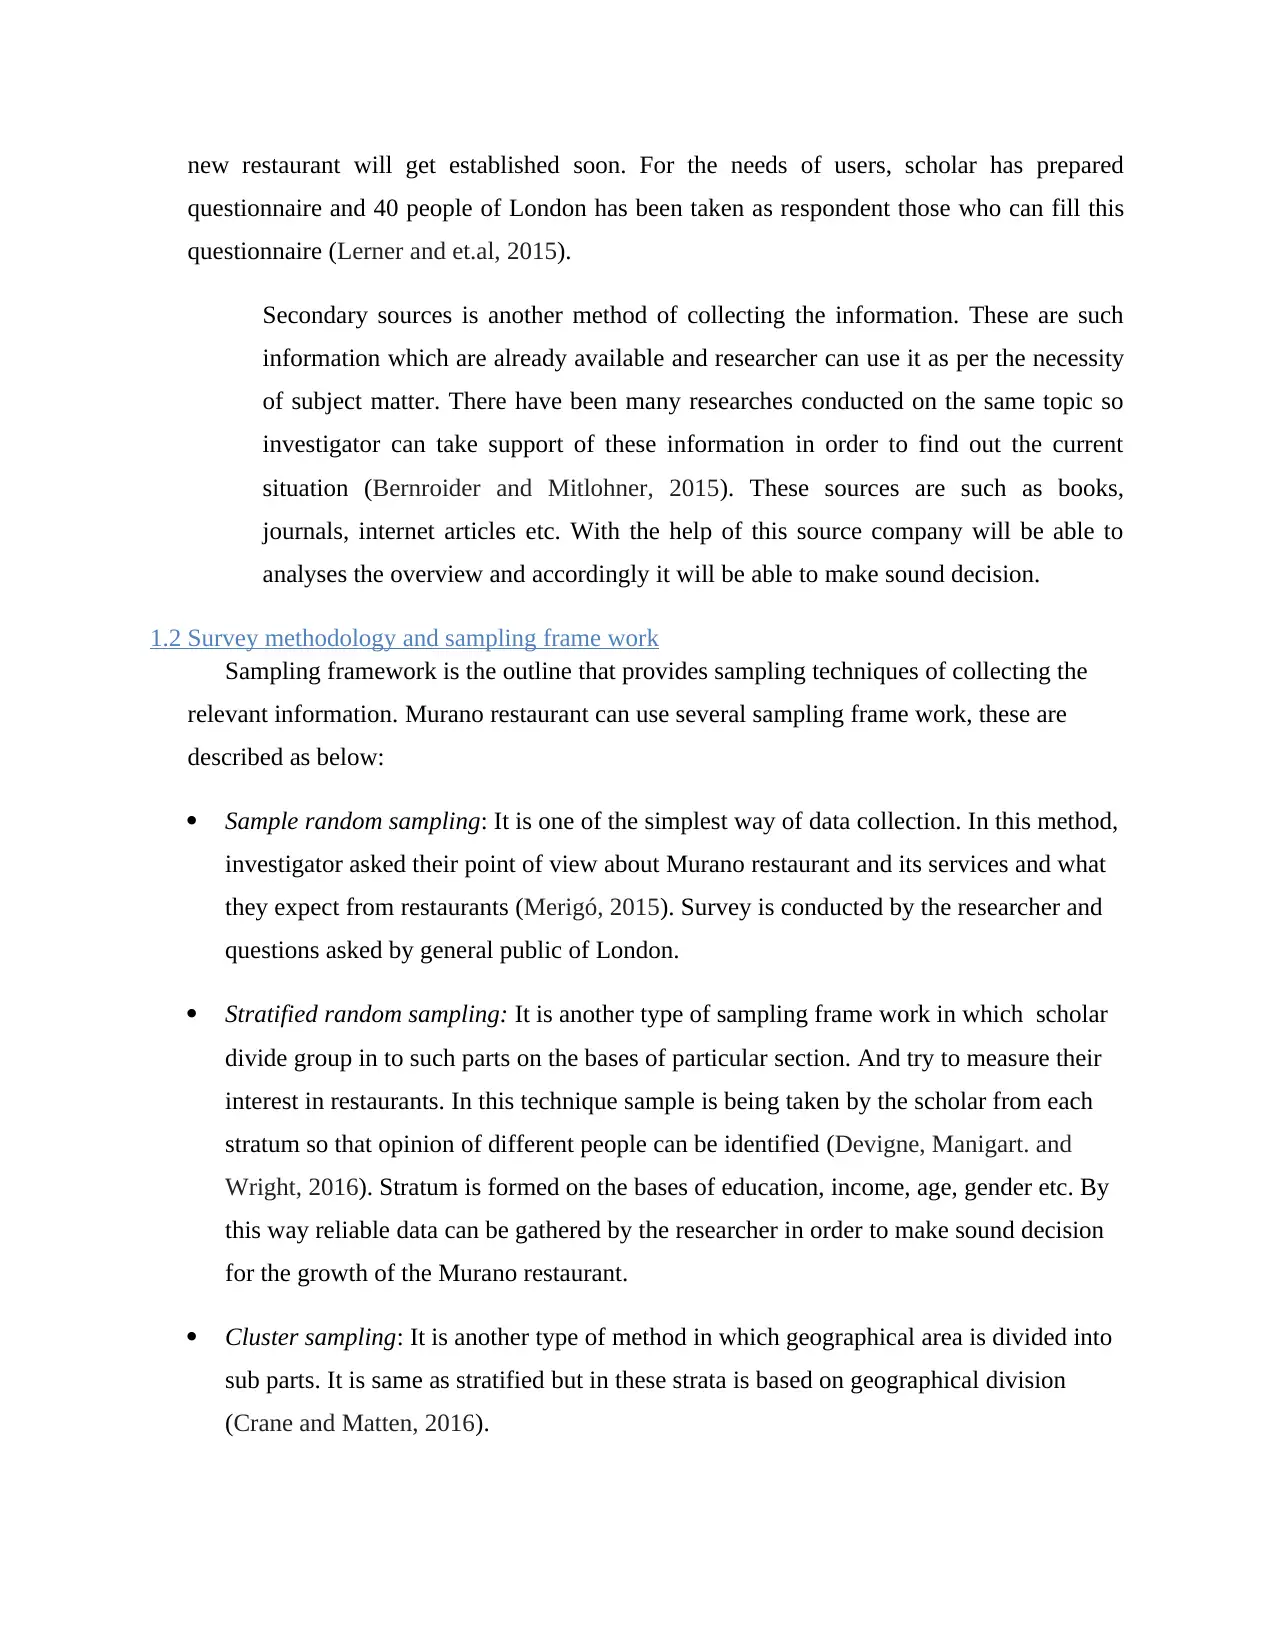
1.2 Survey methodology and sampling frame work
Sampling framework is the outline that provides sampling techniques of collecting the
relevant information. Murano restaurant can use several sampling frame work, these are
described as below:
Sample random sampling: It is one of the simplest way of data collection. In this method,
investigator asked their point of view about Murano restaurant and its services and what
they expect from restaurants (Merigó, 2015). Survey is conducted by the researcher and
questions asked by general public of London.
Stratified random sampling: It is another type of sampling frame work in which scholar
divide group in to such parts on the bases of particular section. And try to measure their
interest in restaurants. In this technique sample is being taken by the scholar from each
stratum so that opinion of different people can be identified (Devigne, Manigart. and
Wright, 2016). Stratum is formed on the bases of education, income, age, gender etc. By
this way reliable data can be gathered by the researcher in order to make sound decision
for the growth of the Murano restaurant.
Cluster sampling: It is another type of method in which geographical area is divided into
sub parts. It is same as stratified but in these strata is based on geographical division
(Crane and Matten, 2016).
questionnaire and 40 people of London has been taken as respondent those who can fill this
questionnaire (Lerner and et.al, 2015).
Secondary sources is another method of collecting the information. These are such
information which are already available and researcher can use it as per the necessity
of subject matter. There have been many researches conducted on the same topic so
investigator can take support of these information in order to find out the current
situation (Bernroider and Mitlohner, 2015). These sources are such as books,
journals, internet articles etc. With the help of this source company will be able to
analyses the overview and accordingly it will be able to make sound decision.
1.2 Survey methodology and sampling frame work
Sampling framework is the outline that provides sampling techniques of collecting the
relevant information. Murano restaurant can use several sampling frame work, these are
described as below:
Sample random sampling: It is one of the simplest way of data collection. In this method,
investigator asked their point of view about Murano restaurant and its services and what
they expect from restaurants (Merigó, 2015). Survey is conducted by the researcher and
questions asked by general public of London.
Stratified random sampling: It is another type of sampling frame work in which scholar
divide group in to such parts on the bases of particular section. And try to measure their
interest in restaurants. In this technique sample is being taken by the scholar from each
stratum so that opinion of different people can be identified (Devigne, Manigart. and
Wright, 2016). Stratum is formed on the bases of education, income, age, gender etc. By
this way reliable data can be gathered by the researcher in order to make sound decision
for the growth of the Murano restaurant.
Cluster sampling: It is another type of method in which geographical area is divided into
sub parts. It is same as stratified but in these strata is based on geographical division
(Crane and Matten, 2016).
Paraphrase This Document
Need a fresh take? Get an instant paraphrase of this document with our AI Paraphraser
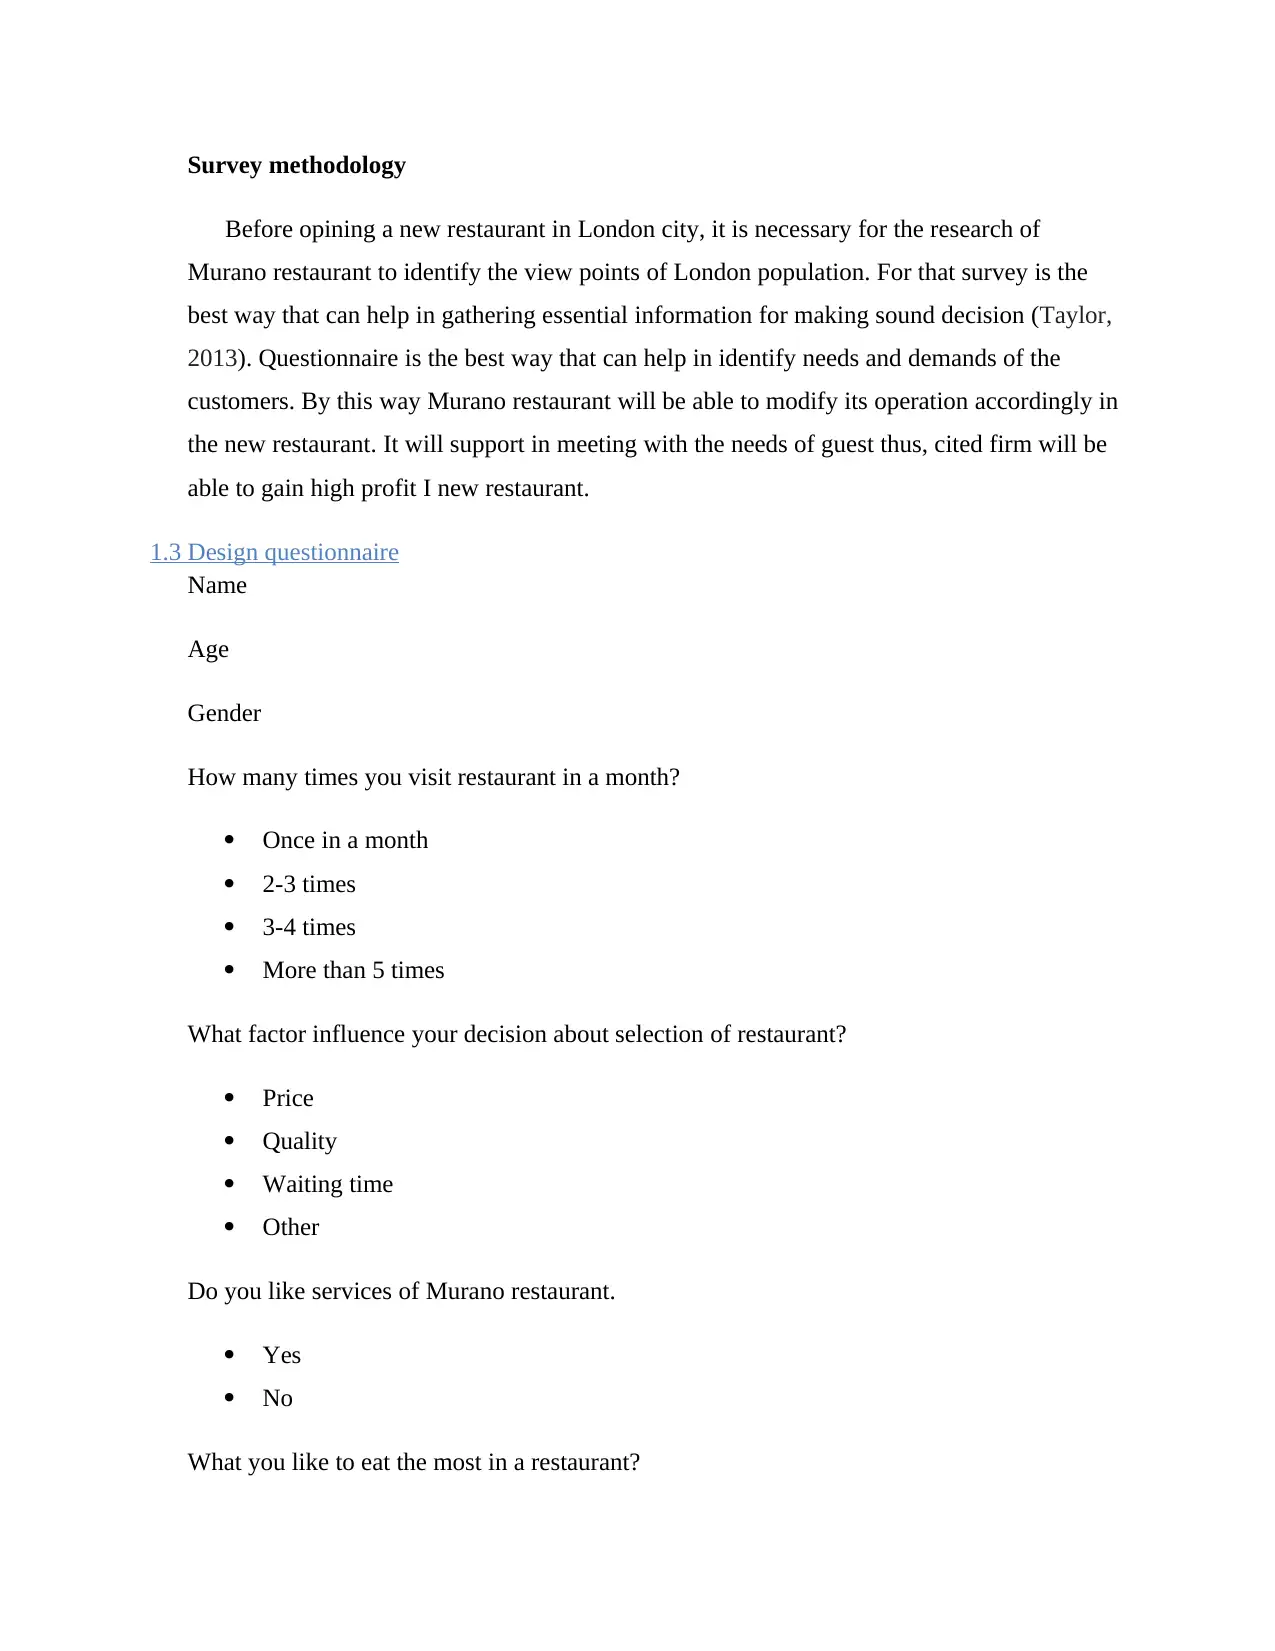
Survey methodology
Before opining a new restaurant in London city, it is necessary for the research of
Murano restaurant to identify the view points of London population. For that survey is the
best way that can help in gathering essential information for making sound decision (Taylor,
2013). Questionnaire is the best way that can help in identify needs and demands of the
customers. By this way Murano restaurant will be able to modify its operation accordingly in
the new restaurant. It will support in meeting with the needs of guest thus, cited firm will be
able to gain high profit I new restaurant.
1.3 Design questionnaire
Name
Age
Gender
How many times you visit restaurant in a month?
Once in a month
2-3 times
3-4 times
More than 5 times
What factor influence your decision about selection of restaurant?
Price
Quality
Waiting time
Other
Do you like services of Murano restaurant.
Yes
No
What you like to eat the most in a restaurant?
Indian
Mexican
Chinese
Does services of Murano restaurant is quick and satisfactory?
Strong agree
Agree
Disagree
Strongly disagree
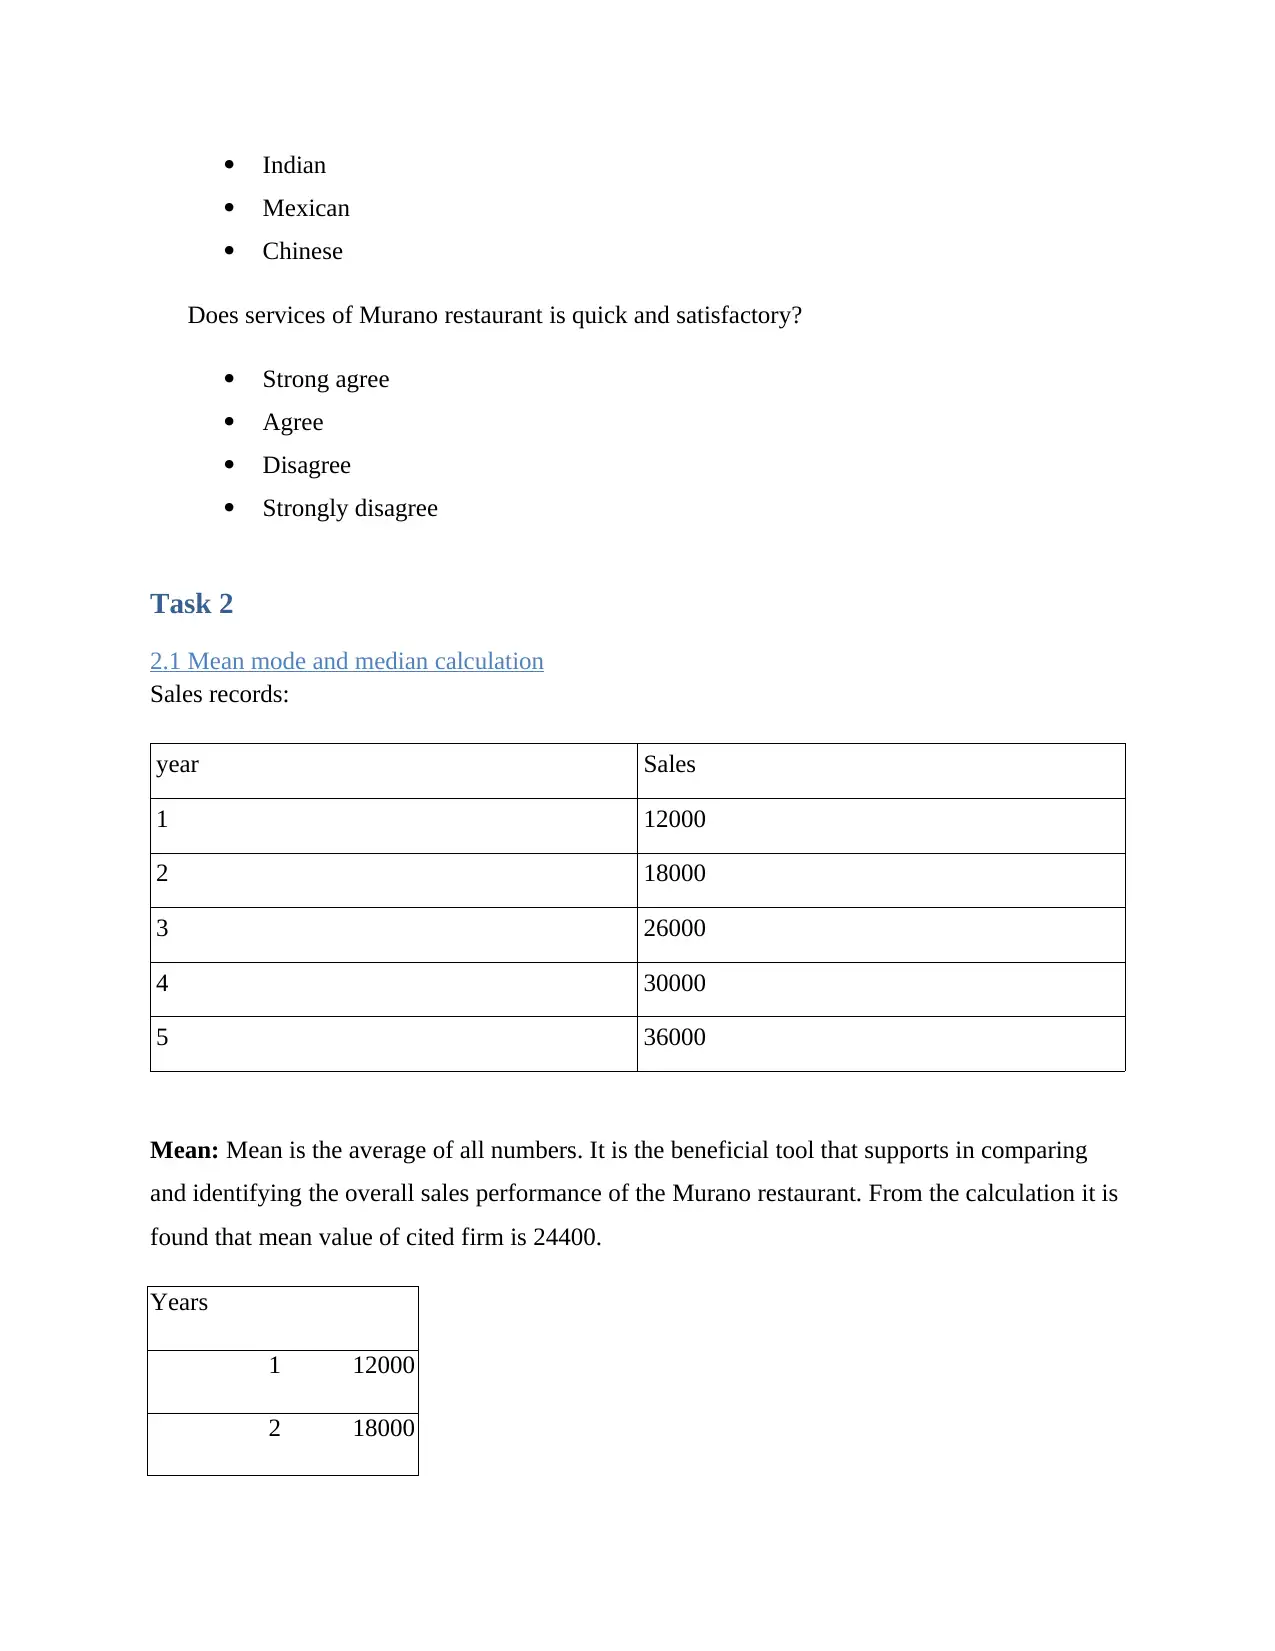
Task 2
2.1 Mean mode and median calculation
Sales records:
year Sales
1 12000
2 18000
3 26000
4 30000
5 36000
Mean: Mean is the average of all numbers. It is the beneficial tool that supports in comparing
and identifying the overall sales performance of the Murano restaurant. From the calculation it is
found that mean value of cited firm is 24400.
Years
1 12000
2 18000
Mexican
Chinese
Does services of Murano restaurant is quick and satisfactory?
Strong agree
Agree
Disagree
Strongly disagree
Task 2
2.1 Mean mode and median calculation
Sales records:
year Sales
1 12000
2 18000
3 26000
4 30000
5 36000
Mean: Mean is the average of all numbers. It is the beneficial tool that supports in comparing
and identifying the overall sales performance of the Murano restaurant. From the calculation it is
found that mean value of cited firm is 24400.
Years
1 12000
2 18000
⊘ This is a preview!⊘
Do you want full access?
Subscribe today to unlock all pages.
Trusted by 1+ million students worldwide
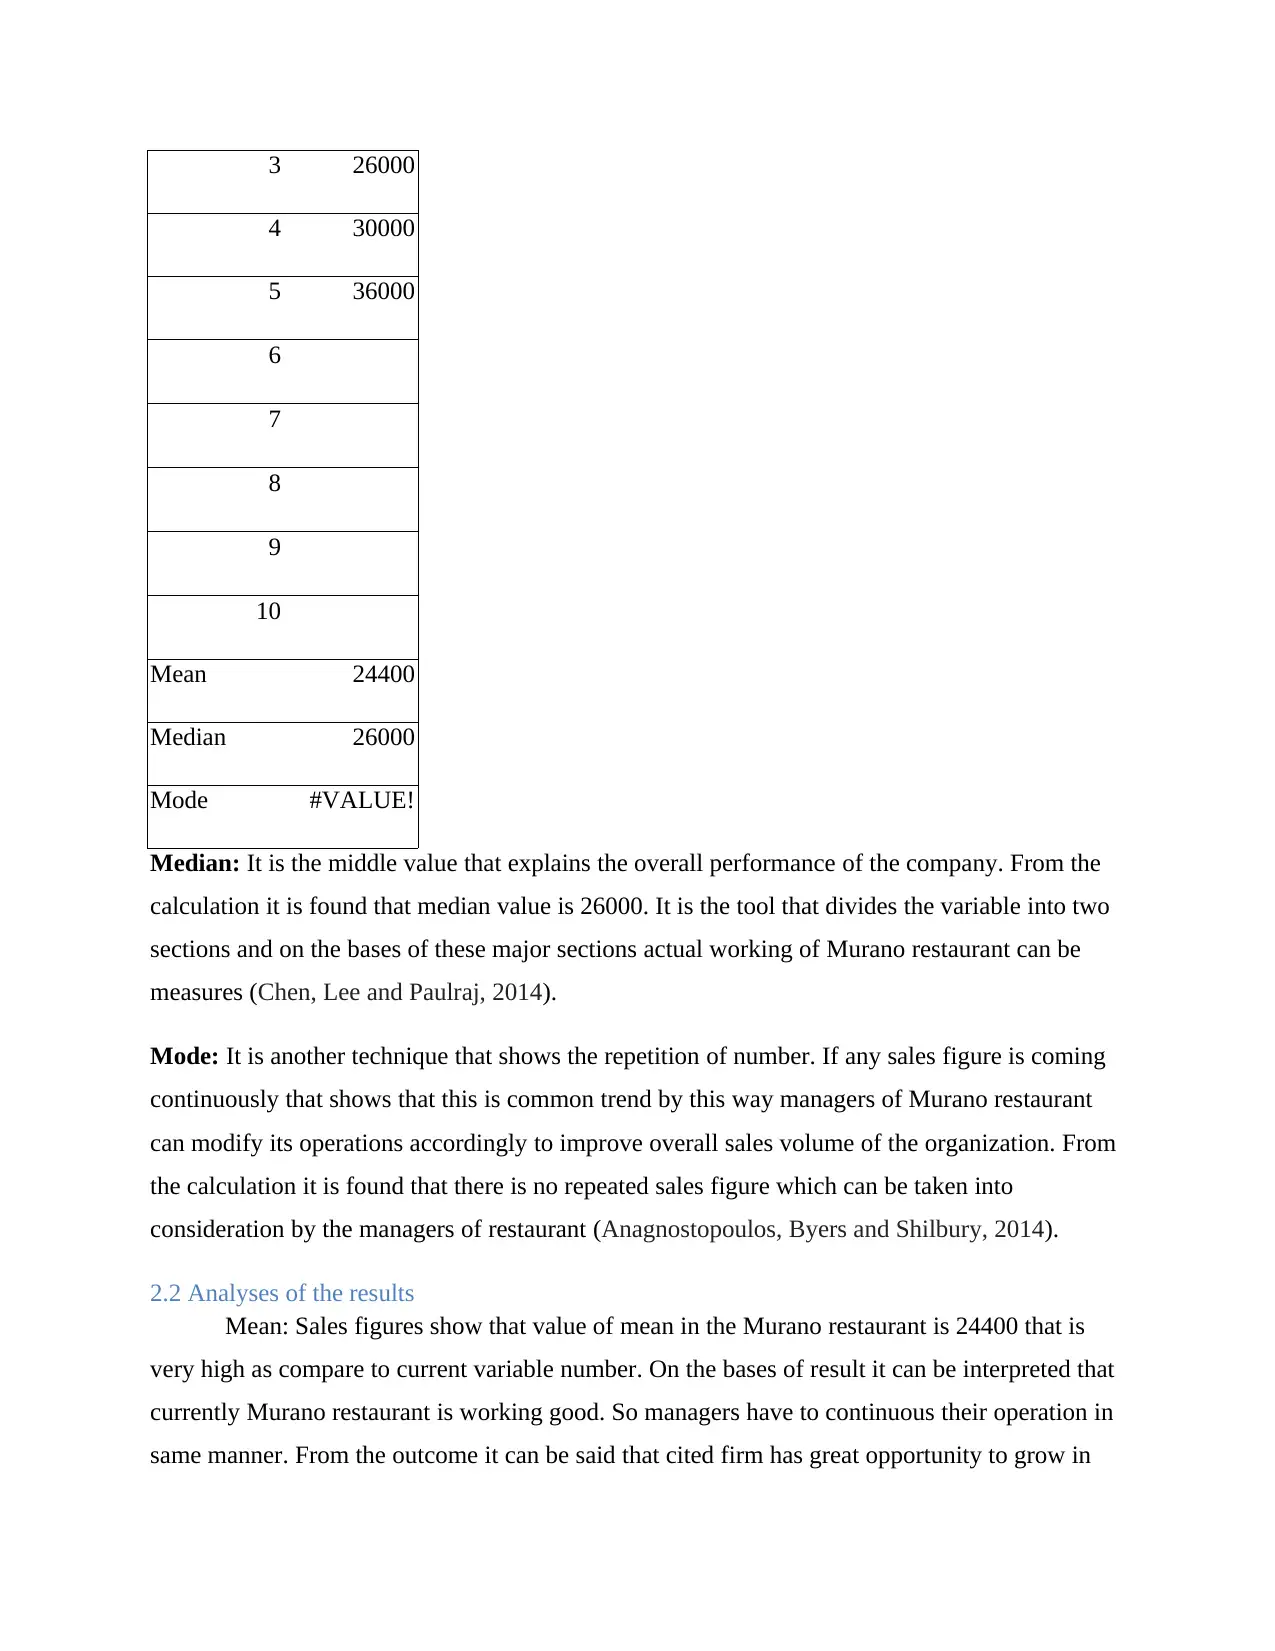
3 26000
4 30000
5 36000
6
7
8
9
10
Mean 24400
Median 26000
Mode #VALUE!
Median: It is the middle value that explains the overall performance of the company. From the
calculation it is found that median value is 26000. It is the tool that divides the variable into two
sections and on the bases of these major sections actual working of Murano restaurant can be
measures (Chen, Lee and Paulraj, 2014).
Mode: It is another technique that shows the repetition of number. If any sales figure is coming
continuously that shows that this is common trend by this way managers of Murano restaurant
can modify its operations accordingly to improve overall sales volume of the organization. From
the calculation it is found that there is no repeated sales figure which can be taken into
consideration by the managers of restaurant (Anagnostopoulos, Byers and Shilbury, 2014).
2.2 Analyses of the results
Mean: Sales figures show that value of mean in the Murano restaurant is 24400 that is
very high as compare to current variable number. On the bases of result it can be interpreted that
currently Murano restaurant is working good. So managers have to continuous their operation in
same manner. From the outcome it can be said that cited firm has great opportunity to grow in
Paraphrase This Document
Need a fresh take? Get an instant paraphrase of this document with our AI Paraphraser
the London market it is serve quality services and food to the guests (Deligianni and et.al, 2015).
It is necessary for the cited firm that to utilize the resources well that would help in reducing
operational cost of the restaurant.
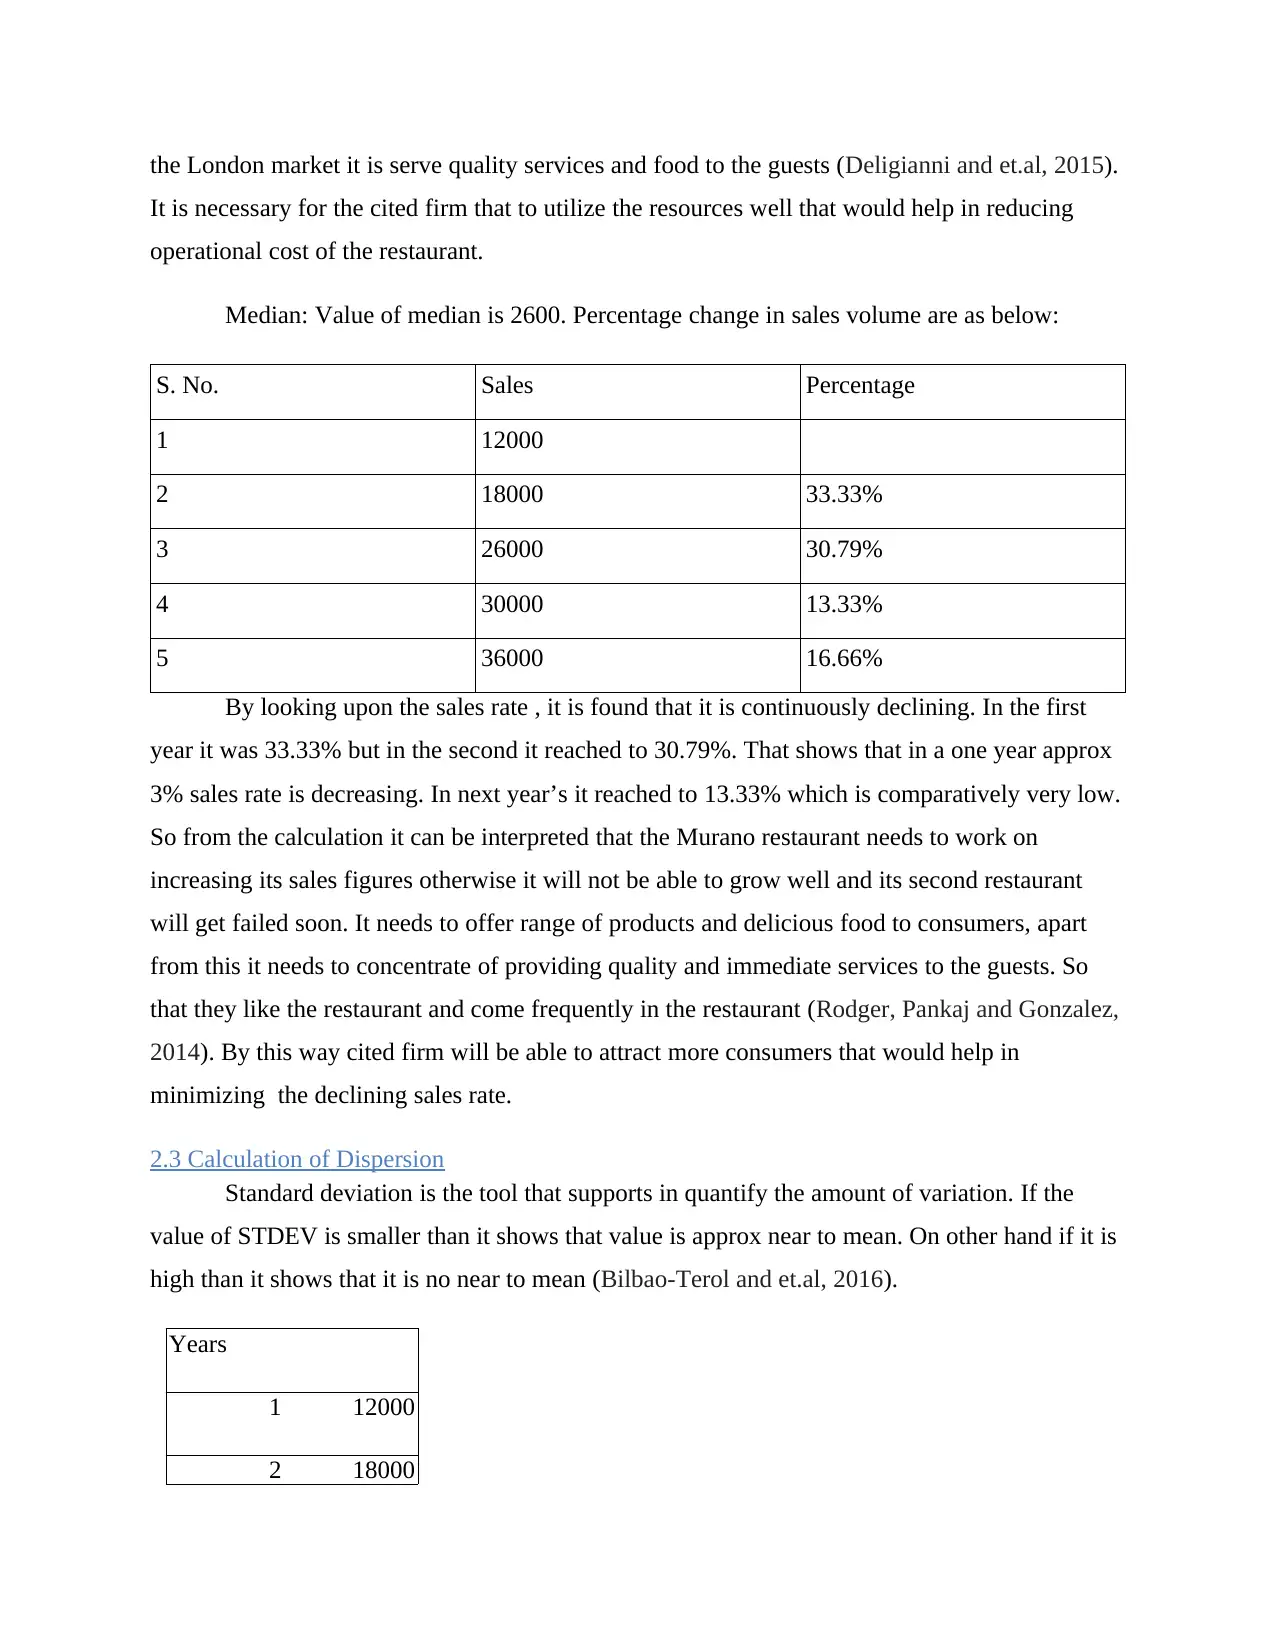
Median: Value of median is 2600. Percentage change in sales volume are as below:
S. No. Sales Percentage
1 12000
2 18000 33.33%
3 26000 30.79%
4 30000 13.33%
5 36000 16.66%
By looking upon the sales rate , it is found that it is continuously declining. In the first
year it was 33.33% but in the second it reached to 30.79%. That shows that in a one year approx
3% sales rate is decreasing. In next year’s it reached to 13.33% which is comparatively very low.
So from the calculation it can be interpreted that the Murano restaurant needs to work on
increasing its sales figures otherwise it will not be able to grow well and its second restaurant
will get failed soon. It needs to offer range of products and delicious food to consumers, apart
from this it needs to concentrate of providing quality and immediate services to the guests. So
that they like the restaurant and come frequently in the restaurant (Rodger, Pankaj and Gonzalez,
2014). By this way cited firm will be able to attract more consumers that would help in
minimizing the declining sales rate.
2.3 Calculation of Dispersion
Standard deviation is the tool that supports in quantify the amount of variation. If the
value of STDEV is smaller than it shows that value is approx near to mean. On other hand if it is
high than it shows that it is no near to mean (Bilbao-Terol and et.al, 2016).
Years
1 12000
2 18000
It is necessary for the cited firm that to utilize the resources well that would help in reducing
operational cost of the restaurant.
Median: Value of median is 2600. Percentage change in sales volume are as below:
S. No. Sales Percentage
1 12000
2 18000 33.33%
3 26000 30.79%
4 30000 13.33%
5 36000 16.66%
By looking upon the sales rate , it is found that it is continuously declining. In the first
year it was 33.33% but in the second it reached to 30.79%. That shows that in a one year approx
3% sales rate is decreasing. In next year’s it reached to 13.33% which is comparatively very low.
So from the calculation it can be interpreted that the Murano restaurant needs to work on
increasing its sales figures otherwise it will not be able to grow well and its second restaurant
will get failed soon. It needs to offer range of products and delicious food to consumers, apart
from this it needs to concentrate of providing quality and immediate services to the guests. So
that they like the restaurant and come frequently in the restaurant (Rodger, Pankaj and Gonzalez,
2014). By this way cited firm will be able to attract more consumers that would help in
minimizing the declining sales rate.
2.3 Calculation of Dispersion
Standard deviation is the tool that supports in quantify the amount of variation. If the
value of STDEV is smaller than it shows that value is approx near to mean. On other hand if it is
high than it shows that it is no near to mean (Bilbao-Terol and et.al, 2016).
Years
1 12000
2 18000
3 26000
4 30000
5 36000
6
7
8
9
10
STDEV
9528.90339
96573
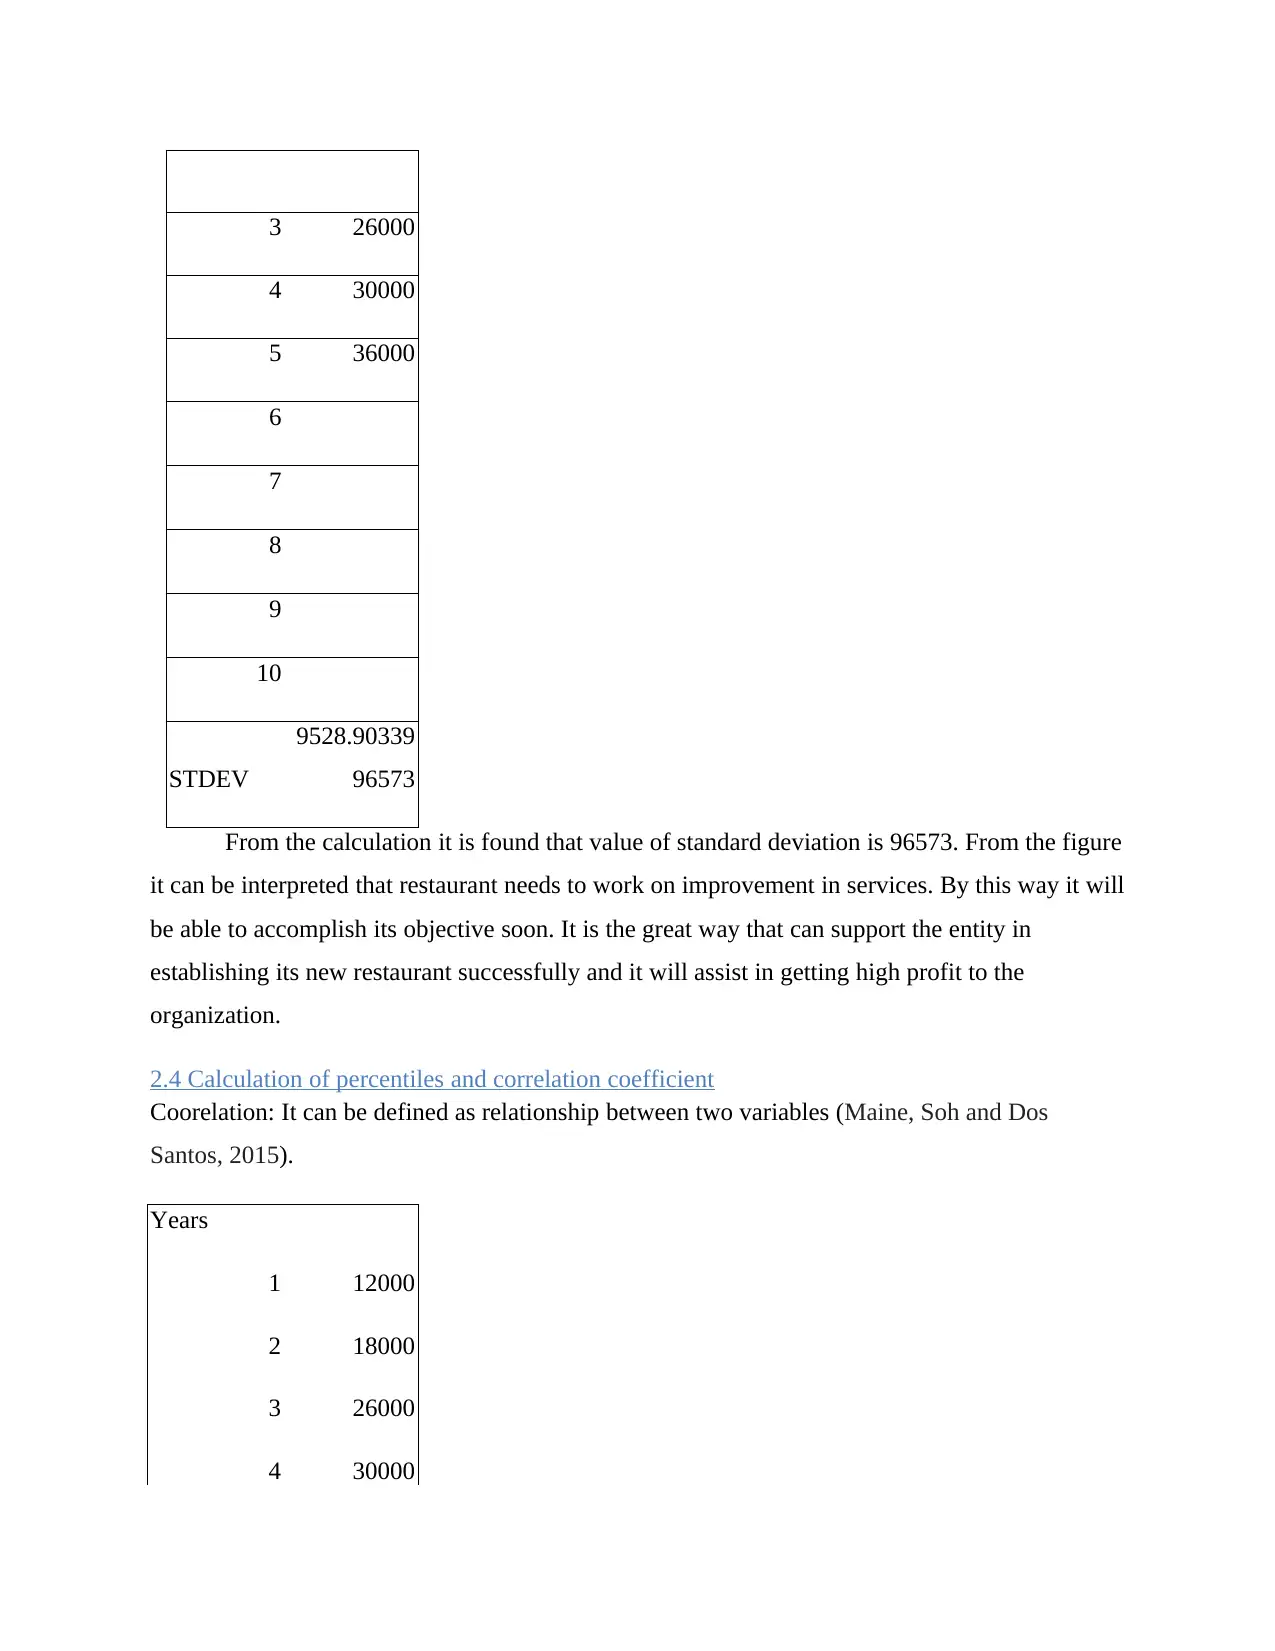
From the calculation it is found that value of standard deviation is 96573. From the figure
it can be interpreted that restaurant needs to work on improvement in services. By this way it will
be able to accomplish its objective soon. It is the great way that can support the entity in
establishing its new restaurant successfully and it will assist in getting high profit to the
organization.
2.4 Calculation of percentiles and correlation coefficient
Coorelation: It can be defined as relationship between two variables (Maine, Soh and Dos
Santos, 2015).
Years
1 12000
2 18000
3 26000
4 30000
4 30000
5 36000
6
7
8
9
10
STDEV
9528.90339
96573
From the calculation it is found that value of standard deviation is 96573. From the figure
it can be interpreted that restaurant needs to work on improvement in services. By this way it will
be able to accomplish its objective soon. It is the great way that can support the entity in
establishing its new restaurant successfully and it will assist in getting high profit to the
organization.
2.4 Calculation of percentiles and correlation coefficient
Coorelation: It can be defined as relationship between two variables (Maine, Soh and Dos
Santos, 2015).
Years
1 12000
2 18000
3 26000
4 30000
⊘ This is a preview!⊘
Do you want full access?
Subscribe today to unlock all pages.
Trusted by 1+ million students worldwide
5 36000
6
7
8
9
10
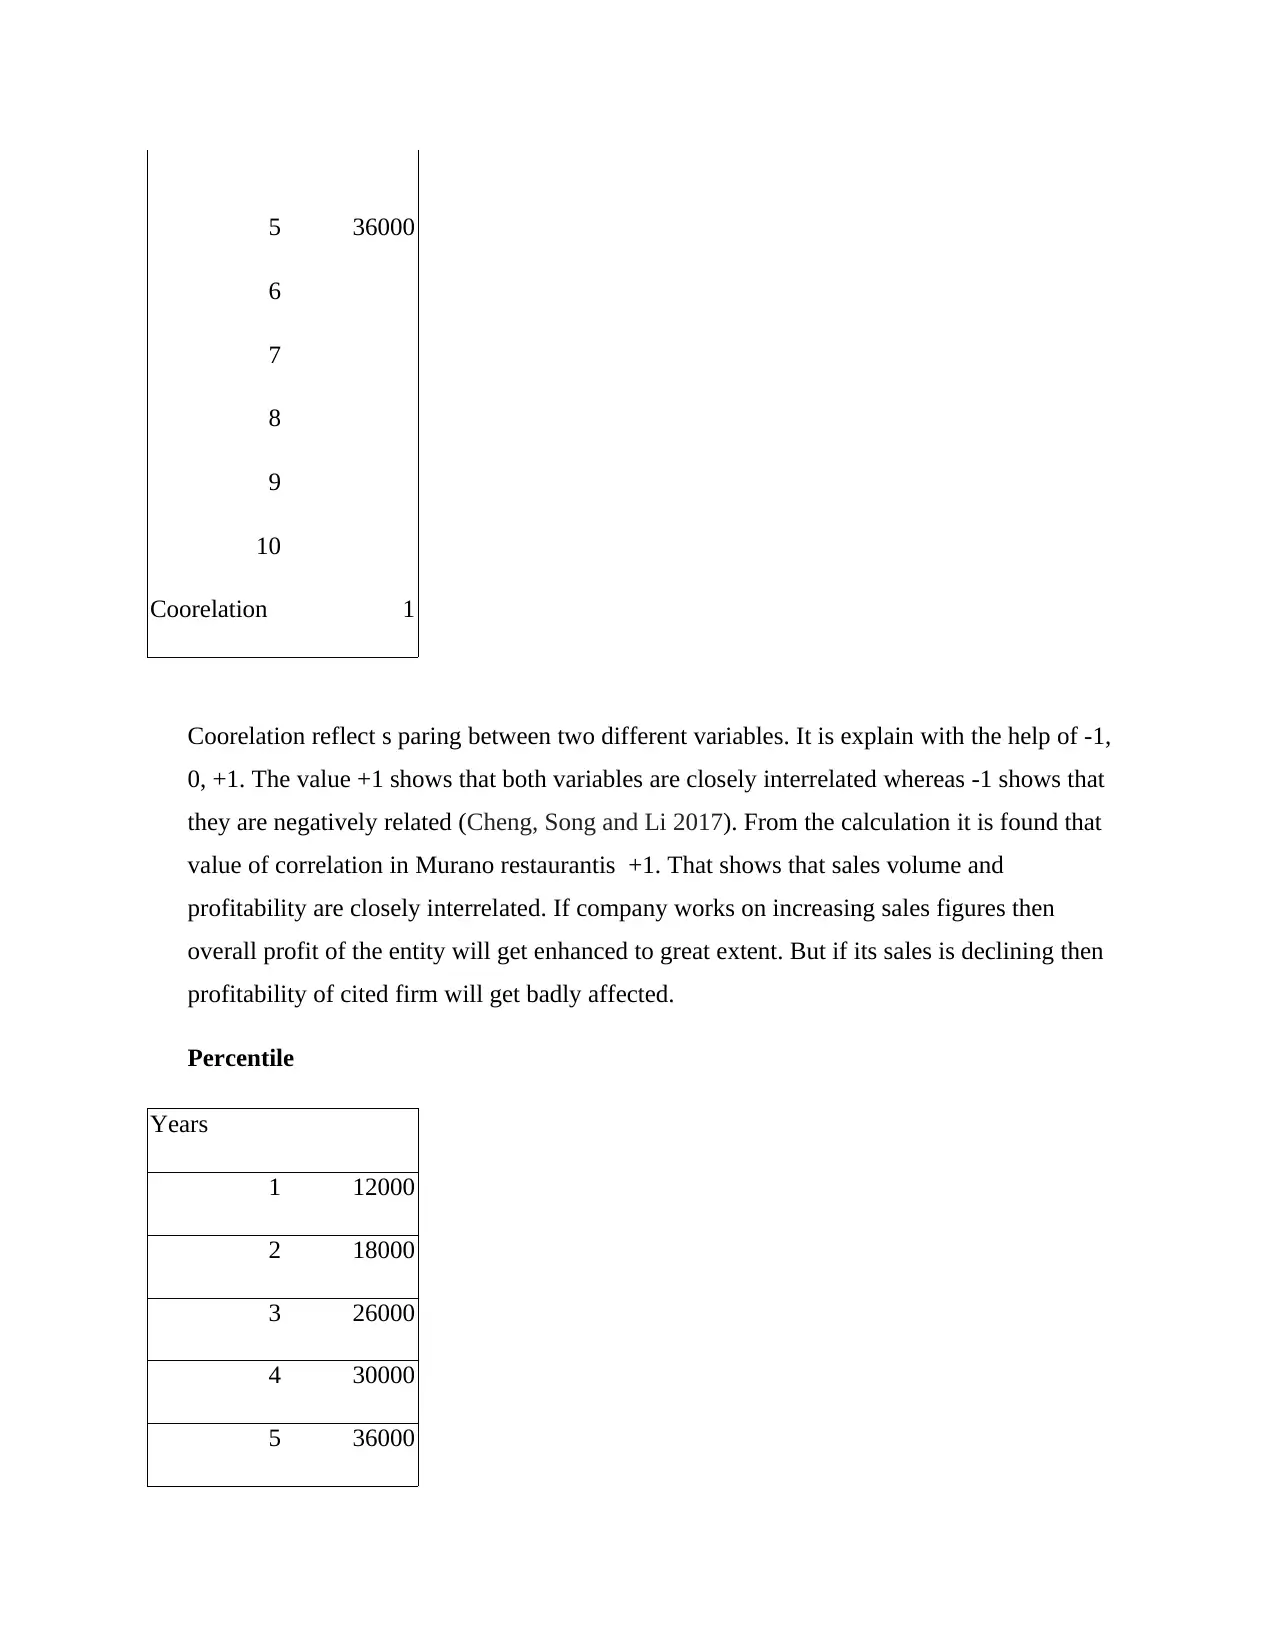
Coorelation 1
Coorelation reflect s paring between two different variables. It is explain with the help of -1,
0, +1. The value +1 shows that both variables are closely interrelated whereas -1 shows that
they are negatively related (Cheng, Song and Li 2017). From the calculation it is found that
value of correlation in Murano restaurantis +1. That shows that sales volume and
profitability are closely interrelated. If company works on increasing sales figures then
overall profit of the entity will get enhanced to great extent. But if its sales is declining then
profitability of cited firm will get badly affected.
Percentile
Years
1 12000
2 18000
3 26000
4 30000
5 36000
6
7
8
9
10
Coorelation 1
Coorelation reflect s paring between two different variables. It is explain with the help of -1,
0, +1. The value +1 shows that both variables are closely interrelated whereas -1 shows that
they are negatively related (Cheng, Song and Li 2017). From the calculation it is found that
value of correlation in Murano restaurantis +1. That shows that sales volume and
profitability are closely interrelated. If company works on increasing sales figures then
overall profit of the entity will get enhanced to great extent. But if its sales is declining then
profitability of cited firm will get badly affected.
Percentile
Years
1 12000
2 18000
3 26000
4 30000
5 36000
Paraphrase This Document
Need a fresh take? Get an instant paraphrase of this document with our AI Paraphraser
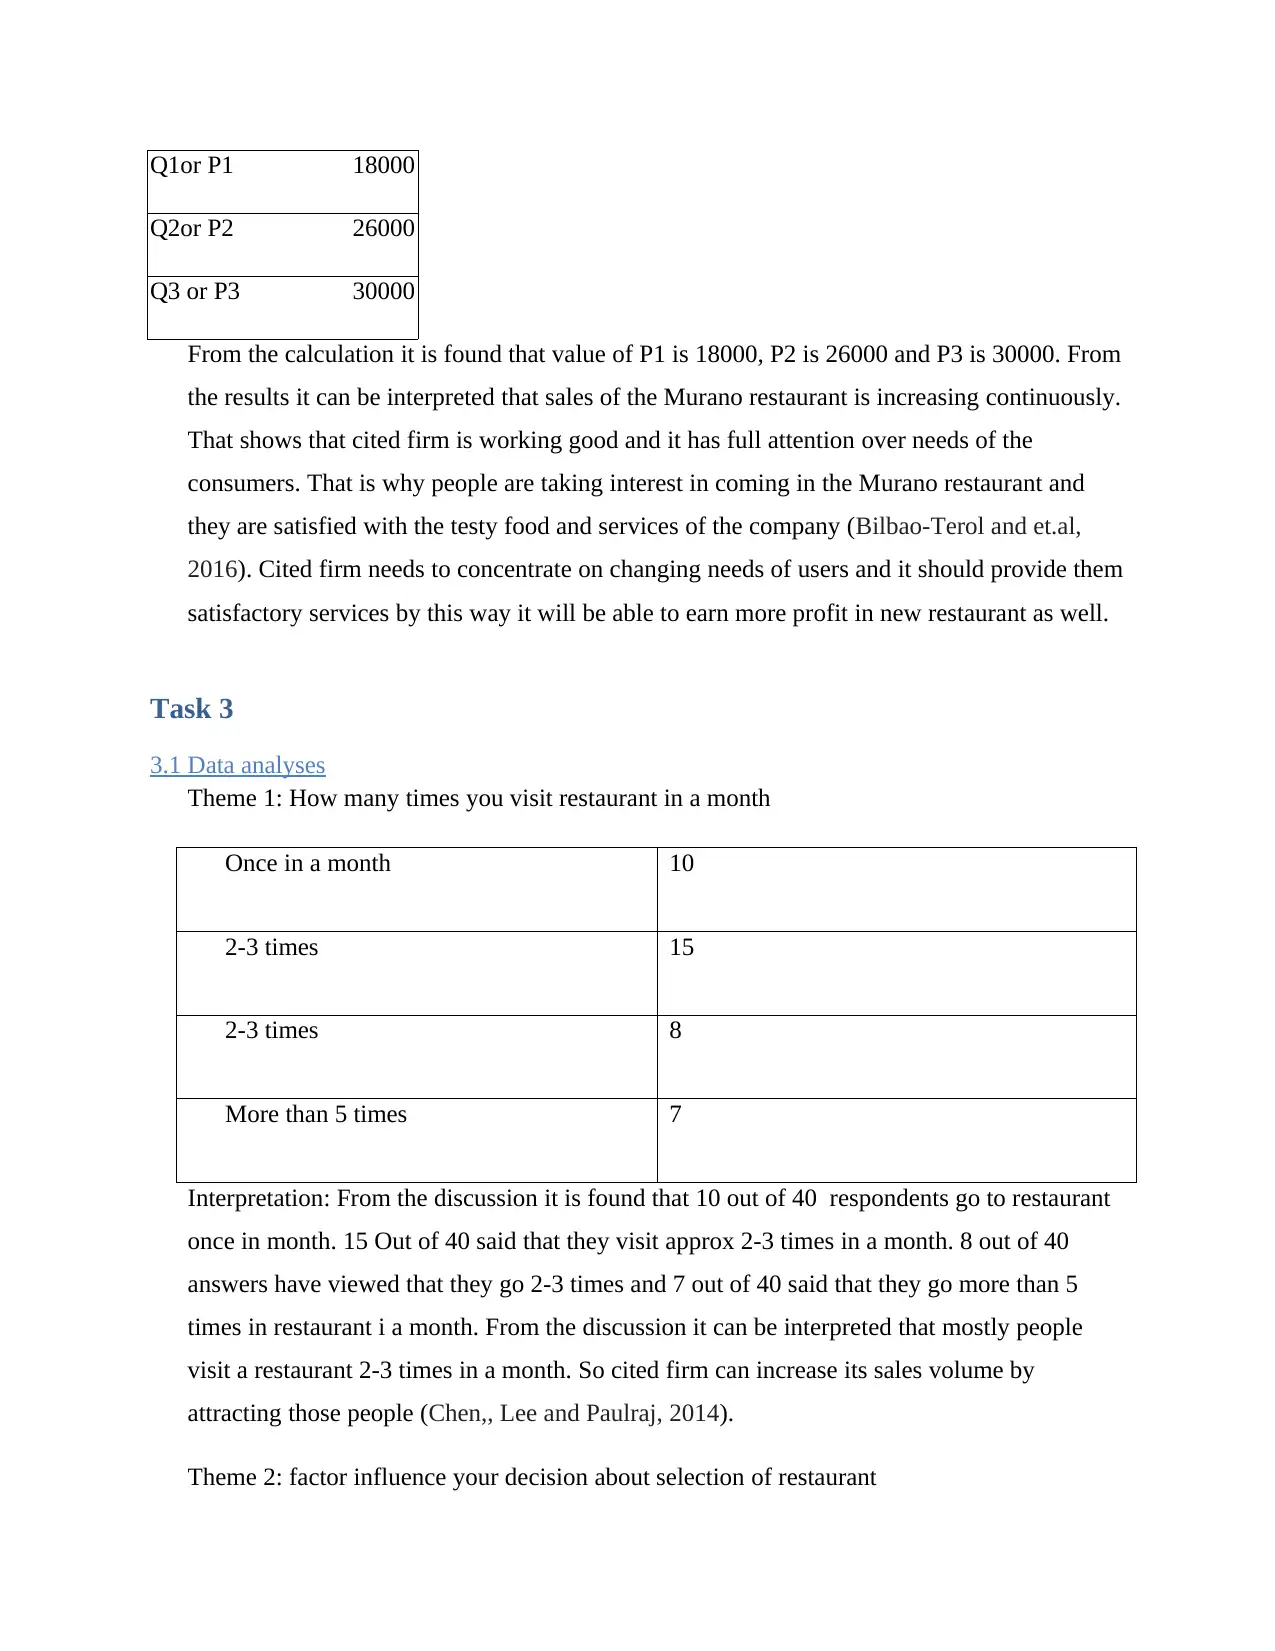
Q1or P1 18000
Q2or P2 26000
Q3 or P3 30000
From the calculation it is found that value of P1 is 18000, P2 is 26000 and P3 is 30000. From
the results it can be interpreted that sales of the Murano restaurant is increasing continuously.
That shows that cited firm is working good and it has full attention over needs of the
consumers. That is why people are taking interest in coming in the Murano restaurant and
they are satisfied with the testy food and services of the company (Bilbao-Terol and et.al,
2016). Cited firm needs to concentrate on changing needs of users and it should provide them
satisfactory services by this way it will be able to earn more profit in new restaurant as well.
Task 3
3.1 Data analyses
Theme 1: How many times you visit restaurant in a month
Once in a month 10
2-3 times 15
2-3 times 8
More than 5 times 7
Interpretation: From the discussion it is found that 10 out of 40 respondents go to restaurant
once in month. 15 Out of 40 said that they visit approx 2-3 times in a month. 8 out of 40
answers have viewed that they go 2-3 times and 7 out of 40 said that they go more than 5
times in restaurant i a month. From the discussion it can be interpreted that mostly people
visit a restaurant 2-3 times in a month. So cited firm can increase its sales volume by
attracting those people (Chen,, Lee and Paulraj, 2014).
Theme 2: factor influence your decision about selection of restaurant
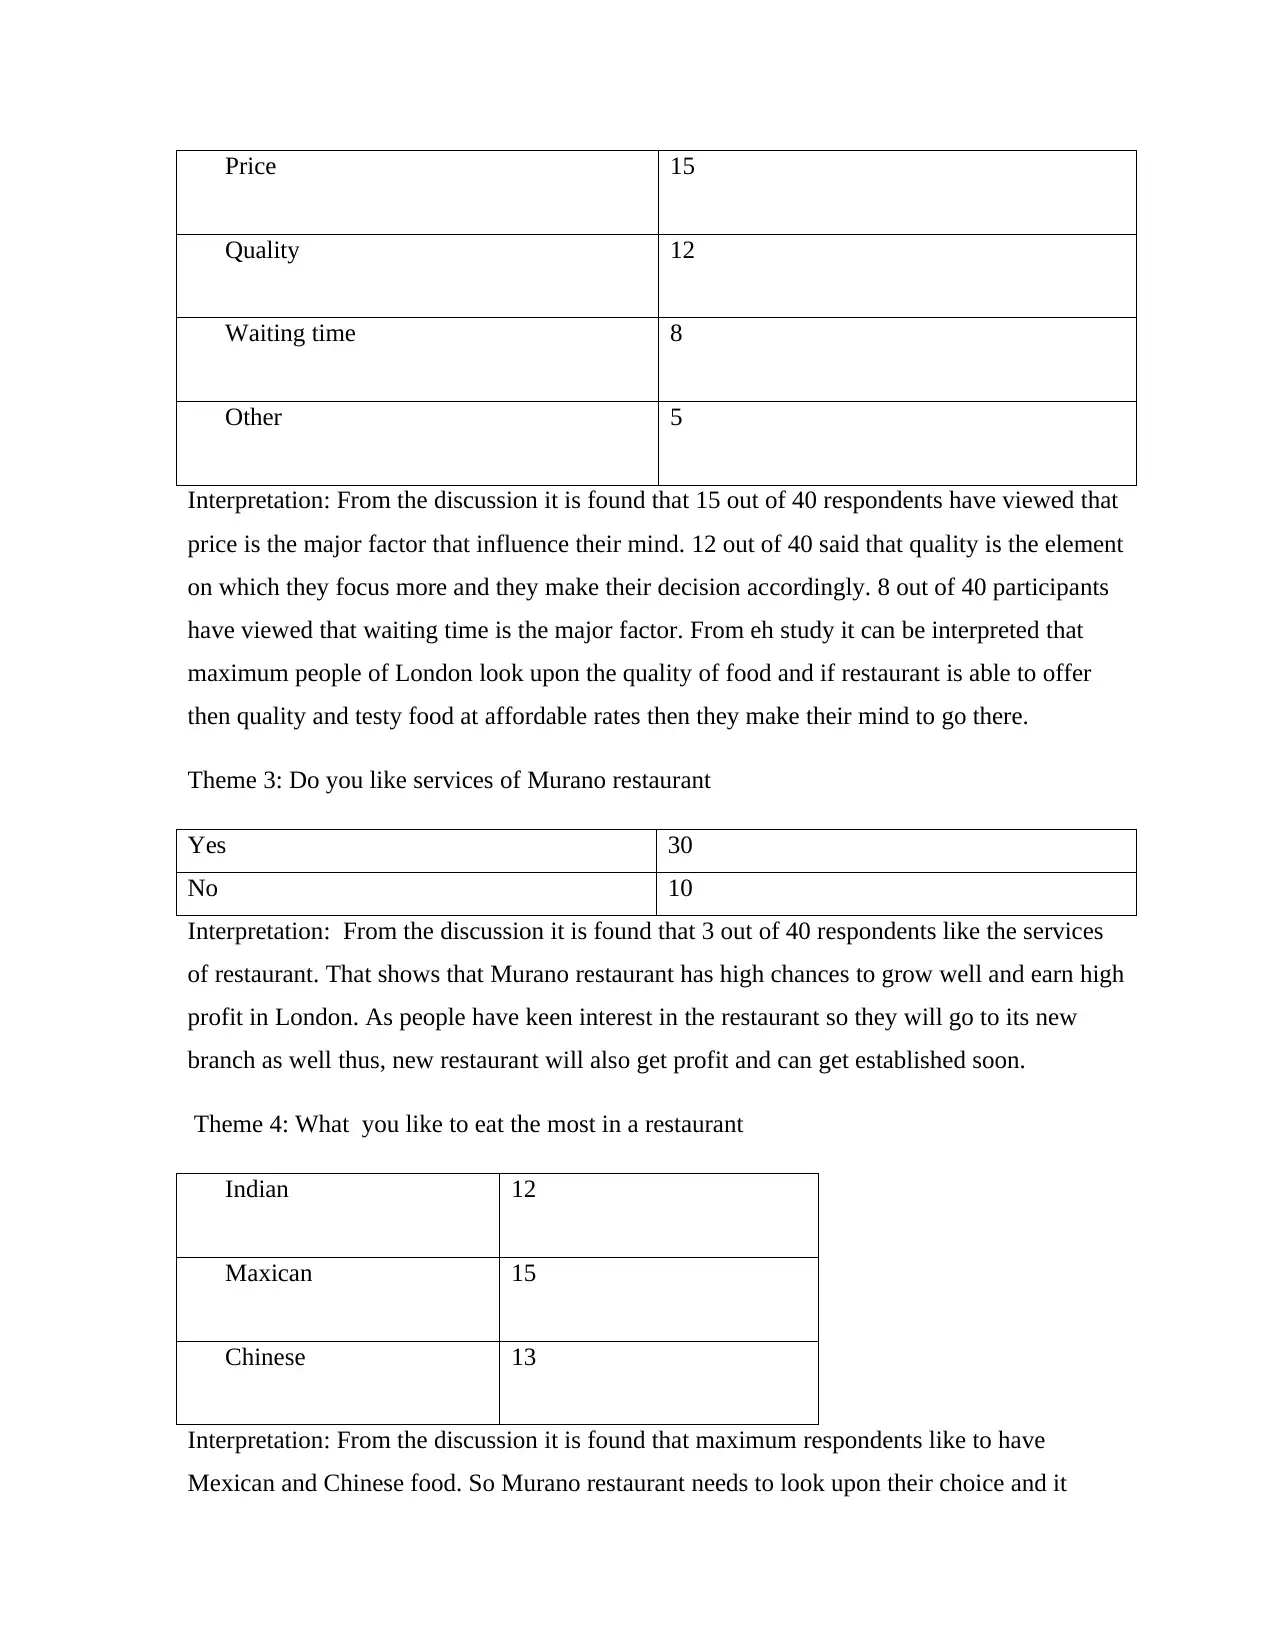
Price 15
Quality 12
Waiting time 8
Other 5
Interpretation: From the discussion it is found that 15 out of 40 respondents have viewed that
price is the major factor that influence their mind. 12 out of 40 said that quality is the element
on which they focus more and they make their decision accordingly. 8 out of 40 participants
have viewed that waiting time is the major factor. From eh study it can be interpreted that
maximum people of London look upon the quality of food and if restaurant is able to offer
then quality and testy food at affordable rates then they make their mind to go there.
Theme 3: Do you like services of Murano restaurant
Yes 30
No 10
Interpretation: From the discussion it is found that 3 out of 40 respondents like the services
of restaurant. That shows that Murano restaurant has high chances to grow well and earn high
profit in London. As people have keen interest in the restaurant so they will go to its new
branch as well thus, new restaurant will also get profit and can get established soon.
Theme 4: What you like to eat the most in a restaurant
Indian 12
Maxican 15
Chinese 13
Interpretation: From the discussion it is found that maximum respondents like to have
Mexican and Chinese food. So Murano restaurant needs to look upon their choice and it
⊘ This is a preview!⊘
Do you want full access?
Subscribe today to unlock all pages.
Trusted by 1+ million students worldwide
1 out of 19
Related Documents


Your All-in-One AI-Powered Toolkit for Academic Success.
+13062052269
info@desklib.com
Available 24*7 on WhatsApp / Email
![[object Object]](/_next/static/media/star-bottom.7253800d.svg)
Unlock your academic potential
Copyright © 2020–2026 A2Z Services. All Rights Reserved. Developed and managed by ZUCOL.