ACC302 Corporate Finance Report: Financial Performance Analysis
VerifiedAdded on 2023/01/05
|11
|2034
|68
Report
AI Summary
This report analyzes the financial performance of Murray River Organics Group Limited (MRG) for ACC302 Corporate Finance, providing financial advice to a potential investor. The report examines key financial ratios, including Return on Assets (ROA), Return on Equity (ROE), and Debt Ratio, over a period of several years, highlighting trends and performance. The analysis includes calculations of the Weighted Average Cost of Capital (WACC) and an assessment of the company's capital structure, focusing on the debt-to-equity ratio. The report concludes with a letter of recommendation advising against investment in MRG due to its negative financial performance, high debt levels, and concerns about profitability. The analysis uses financial statements and market data to support its conclusions, offering insights into the company's financial health and strategic decisions.
Running head: CORPORATE FINANCE
Corporate Finance
Name of the Student:
Name of the University:
Author’s Note:
Corporate Finance
Name of the Student:
Name of the University:
Author’s Note:
Paraphrase This Document
Need a fresh take? Get an instant paraphrase of this document with our AI Paraphraser
1
CORPORATE FINANCE
Table of Contents
Answer to Question 1......................................................................................................................2
Requirement i...............................................................................................................................2
Requirement ii.............................................................................................................................3
Requirement iii............................................................................................................................4
Answer to Question 2......................................................................................................................4
Requirement i...............................................................................................................................5
Requirement ii.............................................................................................................................5
Answer to Question 3......................................................................................................................5
Requirement i...............................................................................................................................6
Requirement ii.............................................................................................................................6
Answer to Question 4......................................................................................................................7
Requirement i...............................................................................................................................7
Requirement ii.............................................................................................................................8
Answer to Question 5......................................................................................................................8
Letter of Recommendation..........................................................................................................9
Reference.......................................................................................................................................10
2
CORPORATE FINANCE
Answer to Question 1
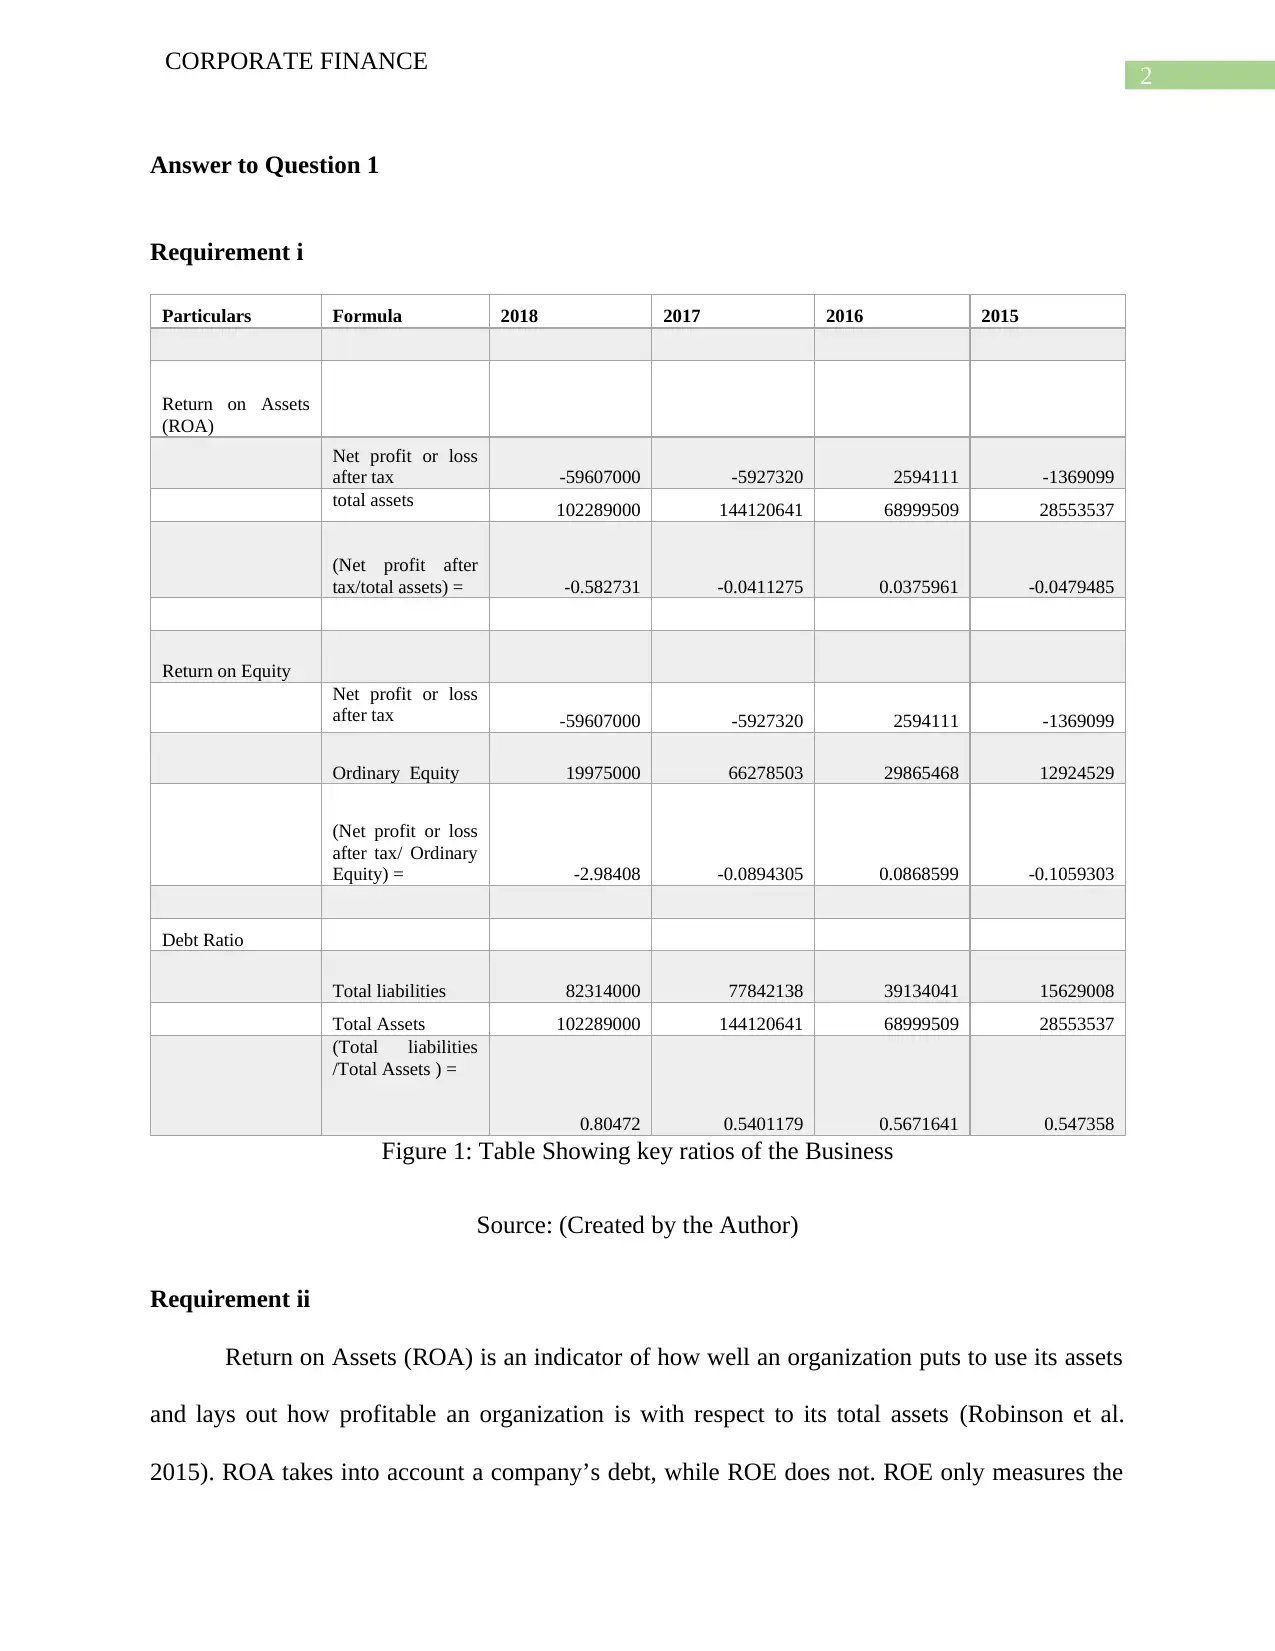
Requirement i
Particulars Formula 2018 2017 2016 2015
Return on Assets
(ROA)
Net profit or loss
after tax -59607000 -5927320 2594111 -1369099
total assets 102289000 144120641 68999509 28553537
(Net profit after
tax/total assets) = -0.582731 -0.0411275 0.0375961 -0.0479485
Return on Equity
Net profit or loss
after tax -59607000 -5927320 2594111 -1369099
Ordinary Equity 19975000 66278503 29865468 12924529
(Net profit or loss
after tax/ Ordinary
Equity) = -2.98408 -0.0894305 0.0868599 -0.1059303
Debt Ratio
Total liabilities 82314000 77842138 39134041 15629008
Total Assets 102289000 144120641 68999509 28553537
(Total liabilities
/Total Assets ) =
0.80472 0.5401179 0.5671641 0.547358
Figure 1: Table Showing key ratios of the Business
Source: (Created by the Author)
Requirement ii
Return on Assets (ROA) is an indicator of how well an organization puts to use its assets
and lays out how profitable an organization is with respect to its total assets (Robinson et al.
2015). ROA takes into account a company’s debt, while ROE does not. ROE only measures the
CORPORATE FINANCE
Answer to Question 1
Requirement i
Particulars Formula 2018 2017 2016 2015
Return on Assets
(ROA)
Net profit or loss
after tax -59607000 -5927320 2594111 -1369099
total assets 102289000 144120641 68999509 28553537
(Net profit after
tax/total assets) = -0.582731 -0.0411275 0.0375961 -0.0479485
Return on Equity
Net profit or loss
after tax -59607000 -5927320 2594111 -1369099
Ordinary Equity 19975000 66278503 29865468 12924529
(Net profit or loss
after tax/ Ordinary
Equity) = -2.98408 -0.0894305 0.0868599 -0.1059303
Debt Ratio
Total liabilities 82314000 77842138 39134041 15629008
Total Assets 102289000 144120641 68999509 28553537
(Total liabilities
/Total Assets ) =
0.80472 0.5401179 0.5671641 0.547358
Figure 1: Table Showing key ratios of the Business
Source: (Created by the Author)
Requirement ii
Return on Assets (ROA) is an indicator of how well an organization puts to use its assets
and lays out how profitable an organization is with respect to its total assets (Robinson et al.
2015). ROA takes into account a company’s debt, while ROE does not. ROE only measures the
⊘ This is a preview!⊘
Do you want full access?
Subscribe today to unlock all pages.
Trusted by 1+ million students worldwide
3
CORPORATE FINANCE
return on a company’s equity, leaving out the liabilities. The return on equity and return on assets
is considered to be one of the indicators of the success of the business.
As per the Balance sheet of the company Murray River Organics Group Limited there
had been reduction in inventories, property, plant and equipment meaning the company is
disposing off the assets and hence there is low return or rather negative one (Asx.com.au. 2019).
The negative ROE is an alarming factor for the business and reflects that the management of the
company is not able to meet the expectations of the shareholders and considerable adjustment
need to be made by the management of Murray River Organics Group Limited. The return on
assets is also an important factor which needs to be considered as well as this estimate is related
to the performance of the business in terms of the assets which is utilized by the business
(Dahmen and Rodríguez 2014). Therefore, the total assets and operating expenses of the
business plays a vital role in deciding whether the returns which is generated by the business are
appropriate or not.
Requirement iii
The computation which is shown in the table above reveals that the ROA is greater than
ROE in 2018 as ROE is dependent on earnings on equity. Since there is low profit, there is no
dividend paid, hence return on equity is low (Fernández and Gulan 2015). Return on assets is
comparatively high to return on equity as the assets have been put to use and they earned a
return, though it was negative (Bentley, Omer and Sharp 2013). The return on assets is shown to
be higher than the ROE on equity as the same is dependent on the total assets which is used by
the business while ROE is dependent on the total equity figure which is demonstrated in the
balance sheet of the company.
Paraphrase This Document
Need a fresh take? Get an instant paraphrase of this document with our AI Paraphraser

4
CORPORATE FINANCE
Answer to Question 2
Requirement i
1 2 3 4 5 6 7 8 9 10 11 12 13 14 15 16 17 18 19 20 21 22 23 24 25
-60.00%
-40.00%
-20.00%
0.00%
20.00%
40.00%
60.00%
80.00%
Share Price Movement
MURRAY RIVER ltd Share Price All-Ordinary Share Index
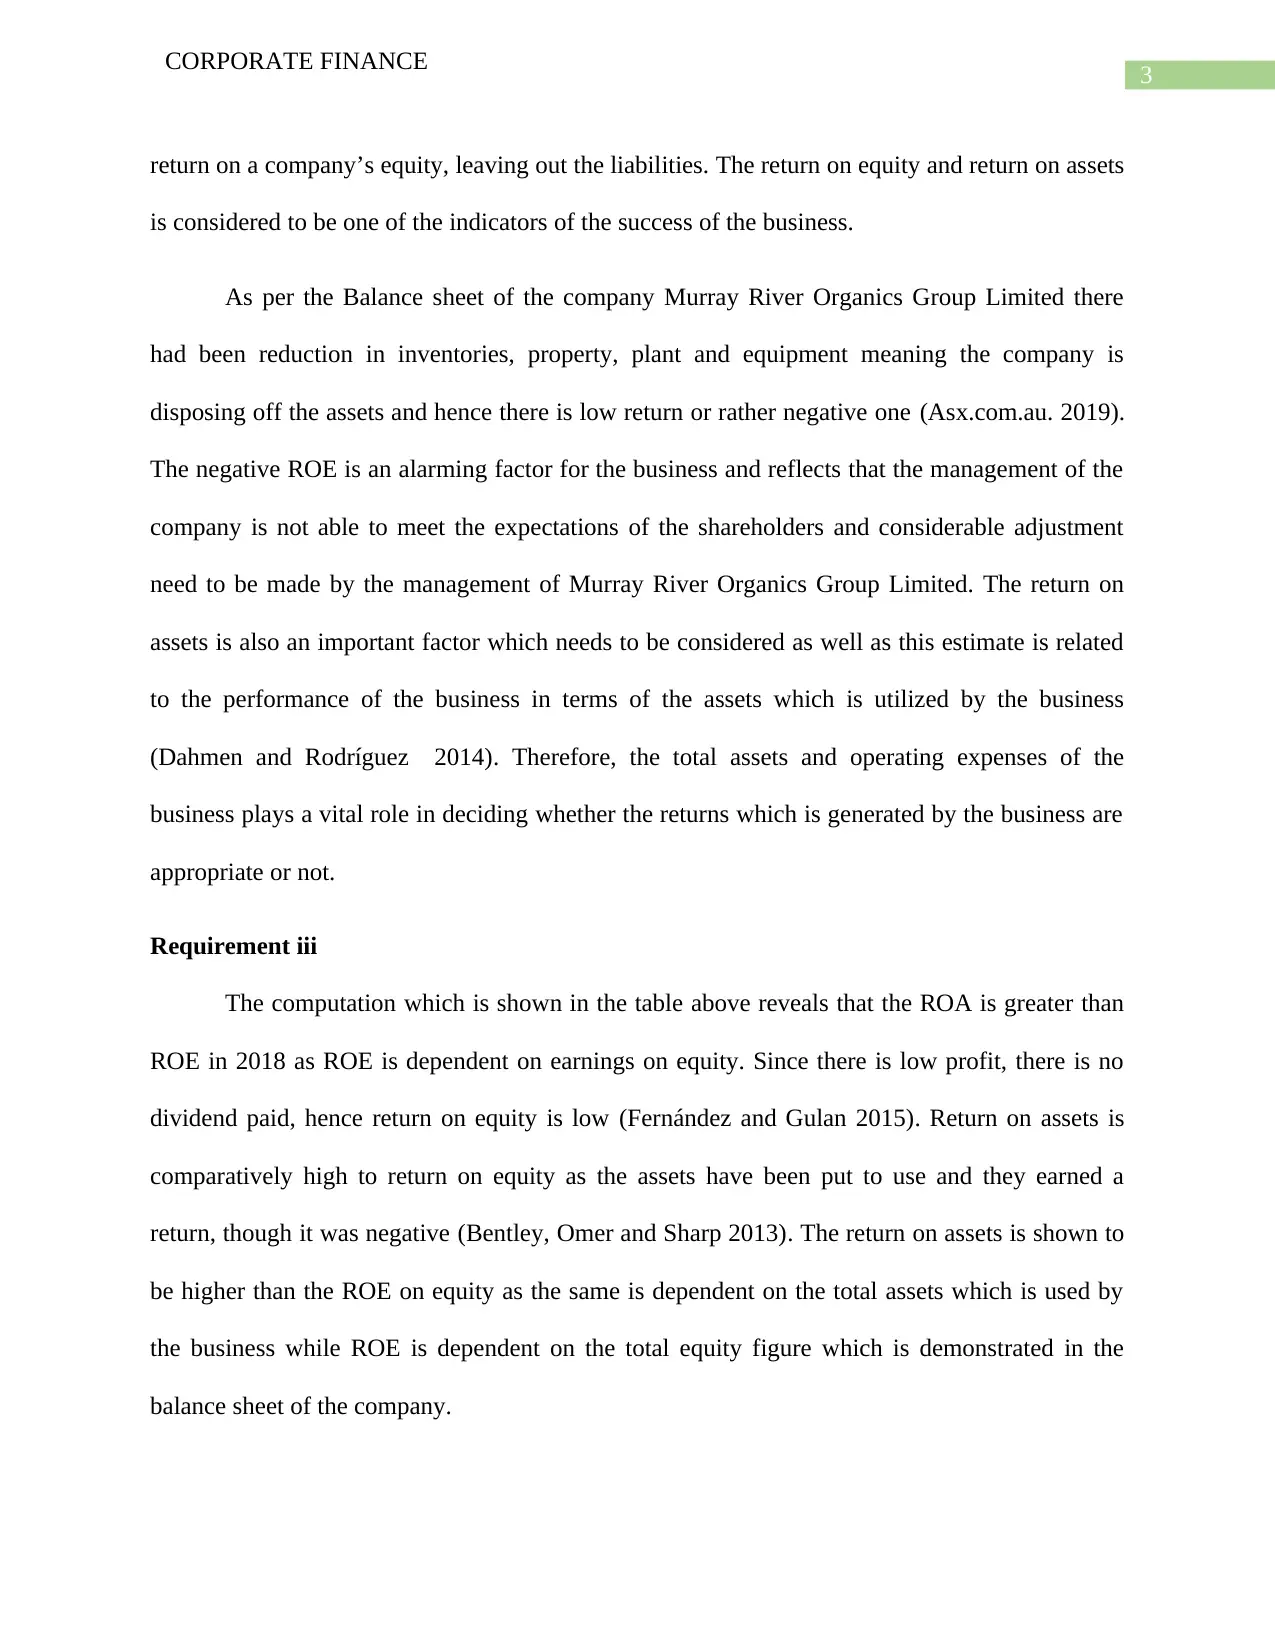
Figure 2: Chart Showing Share Price Comparisons
Source: (Au.finance.yahoo.com. 2019)
Requirement ii
The above chart which is shown in figure 2 represent the share price movements for the
business of Murray River Organics Group Limited for a period of two years. The above figure
shows that the share prices is moving in same proportion as the All Ordinary Index. The market
price shows significant fluctuations in the share prices which is shown in the above figure. The
fluctuation in the share prices shows the nature of the shares are volatile which also means that
there is an uncertainty regarding the movement in the share prices of the business (Storey 2016).
Therefore, from the point of view of the investors appropriate risk management steps such as
diversification strategies should be applied by the business.
CORPORATE FINANCE
Answer to Question 2
Requirement i
1 2 3 4 5 6 7 8 9 10 11 12 13 14 15 16 17 18 19 20 21 22 23 24 25
-60.00%
-40.00%
-20.00%
0.00%
20.00%
40.00%
60.00%
80.00%
Share Price Movement
MURRAY RIVER ltd Share Price All-Ordinary Share Index
Figure 2: Chart Showing Share Price Comparisons
Source: (Au.finance.yahoo.com. 2019)
Requirement ii
The above chart which is shown in figure 2 represent the share price movements for the
business of Murray River Organics Group Limited for a period of two years. The above figure
shows that the share prices is moving in same proportion as the All Ordinary Index. The market
price shows significant fluctuations in the share prices which is shown in the above figure. The
fluctuation in the share prices shows the nature of the shares are volatile which also means that
there is an uncertainty regarding the movement in the share prices of the business (Storey 2016).
Therefore, from the point of view of the investors appropriate risk management steps such as
diversification strategies should be applied by the business.
5
CORPORATE FINANCE
Answer to Question 3
Requirement i
Weighted Average Cost of Capital
Cost of Equity (Ke) 15.04%
Cost of Debt (Kd) 5%
Weight of Debt 78%
Weight of Equity 22%
WACC = Weight of Equity* Cost of Equity+ Weight
of Debt*Cost of Debt
WACC = 7.21%
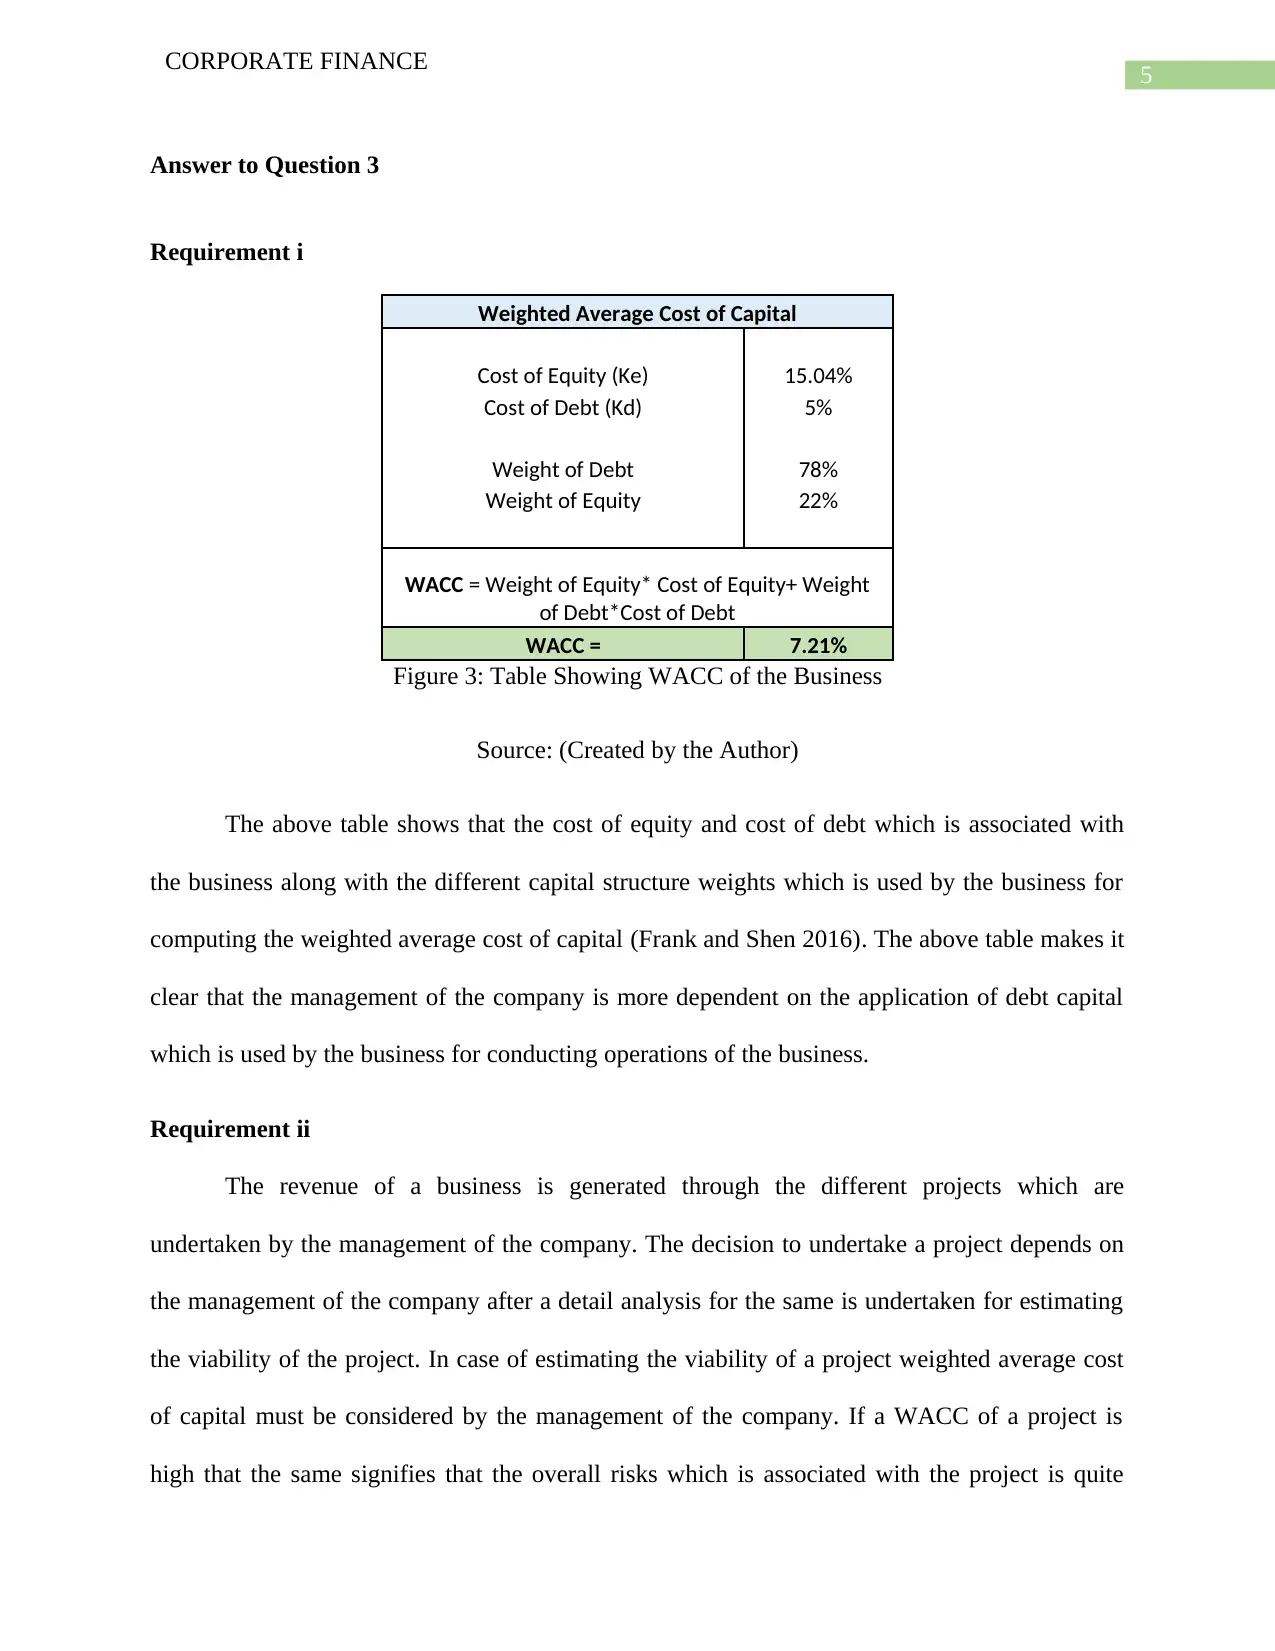
Figure 3: Table Showing WACC of the Business
Source: (Created by the Author)
The above table shows that the cost of equity and cost of debt which is associated with
the business along with the different capital structure weights which is used by the business for
computing the weighted average cost of capital (Frank and Shen 2016). The above table makes it
clear that the management of the company is more dependent on the application of debt capital
which is used by the business for conducting operations of the business.
Requirement ii
The revenue of a business is generated through the different projects which are
undertaken by the management of the company. The decision to undertake a project depends on
the management of the company after a detail analysis for the same is undertaken for estimating
the viability of the project. In case of estimating the viability of a project weighted average cost
of capital must be considered by the management of the company. If a WACC of a project is
high that the same signifies that the overall risks which is associated with the project is quite
CORPORATE FINANCE
Answer to Question 3
Requirement i
Weighted Average Cost of Capital
Cost of Equity (Ke) 15.04%
Cost of Debt (Kd) 5%
Weight of Debt 78%
Weight of Equity 22%
WACC = Weight of Equity* Cost of Equity+ Weight
of Debt*Cost of Debt
WACC = 7.21%
Figure 3: Table Showing WACC of the Business
Source: (Created by the Author)
The above table shows that the cost of equity and cost of debt which is associated with
the business along with the different capital structure weights which is used by the business for
computing the weighted average cost of capital (Frank and Shen 2016). The above table makes it
clear that the management of the company is more dependent on the application of debt capital
which is used by the business for conducting operations of the business.
Requirement ii
The revenue of a business is generated through the different projects which are
undertaken by the management of the company. The decision to undertake a project depends on
the management of the company after a detail analysis for the same is undertaken for estimating
the viability of the project. In case of estimating the viability of a project weighted average cost
of capital must be considered by the management of the company. If a WACC of a project is
high that the same signifies that the overall risks which is associated with the project is quite
⊘ This is a preview!⊘
Do you want full access?
Subscribe today to unlock all pages.
Trusted by 1+ million students worldwide
6
CORPORATE FINANCE
high (Li, Ng and Swaminathan 2013). The level of risks is a determining factor which needs to
be considered for estimating the financial viability of the project and also take appropriate
decisions on the basis of the same if the project is to be undertaken by the business or not.
Answer to Question 4
Requirement i
Capital structure can be a mixture of an organization’s long-term debt, short-term debt,
common equity and preferred equity. An organization’s proportion of short- and long-term
debt is considered when analyzing capital structure. When analysts refer to capital structure, they
are most likely referring to an organization’s debt-to-equity (D/E) ratio, which provides insight
into how risky an organization is. Usually, an organization that is heavily financed by debt has a
more aggressive capital structure and therefore poses greater risk to investors (Berry, Betterton
and Karagiannidis 2014). This risk, however, may be the primary source of the organization’s
growth.
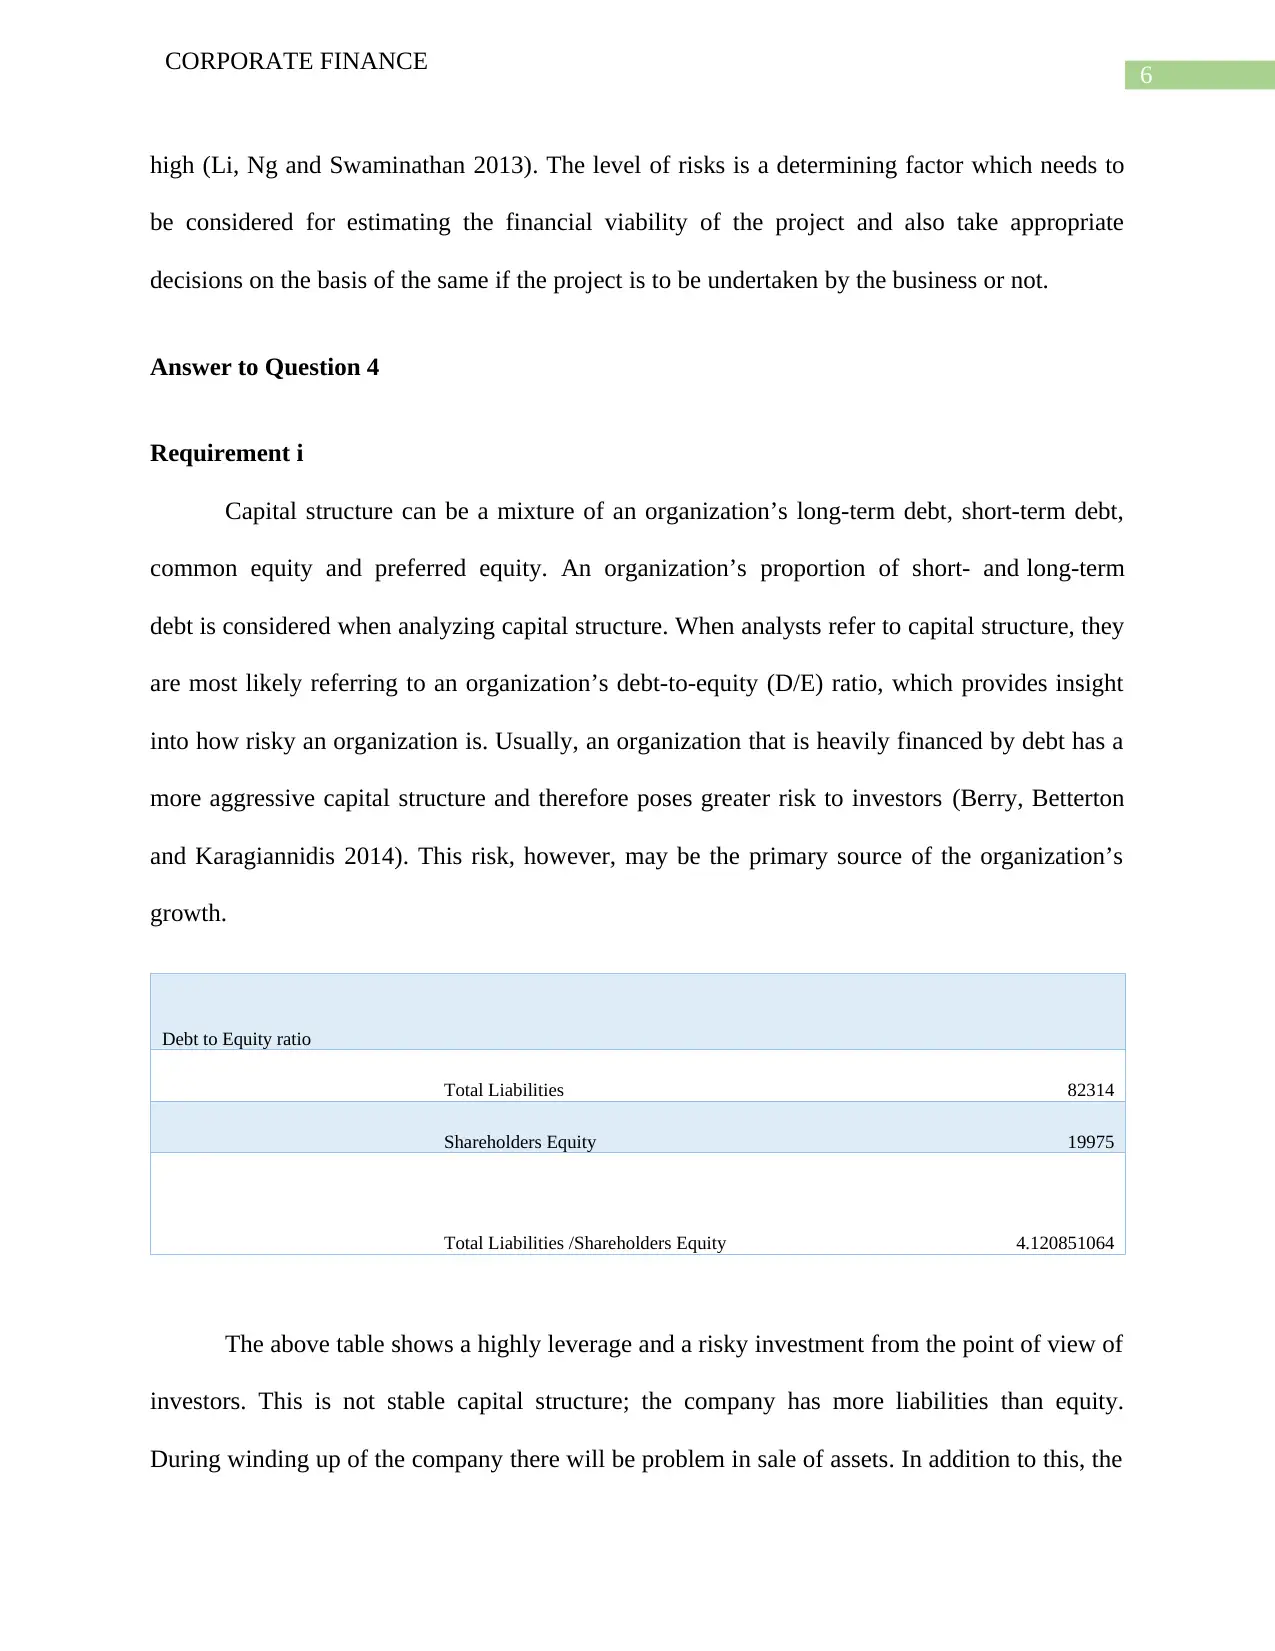
Debt to Equity ratio
Total Liabilities 82314
Shareholders Equity 19975
Total Liabilities /Shareholders Equity 4.120851064
The above table shows a highly leverage and a risky investment from the point of view of
investors. This is not stable capital structure; the company has more liabilities than equity.
During winding up of the company there will be problem in sale of assets. In addition to this, the
CORPORATE FINANCE
high (Li, Ng and Swaminathan 2013). The level of risks is a determining factor which needs to
be considered for estimating the financial viability of the project and also take appropriate
decisions on the basis of the same if the project is to be undertaken by the business or not.
Answer to Question 4
Requirement i
Capital structure can be a mixture of an organization’s long-term debt, short-term debt,
common equity and preferred equity. An organization’s proportion of short- and long-term
debt is considered when analyzing capital structure. When analysts refer to capital structure, they
are most likely referring to an organization’s debt-to-equity (D/E) ratio, which provides insight
into how risky an organization is. Usually, an organization that is heavily financed by debt has a
more aggressive capital structure and therefore poses greater risk to investors (Berry, Betterton
and Karagiannidis 2014). This risk, however, may be the primary source of the organization’s
growth.
Debt to Equity ratio
Total Liabilities 82314
Shareholders Equity 19975
Total Liabilities /Shareholders Equity 4.120851064
The above table shows a highly leverage and a risky investment from the point of view of
investors. This is not stable capital structure; the company has more liabilities than equity.
During winding up of the company there will be problem in sale of assets. In addition to this, the
Paraphrase This Document
Need a fresh take? Get an instant paraphrase of this document with our AI Paraphraser
7
CORPORATE FINANCE
overall debt of the business is shown to be significantly high which is a matter of concern for the
business.
Requirement ii
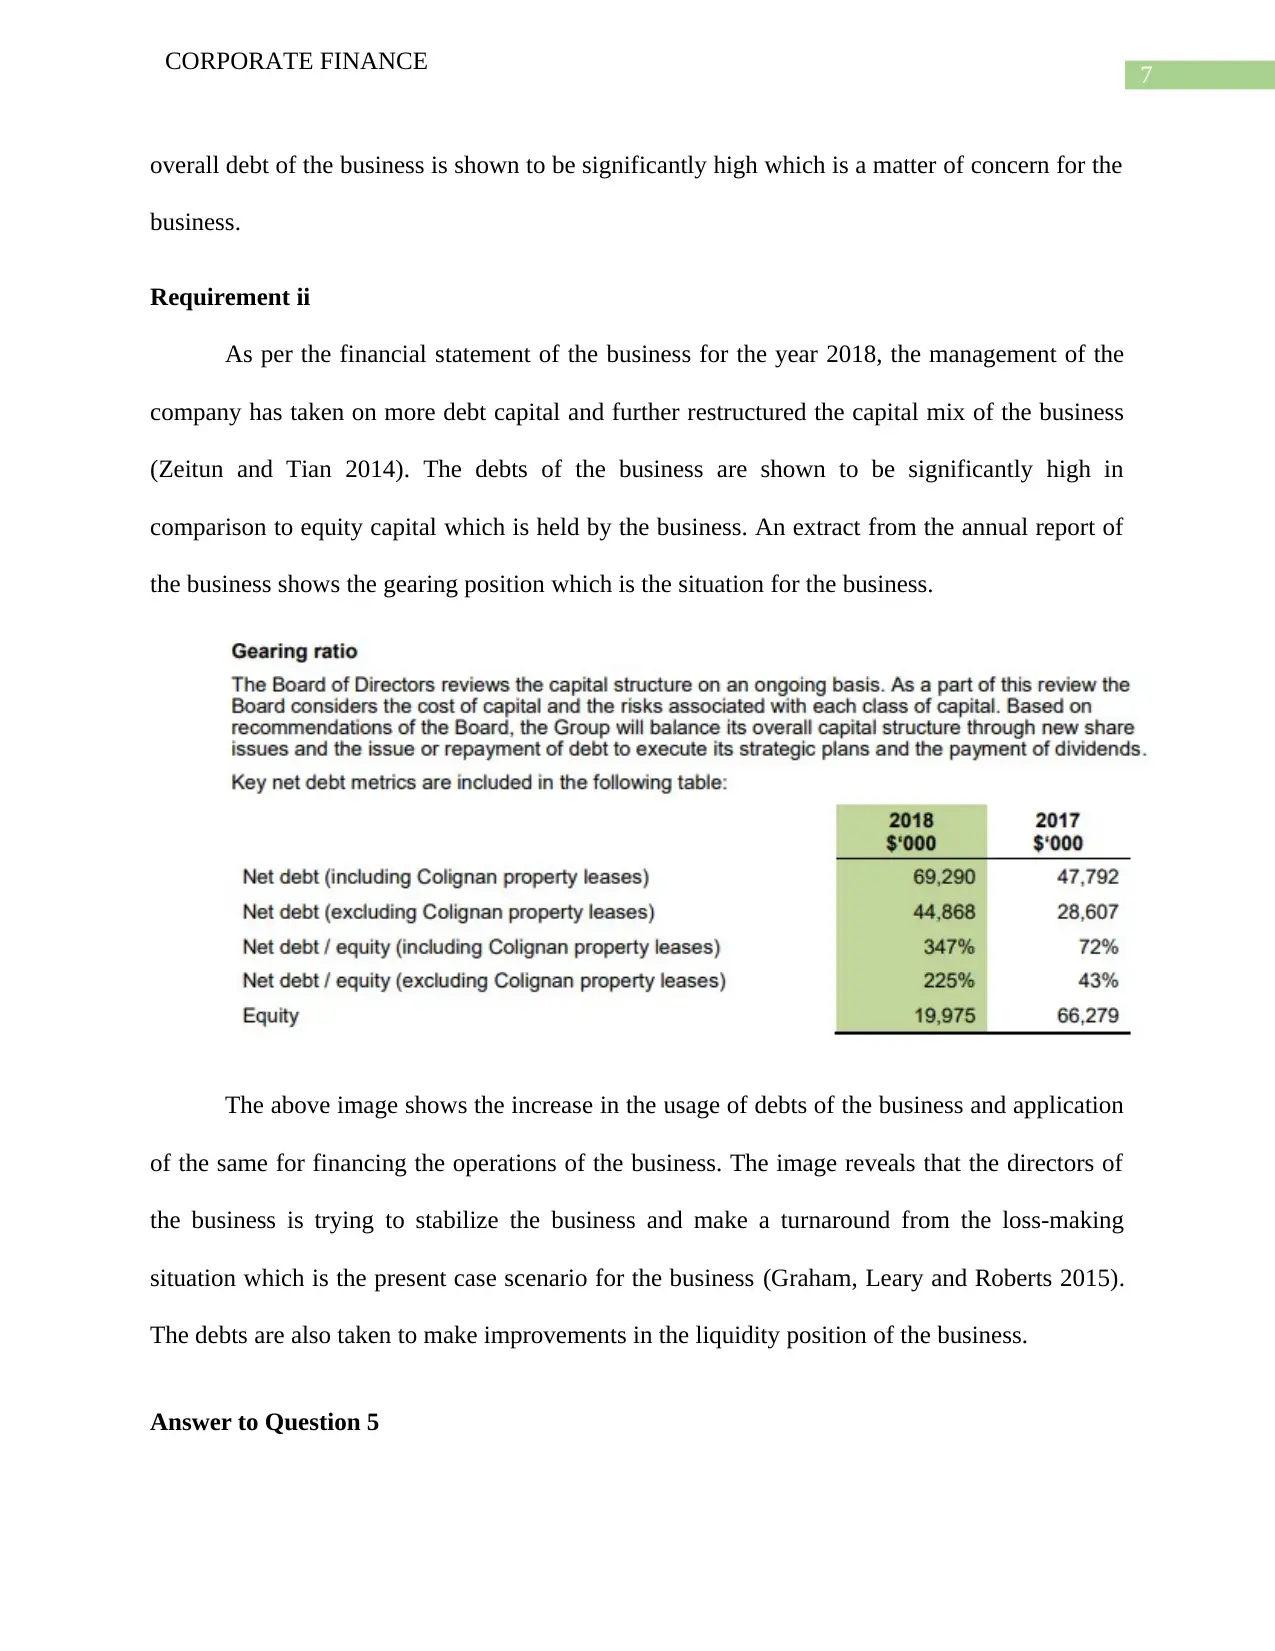
As per the financial statement of the business for the year 2018, the management of the
company has taken on more debt capital and further restructured the capital mix of the business
(Zeitun and Tian 2014). The debts of the business are shown to be significantly high in
comparison to equity capital which is held by the business. An extract from the annual report of
the business shows the gearing position which is the situation for the business.
The above image shows the increase in the usage of debts of the business and application
of the same for financing the operations of the business. The image reveals that the directors of
the business is trying to stabilize the business and make a turnaround from the loss-making
situation which is the present case scenario for the business (Graham, Leary and Roberts 2015).
The debts are also taken to make improvements in the liquidity position of the business.
Answer to Question 5
CORPORATE FINANCE
overall debt of the business is shown to be significantly high which is a matter of concern for the
business.
Requirement ii
As per the financial statement of the business for the year 2018, the management of the
company has taken on more debt capital and further restructured the capital mix of the business
(Zeitun and Tian 2014). The debts of the business are shown to be significantly high in
comparison to equity capital which is held by the business. An extract from the annual report of
the business shows the gearing position which is the situation for the business.
The above image shows the increase in the usage of debts of the business and application
of the same for financing the operations of the business. The image reveals that the directors of
the business is trying to stabilize the business and make a turnaround from the loss-making
situation which is the present case scenario for the business (Graham, Leary and Roberts 2015).
The debts are also taken to make improvements in the liquidity position of the business.
Answer to Question 5
8
CORPORATE FINANCE
Letter of Recommendation
On the basis of the analysis which is conducted on Murray River Organics Group
Limited, the investor should not make investments in the business as the results which are
demonstrated from the analysis reveals that the company is not generating appropriate returns for
the shareholders. In fact, the business has incurred losses and as per the estimates which are
computed of ROE and ROA reveals negative balances which is sign that the business facing
profitability issues. In addition to this, the business has taken significant amount of debts which
is represented in the balance sheet of the company which is not a favorable sign. The reliance of
debt indicates that the business is at risks and faces a burden of interest payments. In addition to
this, it also suggests that the liquidity position of the business is compromised which is a
negative indicator for the business. Therefore, it can be suggested that the client should not
invest in the business.
⊘ This is a preview!⊘
Do you want full access?
Subscribe today to unlock all pages.
Trusted by 1+ million students worldwide
9
CORPORATE FINANCE
Reference
Asx.com.au. (2019). [online] Available at:
https://www.asx.com.au/asx/share-price-research/company/MRG [Accessed 8 Jun. 2019].
Au.finance.yahoo.com. (2019). Yahoo is now a part of Oath. [online] Available at:
https://au.finance.yahoo.com/quote/MRG.AX/history?p=MRG.AX [Accessed 8 Jun. 2019].
Bentley, K.A., Omer, T.C. and Sharp, N.Y., 2013. Business strategy, financial reporting
irregularities, and audit effort. Contemporary Accounting Research, 30(2), pp.780-817.
Berry, S.G., Betterton, C.E. and Karagiannidis, I., 2014. Understanding weighted average cost of
capital: A pedagogical application. Journal of Financial Education, pp.115-136.
Dahmen, P. and Rodríguez, E., 2014. Financial literacy and the success of small businesses: An
observation from a small business development center. Numeracy, 7(1), p.3.
Fernández, A. and Gulan, A., 2015. Interest rates, leverage, and business cycles in emerging
economies: The role of financial frictions. American Economic Journal: Macroeconomics, 7(3),
pp.153-88.
Frank, M.Z. and Shen, T., 2016. Investment and the weighted average cost of capital. Journal of
Financial Economics, 119(2), pp.300-315.
Graham, J.R., Leary, M.T. and Roberts, M.R., 2015. A century of capital structure: The
leveraging of corporate America. Journal of Financial Economics, 118(3), pp.658-683.
Paraphrase This Document
Need a fresh take? Get an instant paraphrase of this document with our AI Paraphraser
10
CORPORATE FINANCE
Li, Y., Ng, D.T. and Swaminathan, B., 2013. Predicting market returns using aggregate implied
cost of capital. Journal of Financial Economics, 110(2), pp.419-436.
Robinson, T.R., Henry, E., Pirie, W.L. and Broihahn, M.A., 2015. International financial
statement analysis. John Wiley & Sons.
Storey, D.J., 2016. Understanding the small business sector. Routledge.
Zeitun, R. and Tian, G.G., 2014. Capital structure and corporate performance: evidence from
Jordan. Australasian Accounting Business & Finance Journal, Forthcoming.
1 out of 11
Related Documents


Your All-in-One AI-Powered Toolkit for Academic Success.
+13062052269
info@desklib.com
Available 24*7 on WhatsApp / Email
![[object Object]](/_next/static/media/star-bottom.7253800d.svg)
Unlock your academic potential
Copyright © 2020–2026 A2Z Services. All Rights Reserved. Developed and managed by ZUCOL.