Finance Report: Myer Holdings vs. Wesfarmers - Financial Analysis

Verified

Added on  2020/11/23

|23
|4378
|457
Report
AI Summary
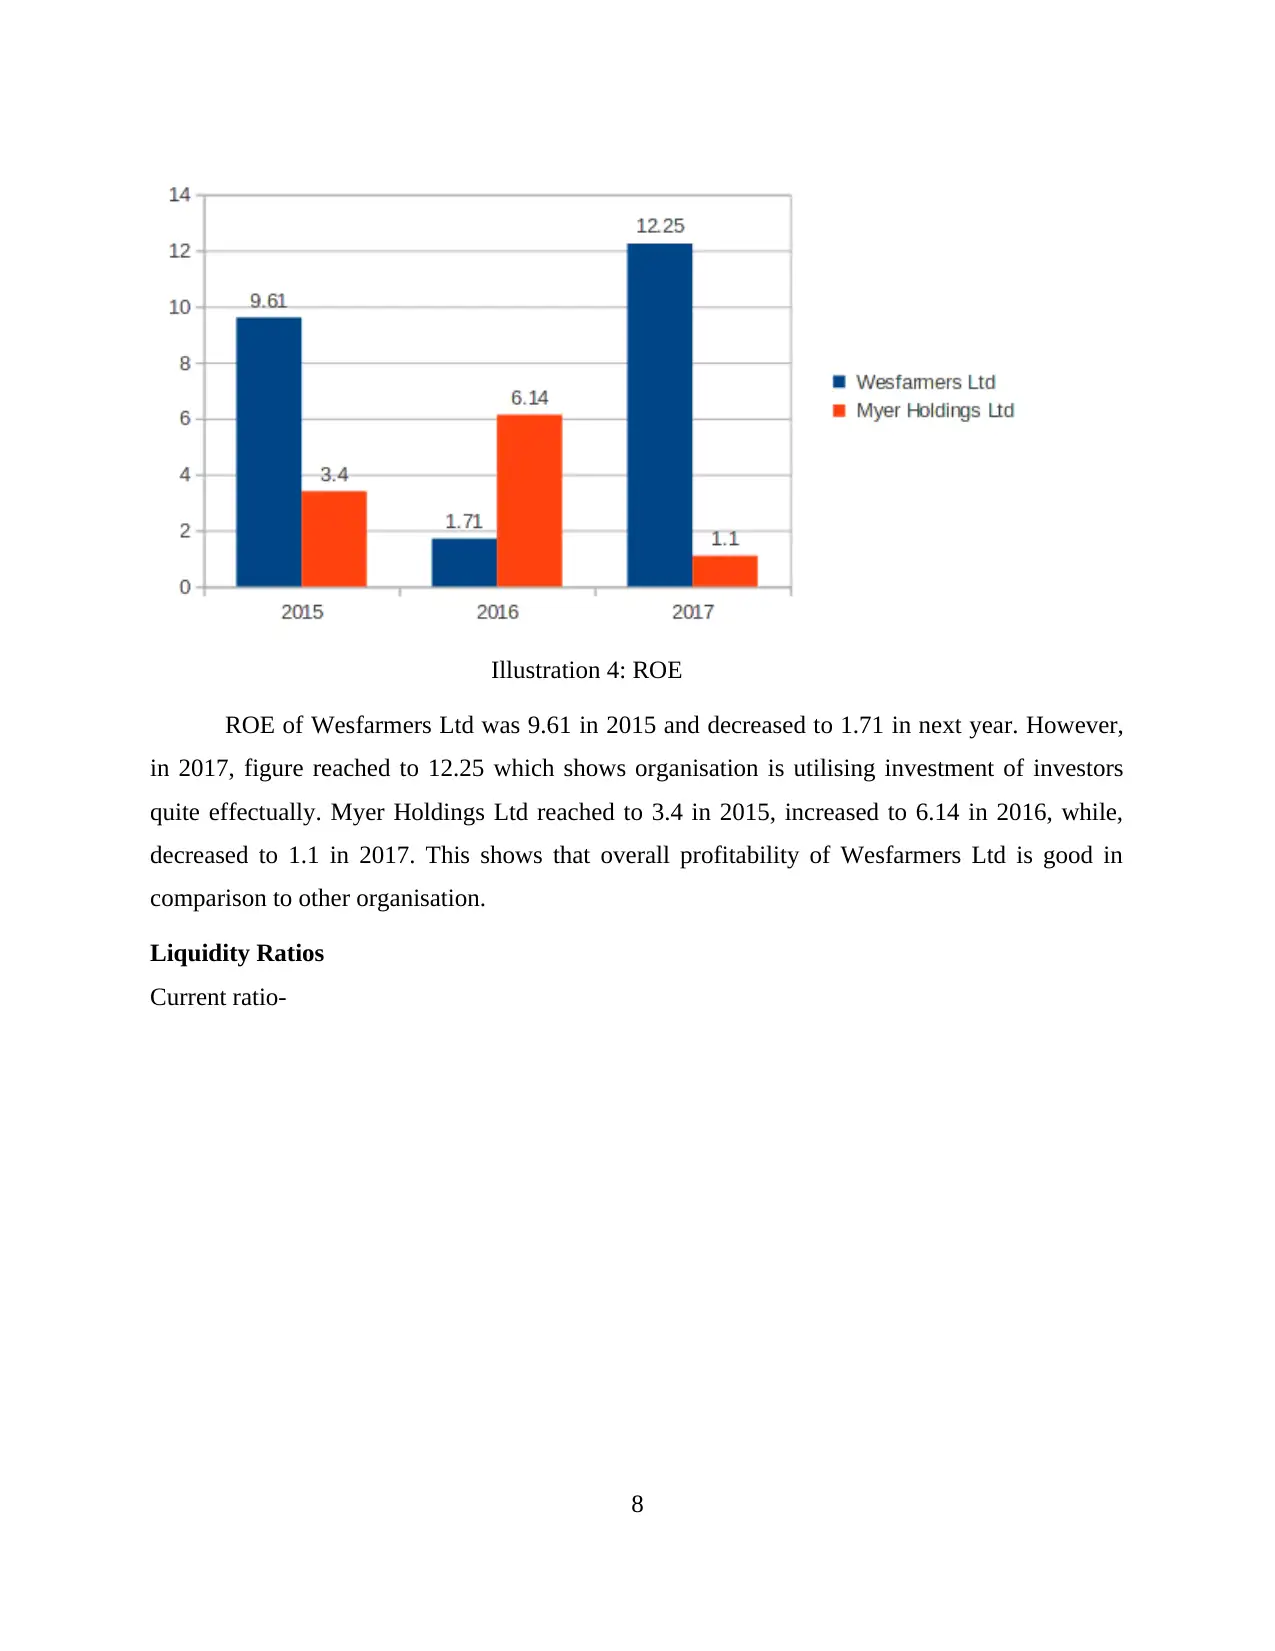
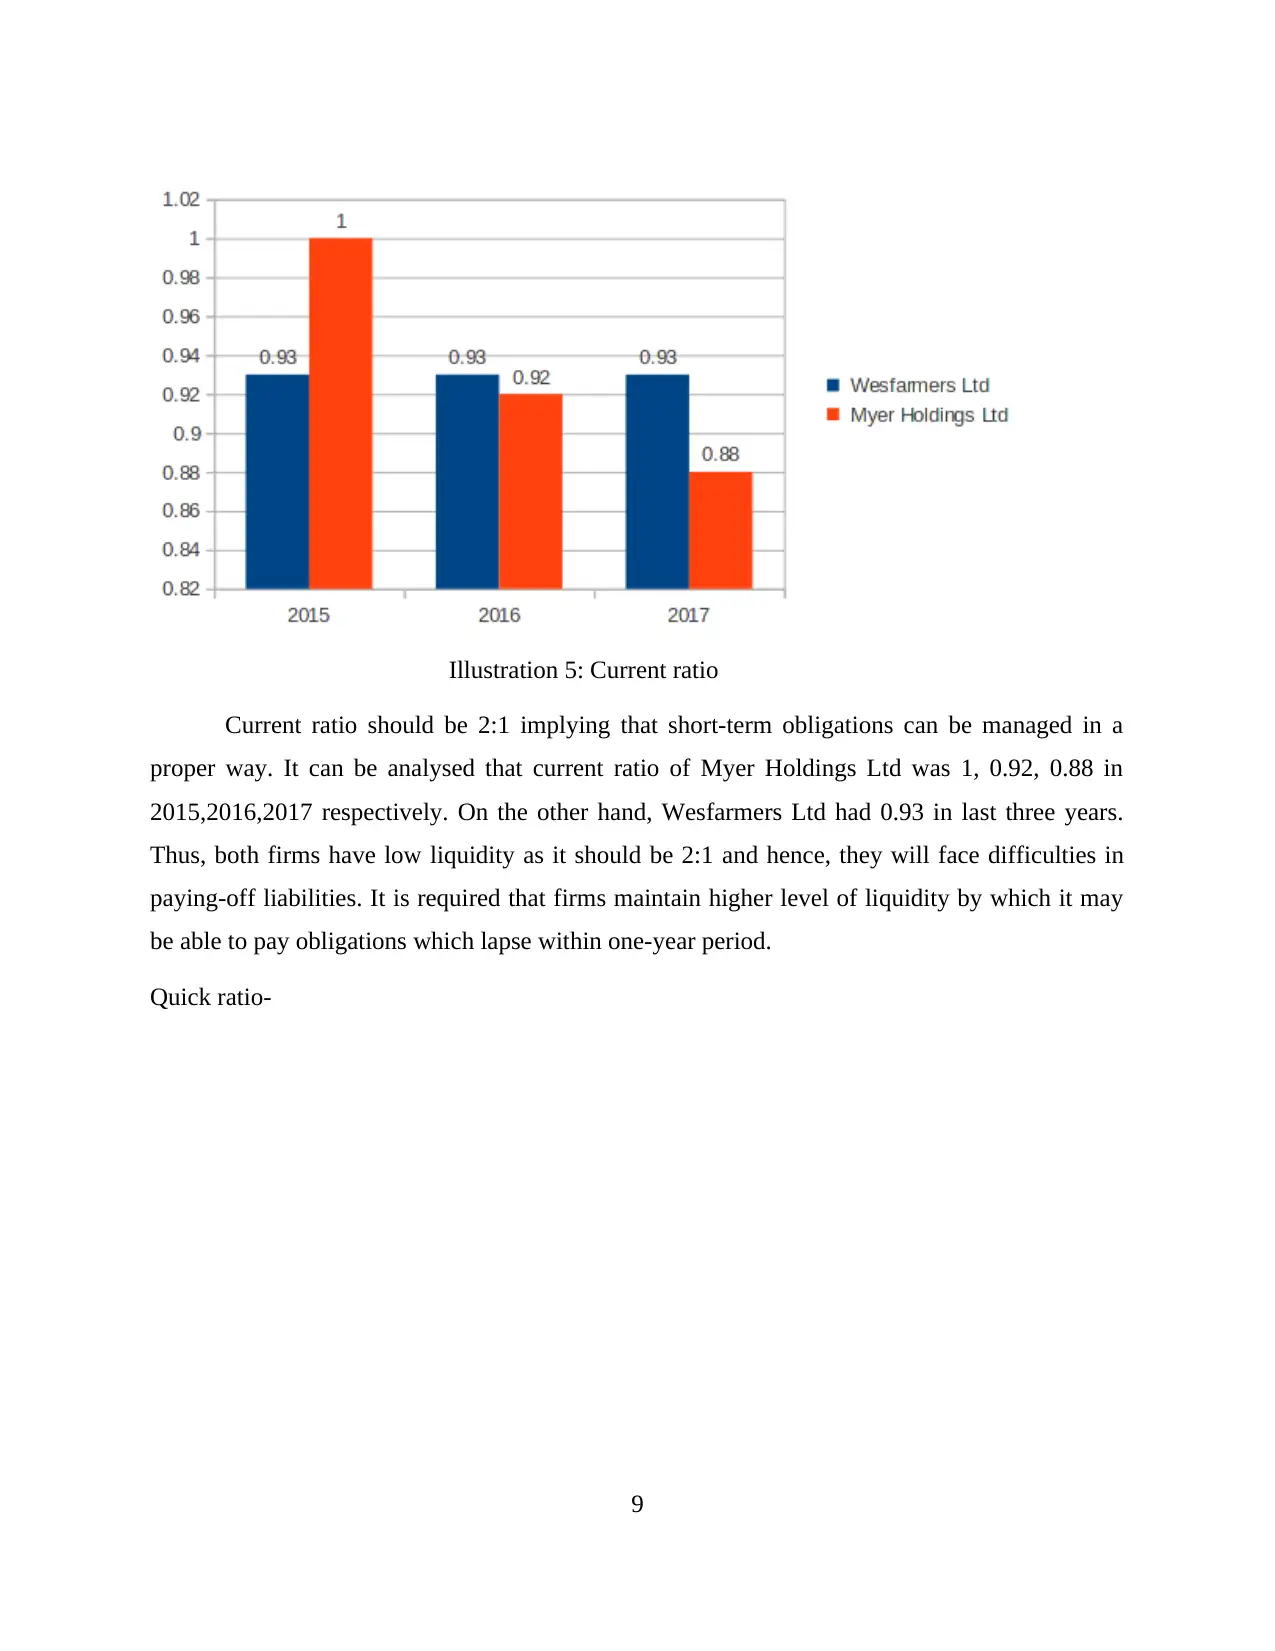
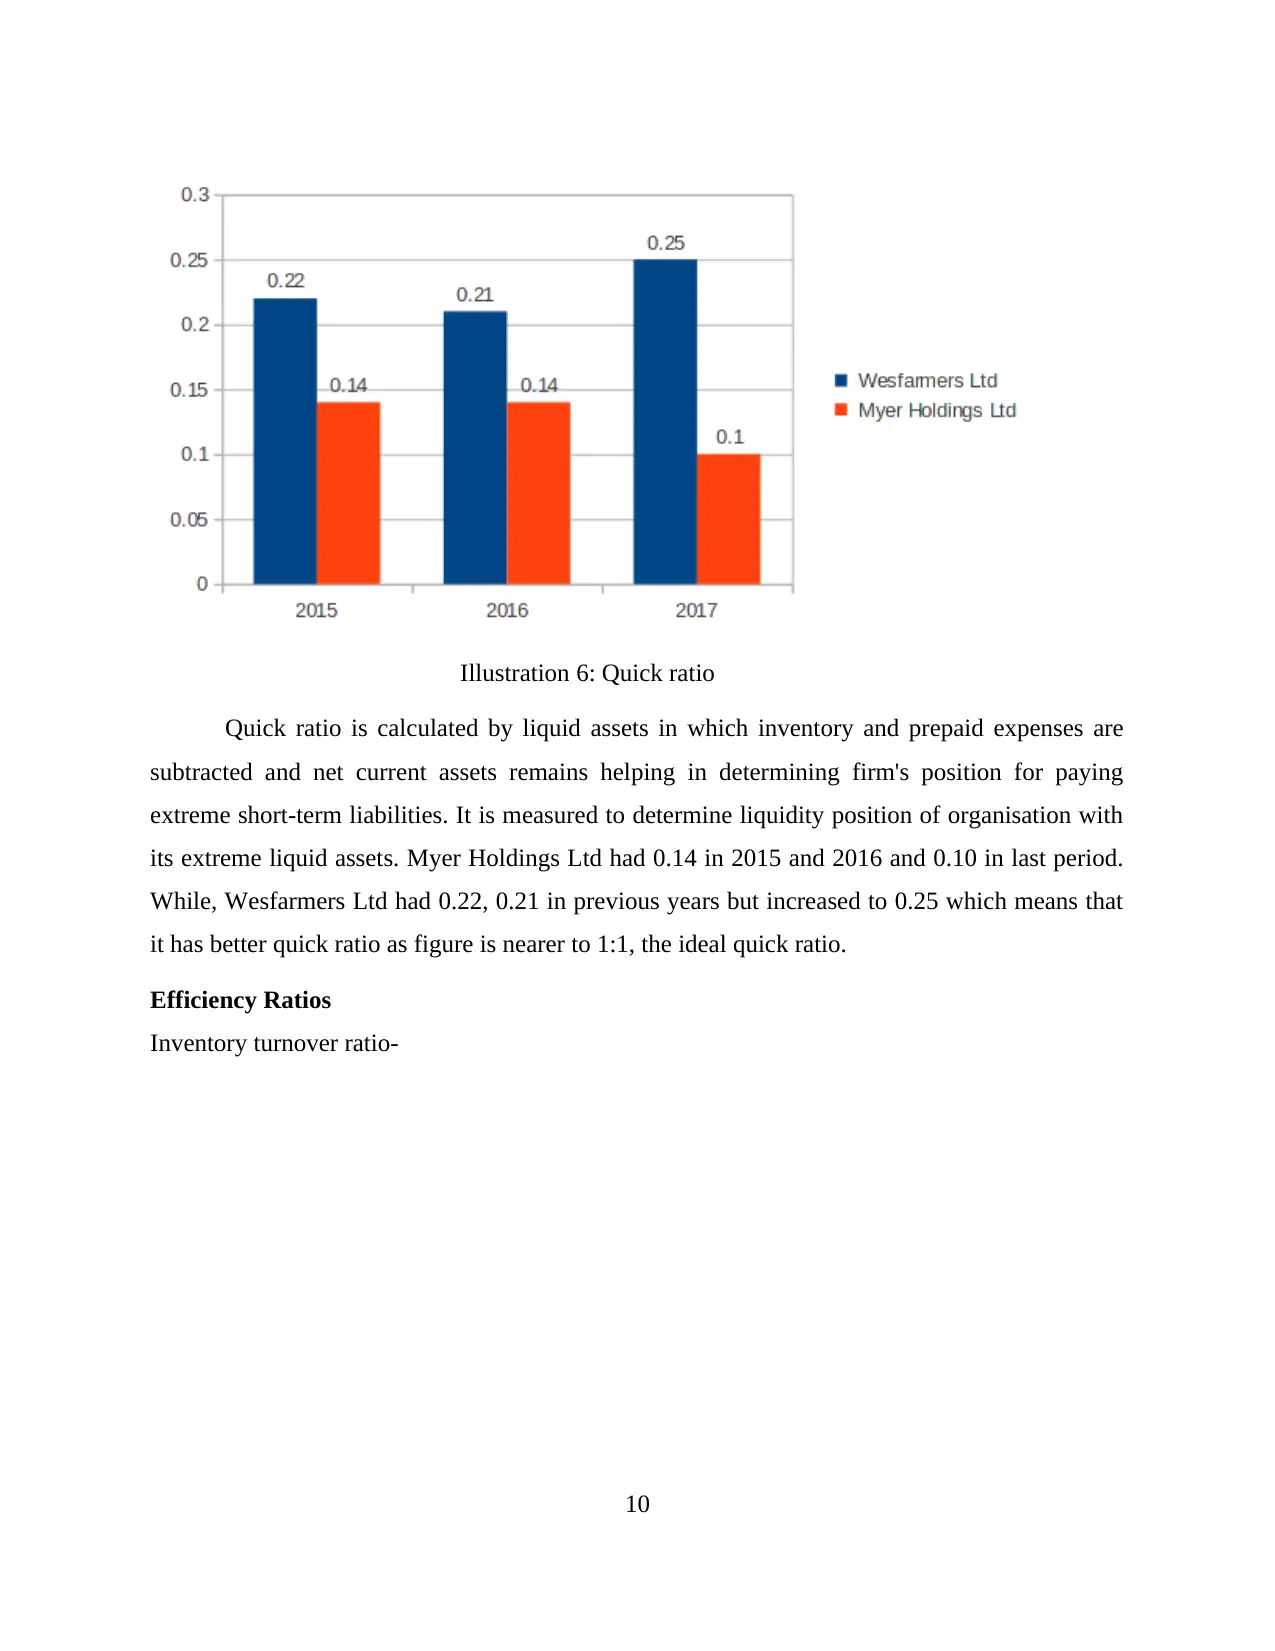
This report offers a comparative financial analysis of Myer Holdings Ltd and Wesfarmers Ltd. It begins with an overview of their operations and comparative advantages, followed by a detailed examination of their financial ratios, including profitability, liquidity, efficiency, and capital structure. The analysis covers three years of data, comparing key metrics to assess their financial health and performance. Furthermore, the report investigates the companies' share price movements, identifies factors influencing these prices, and applies the Capital Asset Pricing Model (CAPM) to calculate beta values and expected rates of return. The report also discusses the dividend policies implemented by each organization and concludes with a recommendation letter to a client regarding potential investment in a portfolio. The analysis aims to provide a comprehensive understanding of the financial positions and investment potential of both companies.
Document Page
FINANCE FOR BUSINESS
tabler-icon-diamond-filled.svg

Paraphrase This Document

Need a fresh take? Get an instant paraphrase of this document with our AI Paraphraser
Document Page
TABLE OF CONTENTS
INTRODUCTION...........................................................................................................................1
1. Description of operation and comparative advantages of listed companies.......................1
2. Calculation of financial ratios and comparison of performance of organisations..............2
3. Analysing monthly share prices movements of companies in past three years...............15
..............................................................................................................................................15
4. Factors influenced the share prices...................................................................................16
5. Computation of beta values and Expected Rates of Return using the CAPM model......17
6. Discussing dividend policies implemented by organisations...........................................18
7. Recommendation letter to client for investing in portfolio..............................................18
CONCLUSION..............................................................................................................................19
REFERENCES..............................................................................................................................20
Document Page
INTRODUCTION
In context of business unit, manager plays a vital role in decision making which makes
contribution in the growth and development. For this purpose, manager undertakes several tools
and techniques which provides assistance in taking profitable financial decisions. For this project
report, Myer Holdings Ltd has been selected which offers retail products or services to the
customers. Product portfolio of Myer Holdings Ltd include women’s, men’s, babies clothing &
accessories, homewares etc. In relation to this, present report will provide deeper insights about
the extent to which financial position and performance of Myer Holdings Ltd is good over rival
firm namely Wesfarmers Ltd. Further, it will shed light on the share price movements of
companies which in turn will be considered for investigation purpose for investors maintaining
their portfolio. CAPM model helps in assessing required rate of return calculation. Along with
this, report also presents dividend policies which are framed and introduced by higher
management team.
1. Description of operation and comparative advantages of listed companies
Wesfarmers Ltd is one of the biggest company of Australia having diversified businesses
and big name in retail industry. It has been operating since 1914 in Western Australia as a
farmers' cooperative and has grown into conglomerate company listed on ASX. It operates in
Australia, Bangladesh, Ireland, UK and New Zealand having good performances in all its
worldwide areas and able to earn higher amount of profits quite effectively. It has acquired
various companies such as Coles Group, Bunnings Group, Liquorland, Kleenheat and other
subsidiaries collectively providing quality goods and services to customers. In 2001, Wesfarmers
Ltd became public listed organisation and ending cooperative ownership and then it began to
acquire other profitable firms for enhanced operations (Who we are, 2018).
It has been reported in half-year financial statements ended on 31 December 2017 that
organisation observed 54.2 % decline in EBIT to $1.1 billion. The decline in operations were
mainly identified because of poor market performance of Coles Supermarkets which is a leading
profit generator in its overall earnings. The reasons such as lower financial services profits
particularly in sale of credit card receivables, reduction in fuel earnings etc. The operations of
Wesfarmers Ltd include supermarkets, hotel and convenience shops, liquor, supplies to office,
1
Document Page
home improvement, department stores. Moreover, businesses in energy, chemical, coal and
industrial safety products etc are also handled by company.
Myer Holdings Ltd has been operating since 1900 and founded by Sidney Myer. It is
engaged in department store business with approximately 60 stores in Australia with
merchandise in 11 item categories such as Womenswear, Menswear, apparels, beauty,
homewares, electrical goods, footwear, handbags, fragrances and cosmetics etc. It has various
brands such as TOPSHOP TOPMAN, Seed, French Connection, Mimco and Jack and Jones etc.
which helps to earn profits. The comparative advantage of Myer Holdings Ltd can be explained
such as it is engaged in retail department store which have diversified products. Furthermore, it
has created sustainable point in price and value. Thus, it is easily targeting markets of Australia
by having good profits in hand. While, Wesfarmers Ltd has major competitive advantage as it is
engaged in conglomerate business and caters to demand of customers by delivering quality
services. It is ahead of Myer Holdings Ltd in terms of businesses as it has acquired plenty of
divisions leading to more market share and increased operations.
2. Calculation of financial ratios and comparison of performance of organisations
Financial Ratios
Wesfarmers
Ltd
Myer
Holdings
Ltd
Particulars Formula 2017 2016 2015 2017 2016 2015
Profitability ratios
Net profit
margin(%)
Net Profit /
sales 4.22 0.62 3.93 0.46 2.18 1.08
Gross profit
margin(%)
Gross
Profit / sales 31.8 30.5 30.7 45.8 45.1 46.1
Return on Assets Net Profit / 7.1 1 6.09 0.64 3.23 1.56
2
tabler-icon-diamond-filled.svg

Paraphrase This Document

Need a fresh take? Get an instant paraphrase of this document with our AI Paraphraser
Document Page
(ROA)(%) total assets
Return on Equity
(ROE)(%)
Net Profit /
Total equity 12.25 1.71 9.61 1.1 6.14 3.4
Liquidity ratios
Current ratio
Current
assets /
Current
Liabilities 0.93 0.93 0.93 0.88 0.92 1
Quick ratio
Liquid
assets /
Current
liabilities 0.25 0.21 0.22 0.1 0.14 0.14
Efficiency Ratios
Inventory turnover
ratio
Cost of
goods
manufacture
d / Average
inventory 7.25 7.74 7.95 3.7 3.93 3.94
Receivables
Turnover ratio
Credit
sales /
52.56 53.9 56.64 305.92 350.22 573.34
3
Document Page
Average
trade
receivable
Asset turnover
ratio(%)
Sales / Total
assets 1.68 1.61 1.55 1.4 1.48 1.45
Creditor Turnover
ratio
Credit
purchase /
Average
trade
payable 51.59 49.12 47.39 47.56 45.43 48.23
Capital structure
(leverage) ratio
Debt to Equity ratio
Debt /
Equity 0.17 0.25 0.19 0.13 0.13 0.51
Profitability Ratios-
Net profit margin-
4
Document Page
Illustration 1: Net profit margin
It can be interpreted from the above graph that net profit margin has been calculated for
two firms listed on ASX. In 2015, ratio of Wesfarmers Ltd was 3.93, decreased to 0.62 in 2016
and reached to 4.22 in 2017 (Annual Report of Wesfamers Ltd, 2017). It implies that company's
net margin is increased from previous years implying maximisation in terms of profitability. On
the other hand, Myer Holdings Ltd has observed 1.08 in 2015 which increased to 2.18 in next
year but decreased to 0.46 in 2017. It can be analysed that Myer Holdings Ltd needs to control
operating and non-operating expenses so as to garner higher profits.
Gross profit margin-
5
tabler-icon-diamond-filled.svg

Paraphrase This Document

Need a fresh take? Get an instant paraphrase of this document with our AI Paraphraser
Document Page
Illustration 2: Gross profit margin
Gross margin of Myer Holdings Ltd was 46.1 in 2015 which minimised to 45.1 in next
period with an increase in 2017 to 45.8 highlighting that company has effectively initiated
control on cost of goods manufactured imparting higher profits up to a high extent. While,
Wesfarmers Ltd has garnered 30.7 and 30.5 in 2015 and 2016 respectively with increase in 2017
to 31.8 which can be stated that company has achieved growth in gross profit but is lower as
compared to Myer Holdings Ltd (Annual Report of Myer Holdings Ltd, 2017).
ROA-
6
Document Page
Illustration 3: ROA
ROA means that profit is being generated by utilising assets. It can be analysed from the
chart that ROA of Wesfarmers Ltd was 6.09 in 2015 which significantly reduced to 1 in 2016.
But it again increased to 7 in 2016 which implies it is using assets. On the other hand, Myer
Holdings Ltd had 1.56 in 2015, increased to 3.23 in next year. However, decreased to 0.64
showing significant decline as assets were not utilised up to a major extent.
ROE-
7
Document Page
Illustration 4: ROE
ROE of Wesfarmers Ltd was 9.61 in 2015 and decreased to 1.71 in next year. However,
in 2017, figure reached to 12.25 which shows organisation is utilising investment of investors
quite effectually. Myer Holdings Ltd reached to 3.4 in 2015, increased to 6.14 in 2016, while,
decreased to 1.1 in 2017. This shows that overall profitability of Wesfarmers Ltd is good in
comparison to other organisation.
Liquidity Ratios
Current ratio-
8
tabler-icon-diamond-filled.svg

Paraphrase This Document

Need a fresh take? Get an instant paraphrase of this document with our AI Paraphraser
Document Page
Illustration 5: Current ratio
Current ratio should be 2:1 implying that short-term obligations can be managed in a
proper way. It can be analysed that current ratio of Myer Holdings Ltd was 1, 0.92, 0.88 in
2015,2016,2017 respectively. On the other hand, Wesfarmers Ltd had 0.93 in last three years.
Thus, both firms have low liquidity as it should be 2:1 and hence, they will face difficulties in
paying-off liabilities. It is required that firms maintain higher level of liquidity by which it may
be able to pay obligations which lapse within one-year period.
Quick ratio-
9
Document Page
Illustration 6: Quick ratio
Quick ratio is calculated by liquid assets in which inventory and prepaid expenses are
subtracted and net current assets remains helping in determining firm's position for paying
extreme short-term liabilities. It is measured to determine liquidity position of organisation with
its extreme liquid assets. Myer Holdings Ltd had 0.14 in 2015 and 2016 and 0.10 in last period.
While, Wesfarmers Ltd had 0.22, 0.21 in previous years but increased to 0.25 which means that
it has better quick ratio as figure is nearer to 1:1, the ideal quick ratio.
Efficiency Ratios
Inventory turnover ratio-
10
chevron_up_icon
1 out of 23
circle_padding
hide_on_mobile
zoom_out_icon
[object Object]