Assessing Myer's Strategic Overhaul and Performance Monitoring
VerifiedAdded on 2020/05/11
|18
|3520
|94
AI Summary
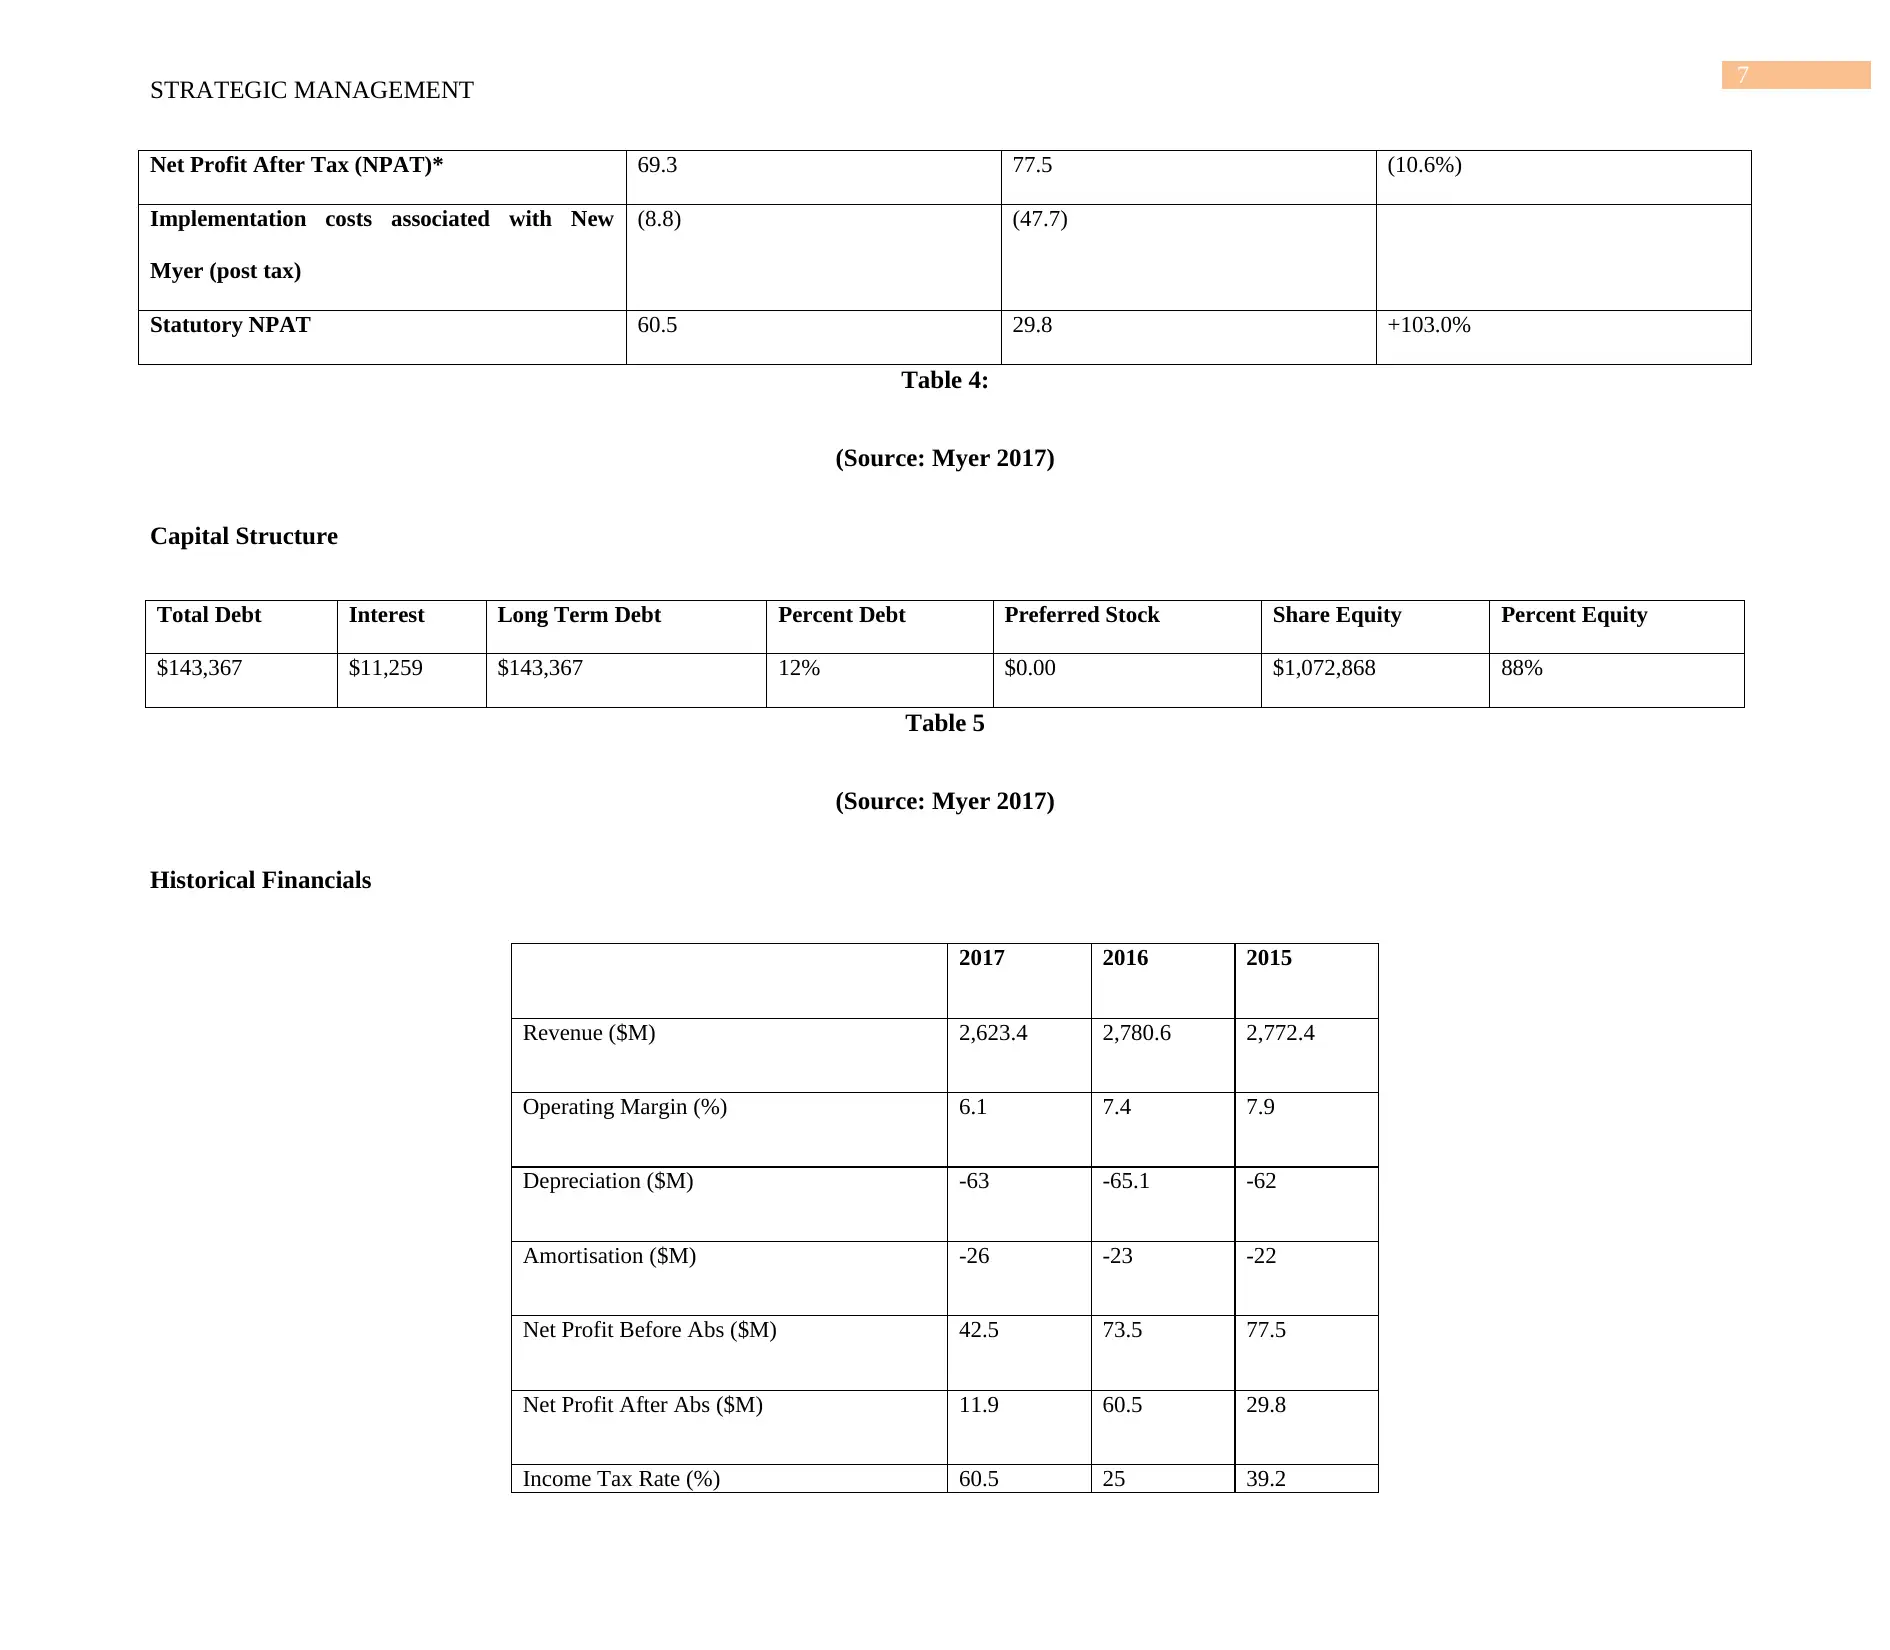
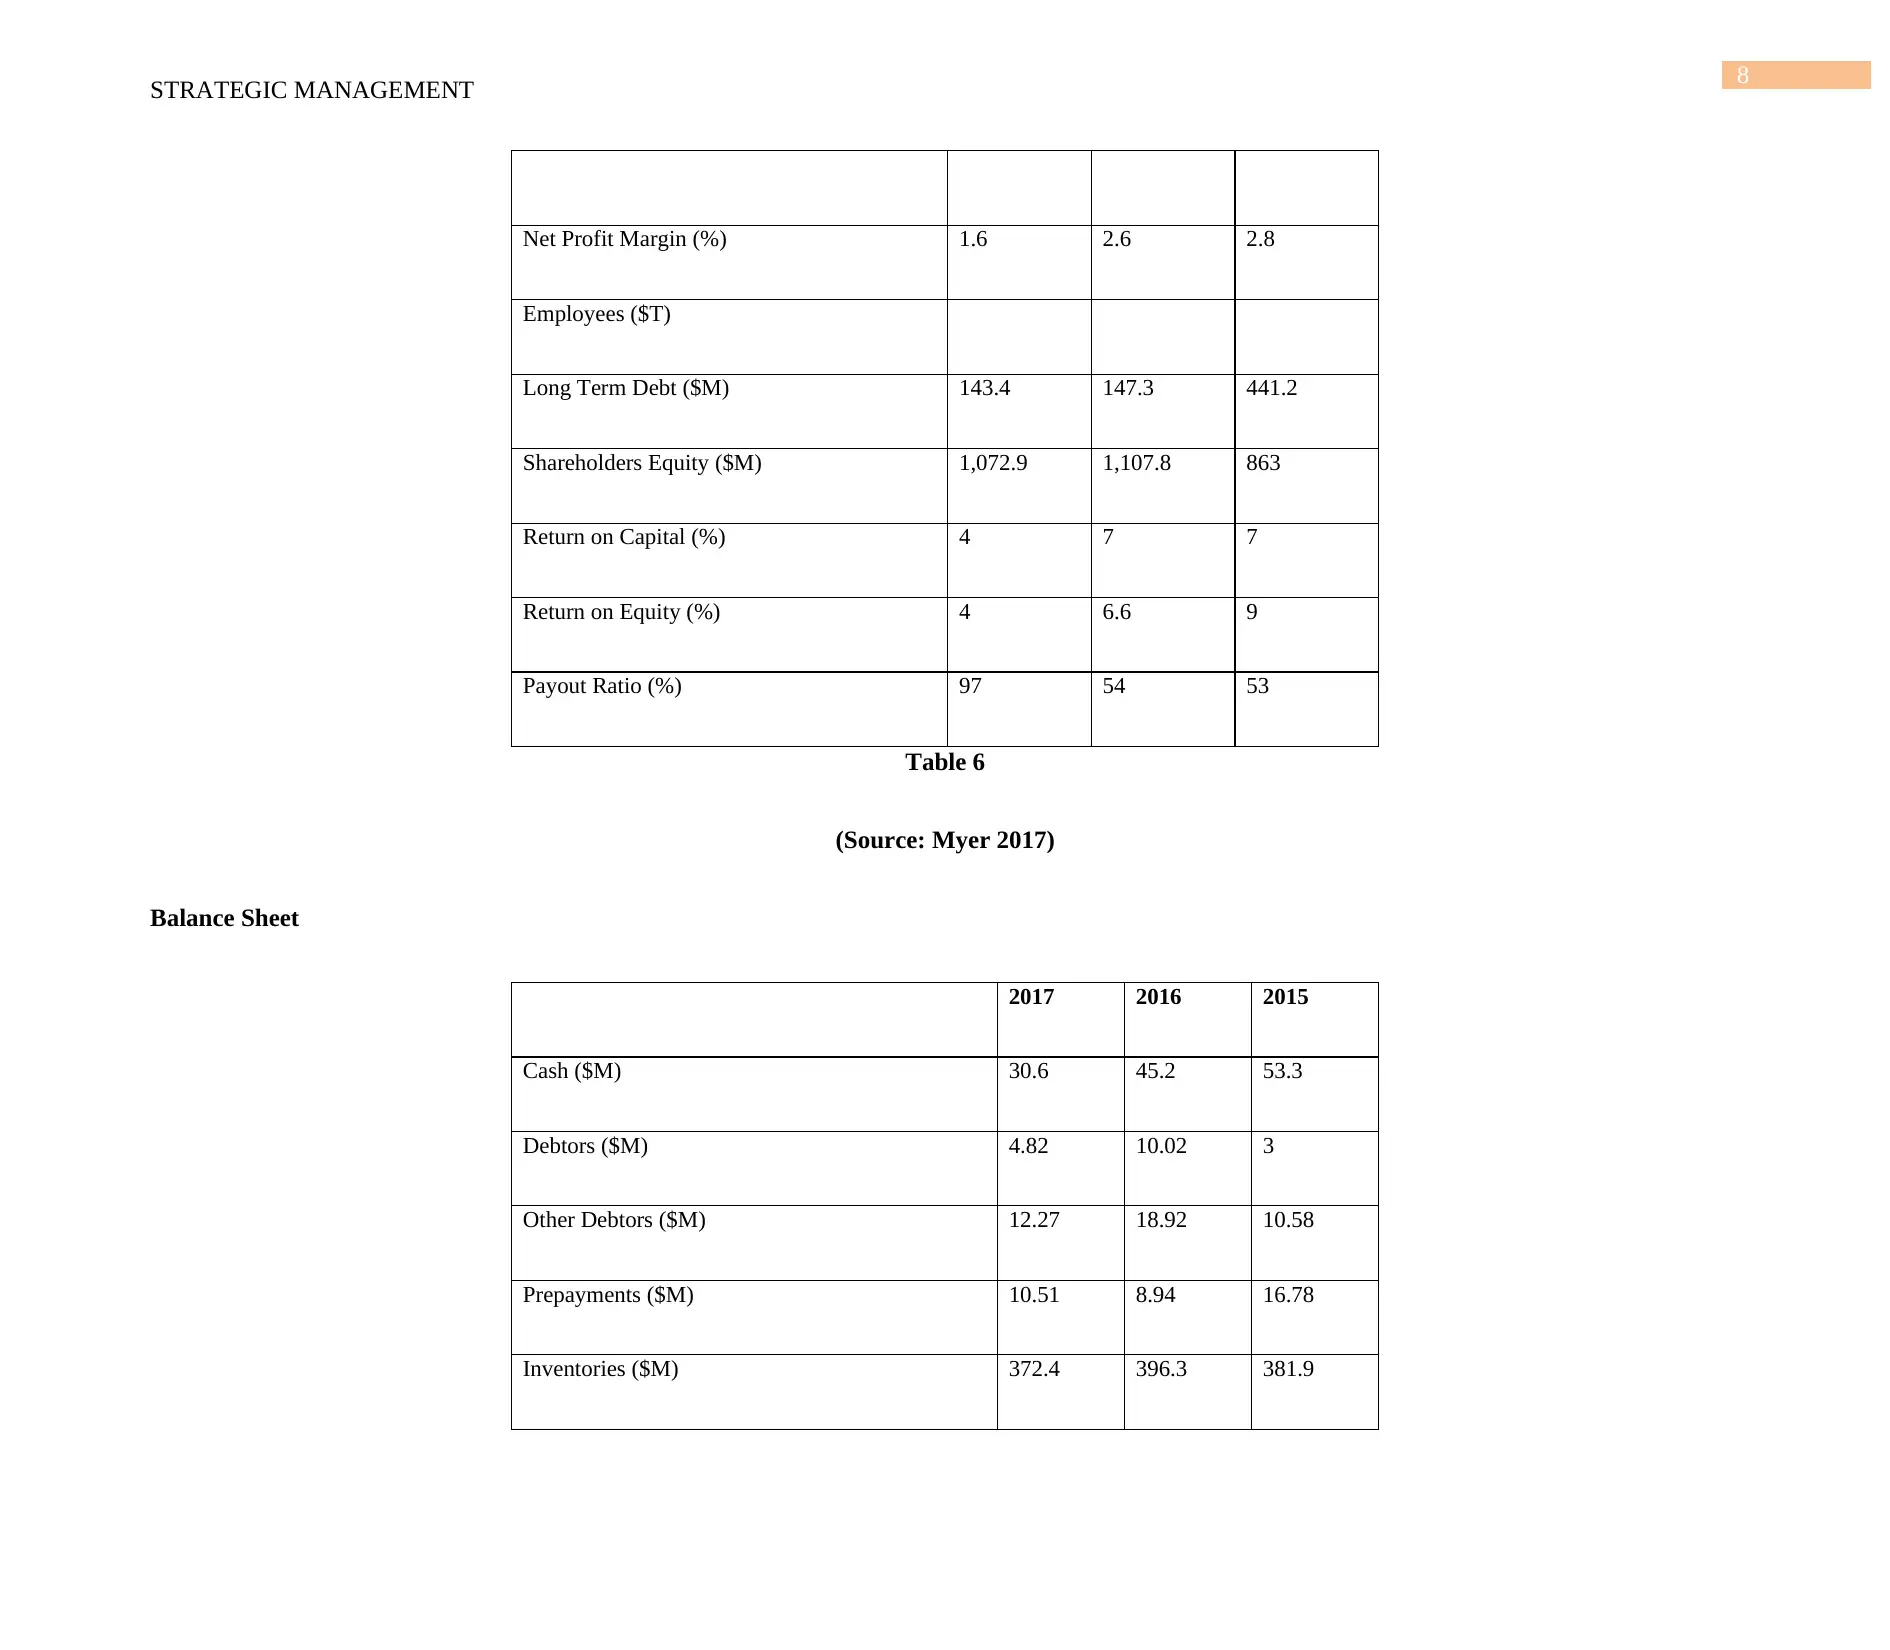
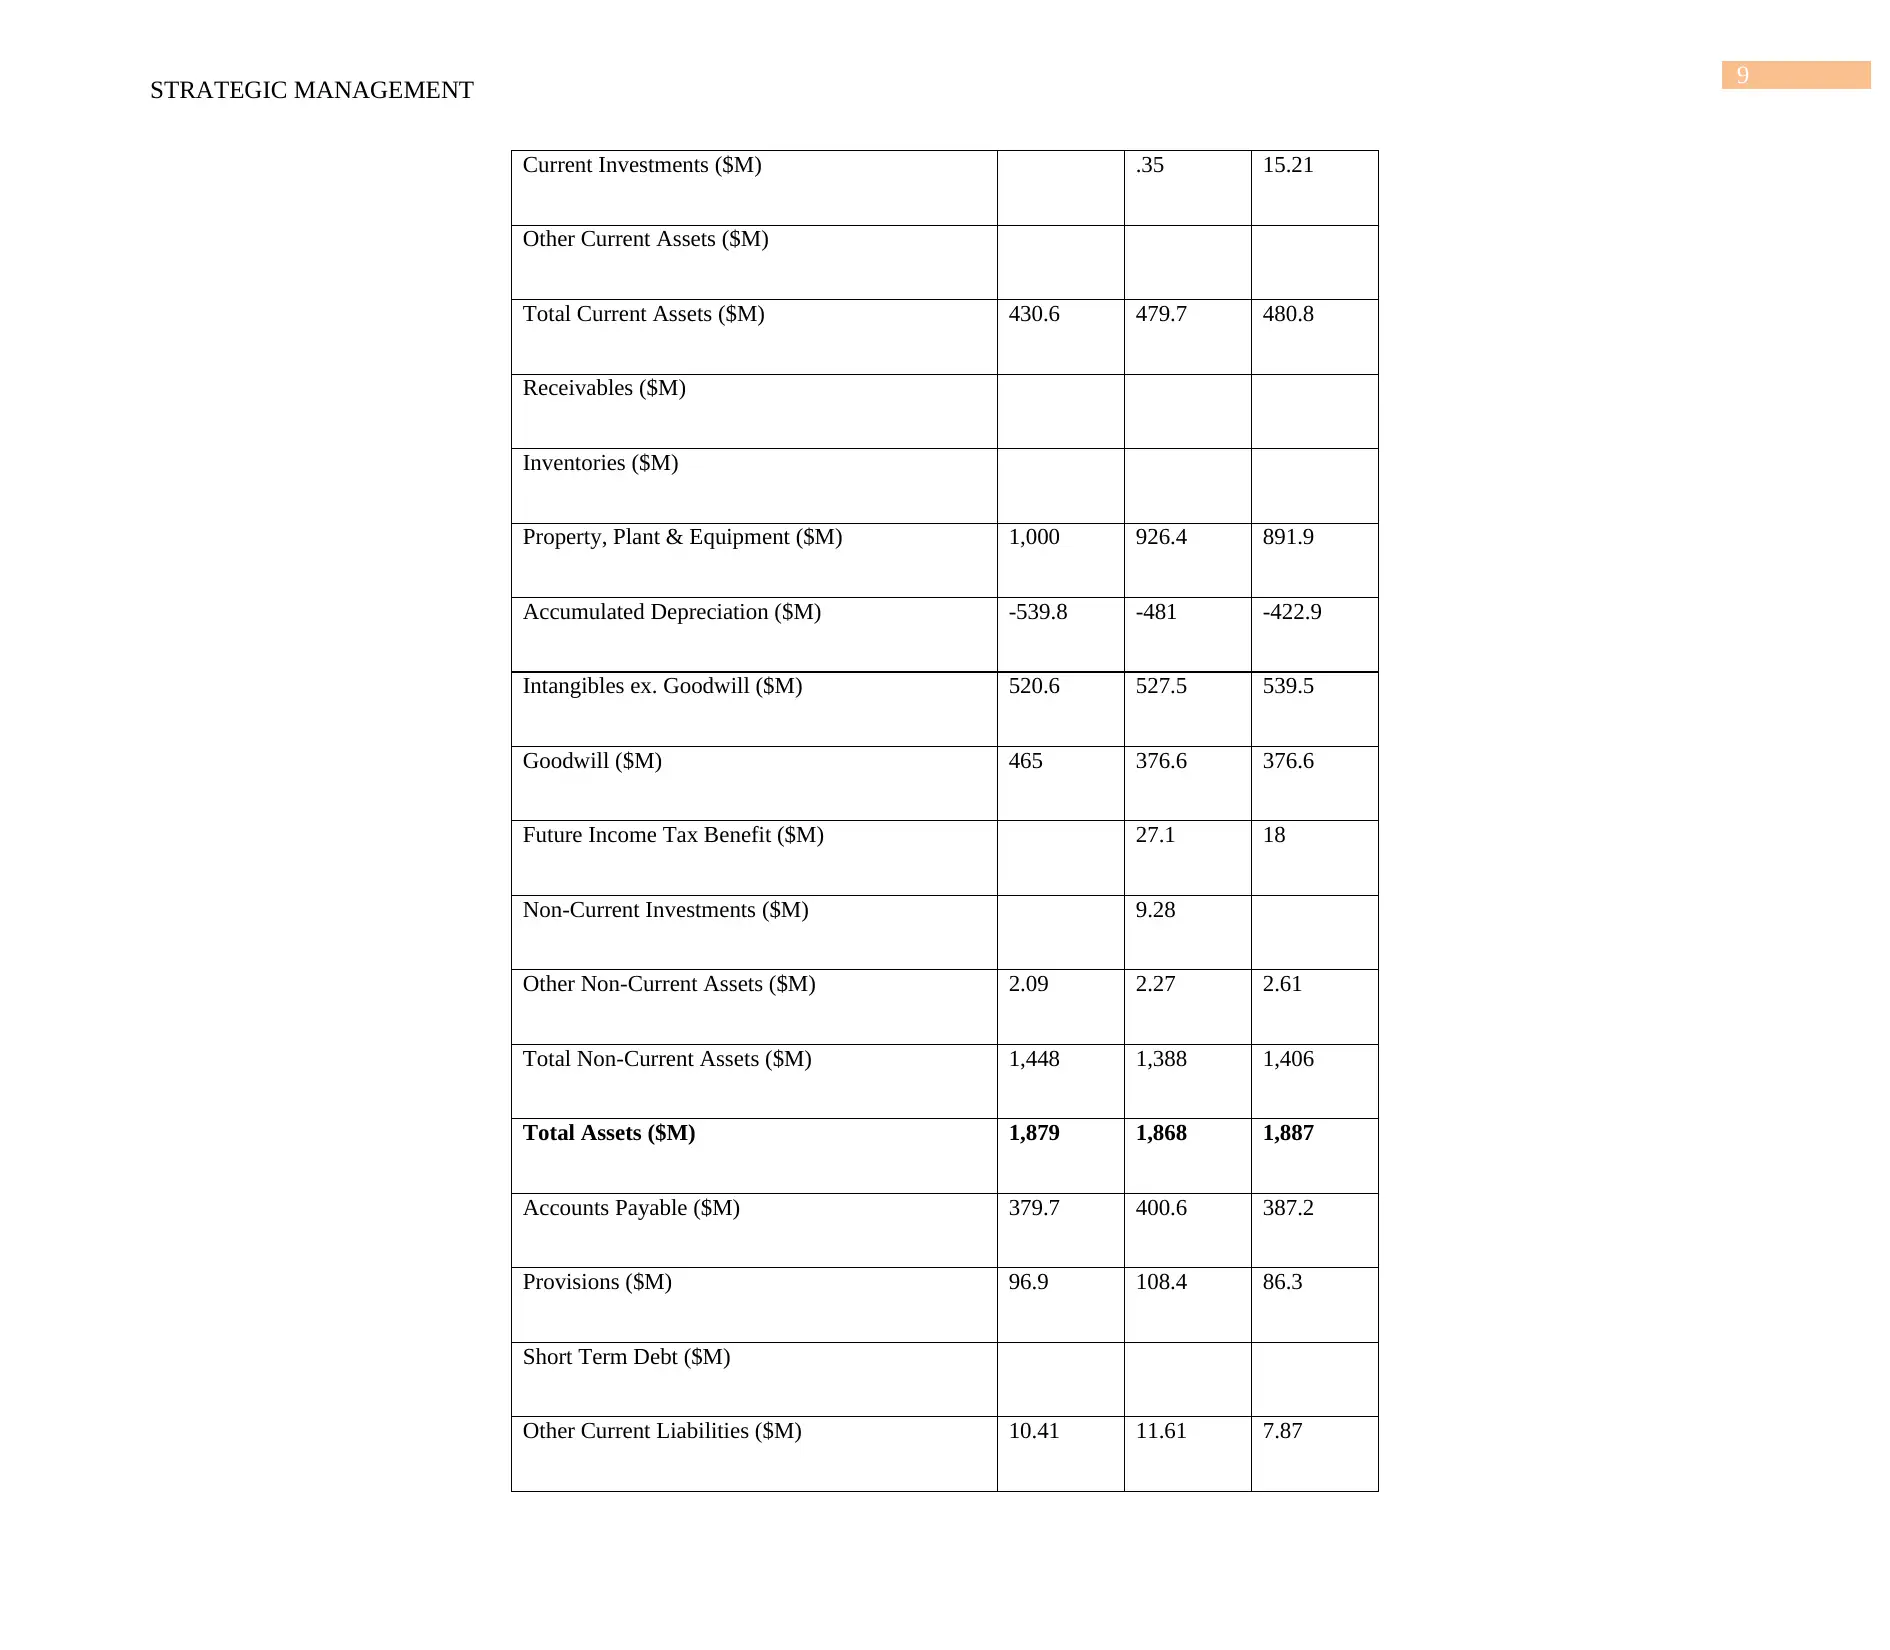
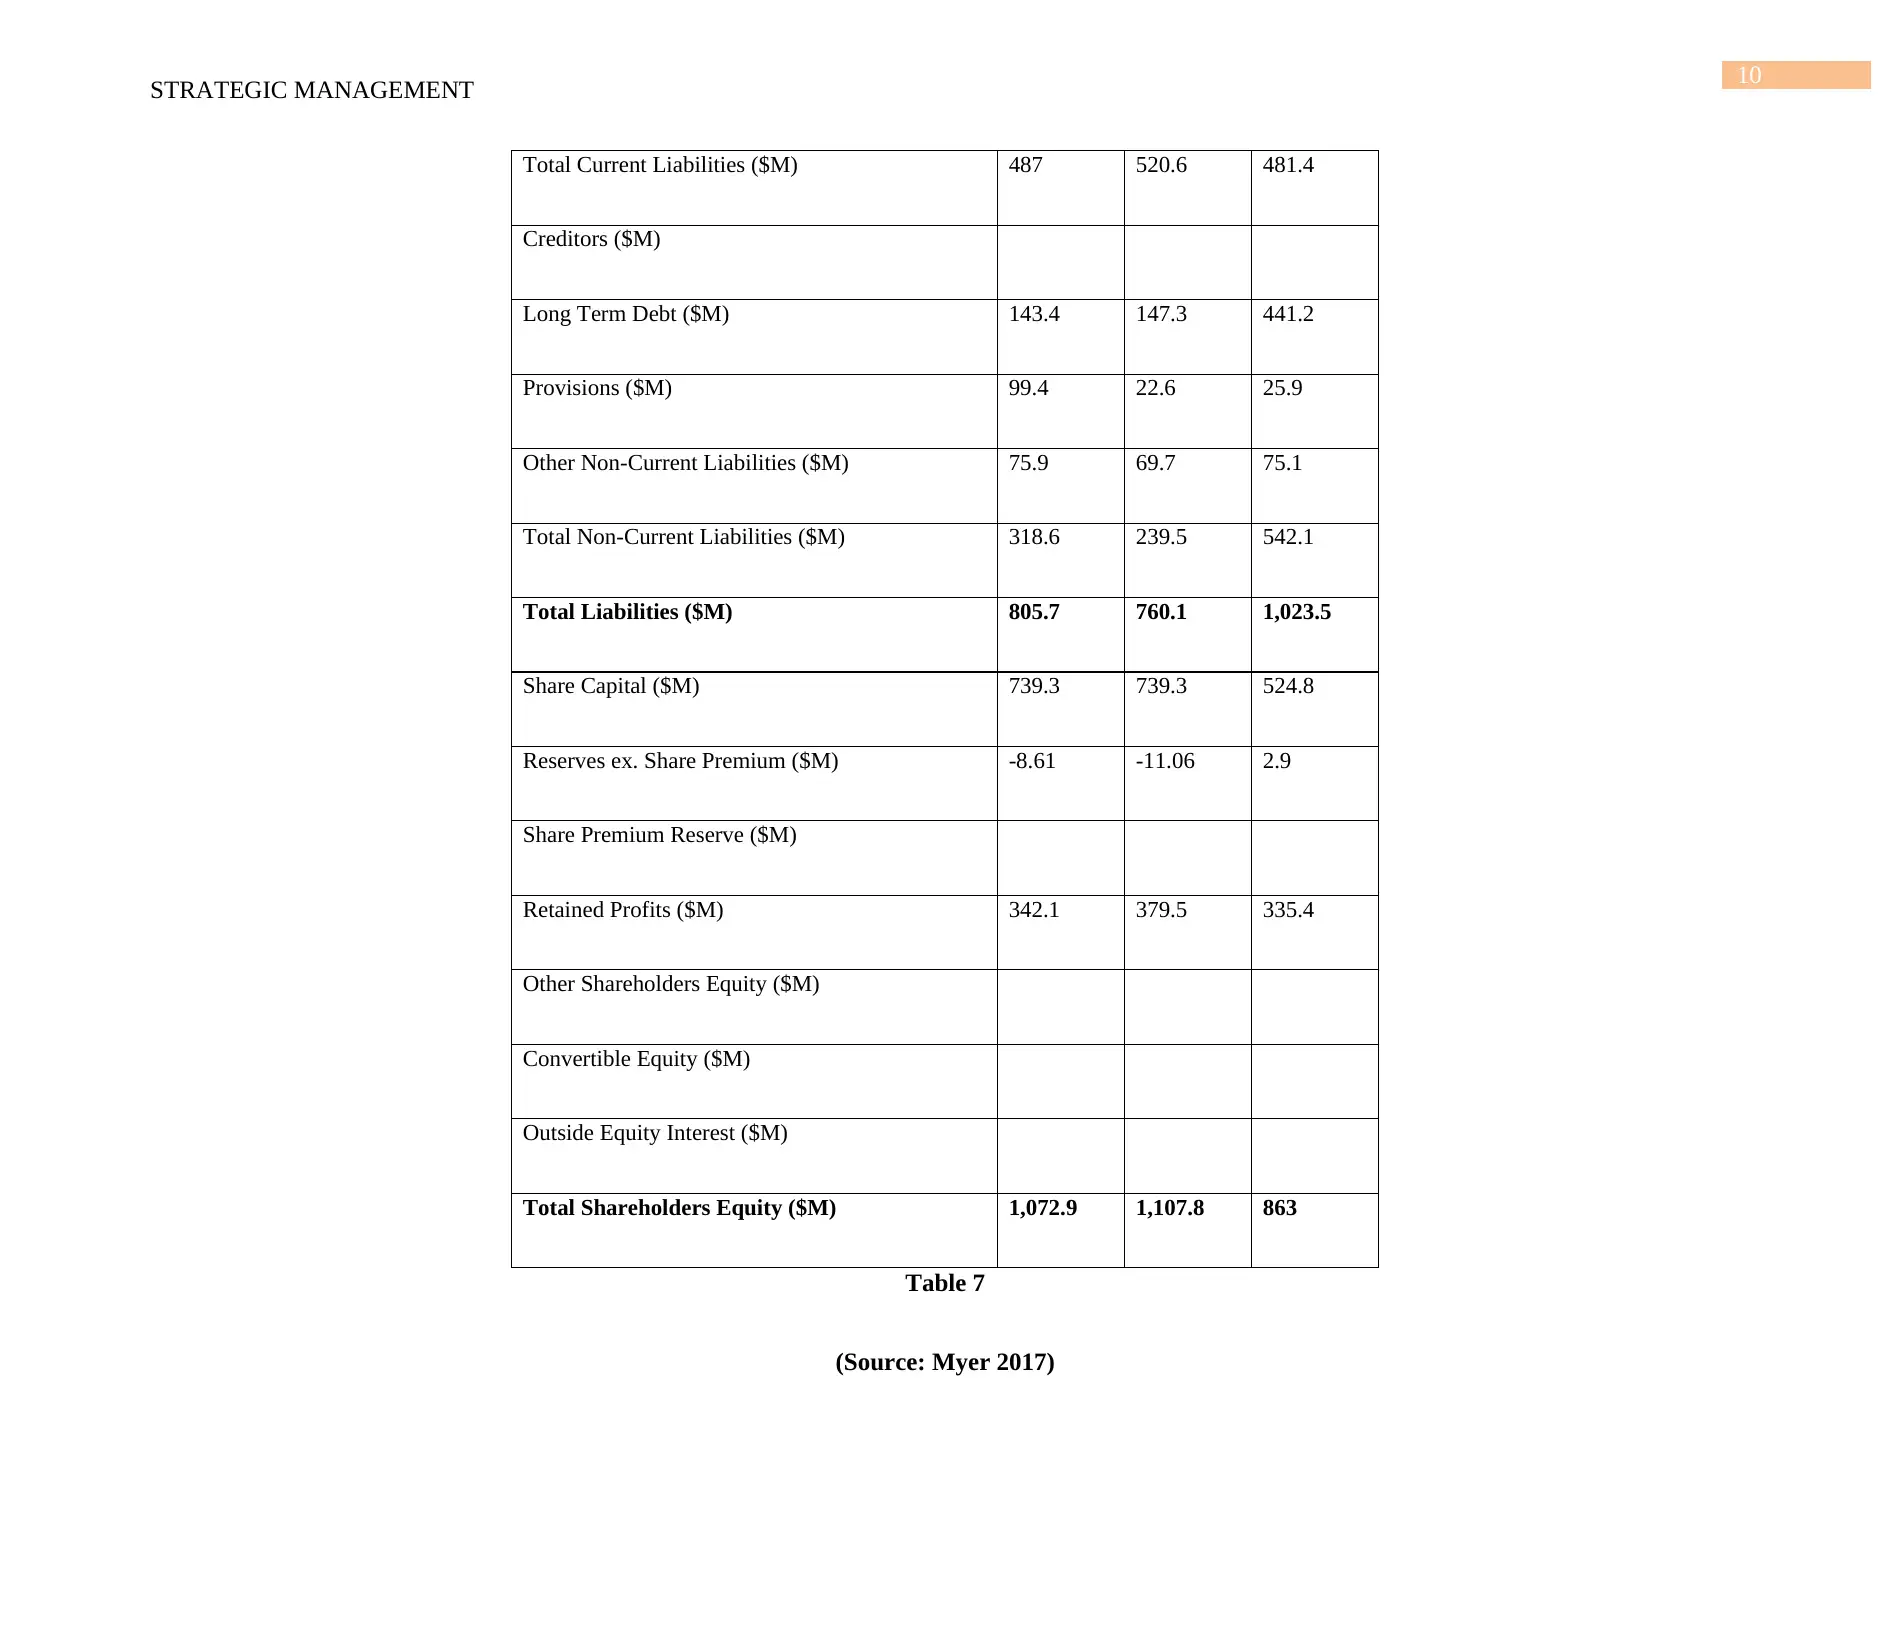
This analysis delves into the recent strategic changes made by Myer, a prominent Australian department store chain, with an aim to strengthen its market position amidst intense competition. The focus is on understanding how these strategies are designed to enhance Myer's consumer base and overall performance in the retail industry. Despite formulating effective strategies, the company faces challenges in their implementation, as evidenced by financial data showing declines in sales and profits. The analysis highlights that overcoming these challenges requires rigorous execution of the planned strategies coupled with continuous monitoring and control over organizational processes. By doing so, Myer can ensure sustainable growth and a stronger competitive advantage in the market. The assignment references key insights from strategic management literature to support its findings.

STRATEGIC MANAGEMENT
Strategic management
Name of the student
Name of the university
Author note
Strategic management
Name of the student
Name of the university
Author note
Paraphrase This Document
Need a fresh take? Get an instant paraphrase of this document with our AI Paraphraser

1
STRATEGIC MANAGEMENT
Executive Summary
This report would be including the strategic recommendation plan of the organization named
Myers which is a chain of departmental stores in Australia. The target consumers for the
organizations belong to the mid-to-up market. The product portfolio of the organization is
diverse and consists of the various segments such as men, children and women clothing,
accessories and footwear, fragrance and cosmetics and various other products. They are also the
owner of the designer womenswear brand, Sass & Bide. Myer is the largest departmental store in
Australia in terms of the number of store count and the revenue that has been generated. David
Jones is the market competitor of the organization. Thus, it can be concluded that Myer is using
effective strategies to improve their consumer base and gain competitive advantage in the
market. However, even though the organization was able to formulate the strategies in an
effective way there was lack in the implementation of the strategy. The financial data shows the
dip in the sales and the profits of the organization and this can be overcome by following the
above suggested strategies and proper monitoring and control of the organizational processes.

2
STRATEGIC MANAGEMENT
Table of Contents
Introduction......................................................................................................................................3
Market Size & Trends......................................................................................................................3
Financial and Corporate Performance.............................................................................................5
Strategic Options...........................................................................................................................13
Final Recommended Strategy........................................................................................................14
Implementation of Final Strategy..................................................................................................15
Monitoring and Control of Future Performance............................................................................16
Conclusion.....................................................................................................................................16
References......................................................................................................................................17
⊘ This is a preview!⊘
Do you want full access?
Subscribe today to unlock all pages.

Trusted by 1+ million students worldwide

3
STRATEGIC MANAGEMENT
Introduction
This report would be including the strategic recommendation plan of the organization
named Myers which is a chain of departmental stores in Australia. The target consumers for the
organizations belong to the mid-to-up market. The product portfolio of the organization is
diverse and consists of the various segments such as men, children and women clothing,
accessories and footwear, fragrance and cosmetics and various other products. They are also the
owner of the designer womenswear brand, Sass & Bide. Myer is the largest departmental store in
Australia in terms of the number of store count and the revenue that has been generated. David
Jones is the market competitor of the organization. The organization has successfully welcomed
the customers into their amazing department store, making sure they are offering world class
services and merchandise to them. Today also, they are successfully continuing their legacy born
of history, being Australia’s most favorite department store (Myer 2017). In 2016 the company
was able to generate a total revenue of $2,808,557,000, which included sales and other revenue
forms too. They have an employee strength of 12500 in Australia, which includes employees
from all their subsidiaries that are directly under the control of the organization
(Ibisworld.com.au 2017).
Market Size & Trends
Inside the department stores industry, the operators have been struggling for the last five
years because of the weak retail environment and the low levels of consumer sentimentality,
which has resulted in the instability of the global fiscal markets. Consumers have turned out to
be largely price conscious and they have started becoming reluctant in spending their
discretionary income in place of putting preference of paying down debt and boosting their
Paraphrase This Document
Need a fresh take? Get an instant paraphrase of this document with our AI Paraphraser

4
STRATEGIC MANAGEMENT
savings levels. It is expected that the industry revenue would be falling at an annualized 0.9%
across the five years through 2017-18, rounding off to a total of $18.3 billion (Ibisworld.com.au
2017). In 2016, Myer has been able to deliver a Net Profit After Tax of $69.3 million, all in line
with their guidance to the market.
Myer has stores across 60 prime retail locations all over Australia. Their stores are visited
more than 130 million times every year by the customers, with a little help from their loyalty
program that has more than five million members. The brand is known for providing fresh, re-
energized and relevant range of products and bettered services, with the ever present superior in-
store experience for their customers and strong omni-channel offering. They have a significant
footprint of stores that get complemented by their well-known brands and get supported by their
online, mobile and digital platforms. Myer is completely focused on the provision of motivation
for their employees and inspiration for their customers, all with the help of their team members,
their 50,000 shareholders, their 1,200 suppliers all over the world and the different communities
they regularly engage with their strong brand presence (Investor.myer.com.au 2017). The Mew
Myer has been constructed on the base of the most desired brands and within just 12 months they
have been able to install new or updated brand destinations and acquired string growth in
concession sales.

5
STRATEGIC MANAGEMENT
Financial and Corporate Performance
General performance
Name Myer Holdings Limited
Stock Code MYR
Website http://www.myer.com.au
GICS Sub-Industry Department Stores
Market Cap ($M) 612
Equiv. Shares (M) 821
Table 1
(Source: InvestSMART 2017)
Current price data
Current Price $0.745
Open $0.750
High $0.755
Low $0.740
Last Close $0.745
⊘ This is a preview!⊘
Do you want full access?
Subscribe today to unlock all pages.

Trusted by 1+ million students worldwide

6
STRATEGIC MANAGEMENT
Volume 2159366
STRATEGIC MANAGEMENT
Volume 2159366
Paraphrase This Document
Need a fresh take? Get an instant paraphrase of this document with our AI Paraphraser

6
STRATEGIC MANAGEMENT
Price Movement - ( No change )
Table 2
(Source: InvestSMART 2017)
Per Share
Year to Jun Sales Cashflow Earnings Dividends Franking Book Value Average
Annual P/E
Relative P/E Shareholder Return
2017 $3.19 18.2 ¢ 5.2 ¢ 5 ¢ 100% $1.31 22.2% 140.5% -40.2%
2016 $3.53 19 ¢ 9.3 ¢ 5 ¢ 100% $1.35 11.6% 69% 15.1%
2015 $4.43 15.5 ¢ 12.4 ¢ 6.6 ¢ 100% $1.38 12.5% 79.5% -40.2%
Table 3
(Source: InvestSMART 2017)
FINANCIAL SUMMARY ($M) FY2016 FY2015 Change
Total Sales 3,289.6 3,195.6 +2.9%
Operating Gross Profit 1,274.3 1,290.4 (1.2%)
Operating Gross Profit margin 38.7% 40.4% (164bps)
Cost of doing business (CODB) (1,068.1) (1,067.2) +0.1%
Earnings before interest, tax, depreciation,
amortization (EBITDA)*
206.2 223.2 (7.6%)
Earnings before interest and tax (EBIT)* 113.5 133.5 (15.0%)

7
STRATEGIC MANAGEMENT
Net Profit After Tax (NPAT)* 69.3 77.5 (10.6%)
Implementation costs associated with New
Myer (post tax)
(8.8) (47.7)
Statutory NPAT 60.5 29.8 +103.0%
Table 4:
(Source: Myer 2017)
Capital Structure
Total Debt Interest Long Term Debt Percent Debt Preferred Stock Share Equity Percent Equity
$143,367 $11,259 $143,367 12% $0.00 $1,072,868 88%
Table 5
(Source: Myer 2017)
Historical Financials
2017 2016 2015
Revenue ($M) 2,623.4 2,780.6 2,772.4
Operating Margin (%) 6.1 7.4 7.9
Depreciation ($M) -63 -65.1 -62
Amortisation ($M) -26 -23 -22
Net Profit Before Abs ($M) 42.5 73.5 77.5
Net Profit After Abs ($M) 11.9 60.5 29.8
Income Tax Rate (%) 60.5 25 39.2
⊘ This is a preview!⊘
Do you want full access?
Subscribe today to unlock all pages.

Trusted by 1+ million students worldwide

8
STRATEGIC MANAGEMENT
Net Profit Margin (%) 1.6 2.6 2.8
Employees ($T)
Long Term Debt ($M) 143.4 147.3 441.2
Shareholders Equity ($M) 1,072.9 1,107.8 863
Return on Capital (%) 4 7 7
Return on Equity (%) 4 6.6 9
Payout Ratio (%) 97 54 53
Table 6
(Source: Myer 2017)
Balance Sheet
2017 2016 2015
Cash ($M) 30.6 45.2 53.3
Debtors ($M) 4.82 10.02 3
Other Debtors ($M) 12.27 18.92 10.58
Prepayments ($M) 10.51 8.94 16.78
Inventories ($M) 372.4 396.3 381.9
Paraphrase This Document
Need a fresh take? Get an instant paraphrase of this document with our AI Paraphraser

9
STRATEGIC MANAGEMENT
Current Investments ($M) .35 15.21
Other Current Assets ($M)
Total Current Assets ($M) 430.6 479.7 480.8
Receivables ($M)
Inventories ($M)
Property, Plant & Equipment ($M) 1,000 926.4 891.9
Accumulated Depreciation ($M) -539.8 -481 -422.9
Intangibles ex. Goodwill ($M) 520.6 527.5 539.5
Goodwill ($M) 465 376.6 376.6
Future Income Tax Benefit ($M) 27.1 18
Non-Current Investments ($M) 9.28
Other Non-Current Assets ($M) 2.09 2.27 2.61
Total Non-Current Assets ($M) 1,448 1,388 1,406
Total Assets ($M) 1,879 1,868 1,887
Accounts Payable ($M) 379.7 400.6 387.2
Provisions ($M) 96.9 108.4 86.3
Short Term Debt ($M)
Other Current Liabilities ($M) 10.41 11.61 7.87

10
STRATEGIC MANAGEMENT
Total Current Liabilities ($M) 487 520.6 481.4
Creditors ($M)
Long Term Debt ($M) 143.4 147.3 441.2
Provisions ($M) 99.4 22.6 25.9
Other Non-Current Liabilities ($M) 75.9 69.7 75.1
Total Non-Current Liabilities ($M) 318.6 239.5 542.1
Total Liabilities ($M) 805.7 760.1 1,023.5
Share Capital ($M) 739.3 739.3 524.8
Reserves ex. Share Premium ($M) -8.61 -11.06 2.9
Share Premium Reserve ($M)
Retained Profits ($M) 342.1 379.5 335.4
Other Shareholders Equity ($M)
Convertible Equity ($M)
Outside Equity Interest ($M)
Total Shareholders Equity ($M) 1,072.9 1,107.8 863
Table 7
(Source: Myer 2017)
⊘ This is a preview!⊘
Do you want full access?
Subscribe today to unlock all pages.

Trusted by 1+ million students worldwide
1 out of 18
Related Documents

Your All-in-One AI-Powered Toolkit for Academic Success.
+13062052269
info@desklib.com
Available 24*7 on WhatsApp / Email
Unlock your academic potential
Copyright © 2020–2025 A2Z Services. All Rights Reserved. Developed and managed by ZUCOL.