Detailed Analysis of MYOB's Financial Performance: Cash Flow, OCI, Tax
VerifiedAdded on 2024/06/03
|9
|2320
|371
Report
AI Summary
This report provides a detailed financial analysis of MYOB, a software solutions company, focusing on its cash flow statement, other comprehensive income (OCI), and corporate income tax for the period 2015-2017. The cash flow analysis examines operating, investing, and financing activities, highlighting the company's increasing cash flow from operations and significant investments in new product development and company acquisitions. The OCI analysis identifies foreign currency translation reserves as the primary item. The corporate income tax analysis reconciles the calculated tax based on net income with the actual tax paid, accounting for variations due to items excluded in tax computations. The report uses data from MYOB's annual reports to provide a comprehensive overview of the company's financial performance.
Table of Contents
Introduction.................................................................................................................................................2
Critical analysis of Cash flow statement......................................................................................................2
Critical analysis of OCI...............................................................................................................................5
Computation of Corporate Income tax........................................................................................................6
References...................................................................................................................................................9
Paraphrase This Document
Need a fresh take? Get an instant paraphrase of this document with our AI Paraphraser
Introduction
The main purpose of the assignment is to analyse in detail the annual report of a company and
provide comparative analysis on the cash flow statement for the 3 year period from 2015 to
2017. The student then analyse the other comprehensive income aspect of the company, the
various particulars included in the OCI of the annual report and last part is to perform a detailed
analysis on the corporate income tax paid by the company. The organisation which is considered
for the analysis is MYOB, a primary software solutions company which is involved in offering
software solutions to the small and medium sized enterprises on the various area which includes
taxation, accounting system, payroll maintenance etc. The company main clients are the small
and medium sized enterprises which are located in Australia, New Zealand and other Asian
countries. The company offers solutions to its clients through cloud computing and other
software soutions like MYOB Advanaced module, Payroll MYOB, Direct Pay, the company also
offers various other services like taxation filing, payroll management of the employees, GST
computation, record management system of key financial and non-financial information.
Critical analysis of Cash flow statement
.
The cash flow statement shall be considered as a complete account of changes in the accounts
and balance sheet. Attention is primarily focused on money in these sectors. The cash flow
statement can be classified into categories such as cash flow from operations, cash flow from
investing activities, cash flow from financial operations and cash flow operations. train. The
main purpose of the cash flow statement is to provide more information and information on total
revenues and payments over a certain period of time, usually one year. This statement helps the
company understand the company's total liquidity, assesses the solvency from time to time,
predicts future cash flows and seeks resources. The most important components of the cash flow
statement are mainly based on the accounting capabilities that the company has to determine
when comparing revenues and costs. It should be noted that the cash flow statement contains
only the funds and funds that were released. These statements generally exclude a transaction
that does not include money
From the critical analysis of cash flow statement of MYOB it is noted that the cash flow from the
beginning of the period were 61,434,000 in 2017 but in the year 2016 it stood at 36,384,000 and
5,044,000 in 2015. This shows that the cash flow of the business is consistently increasing over
the period of time.
Analysis of cash flow based on the operating activities:
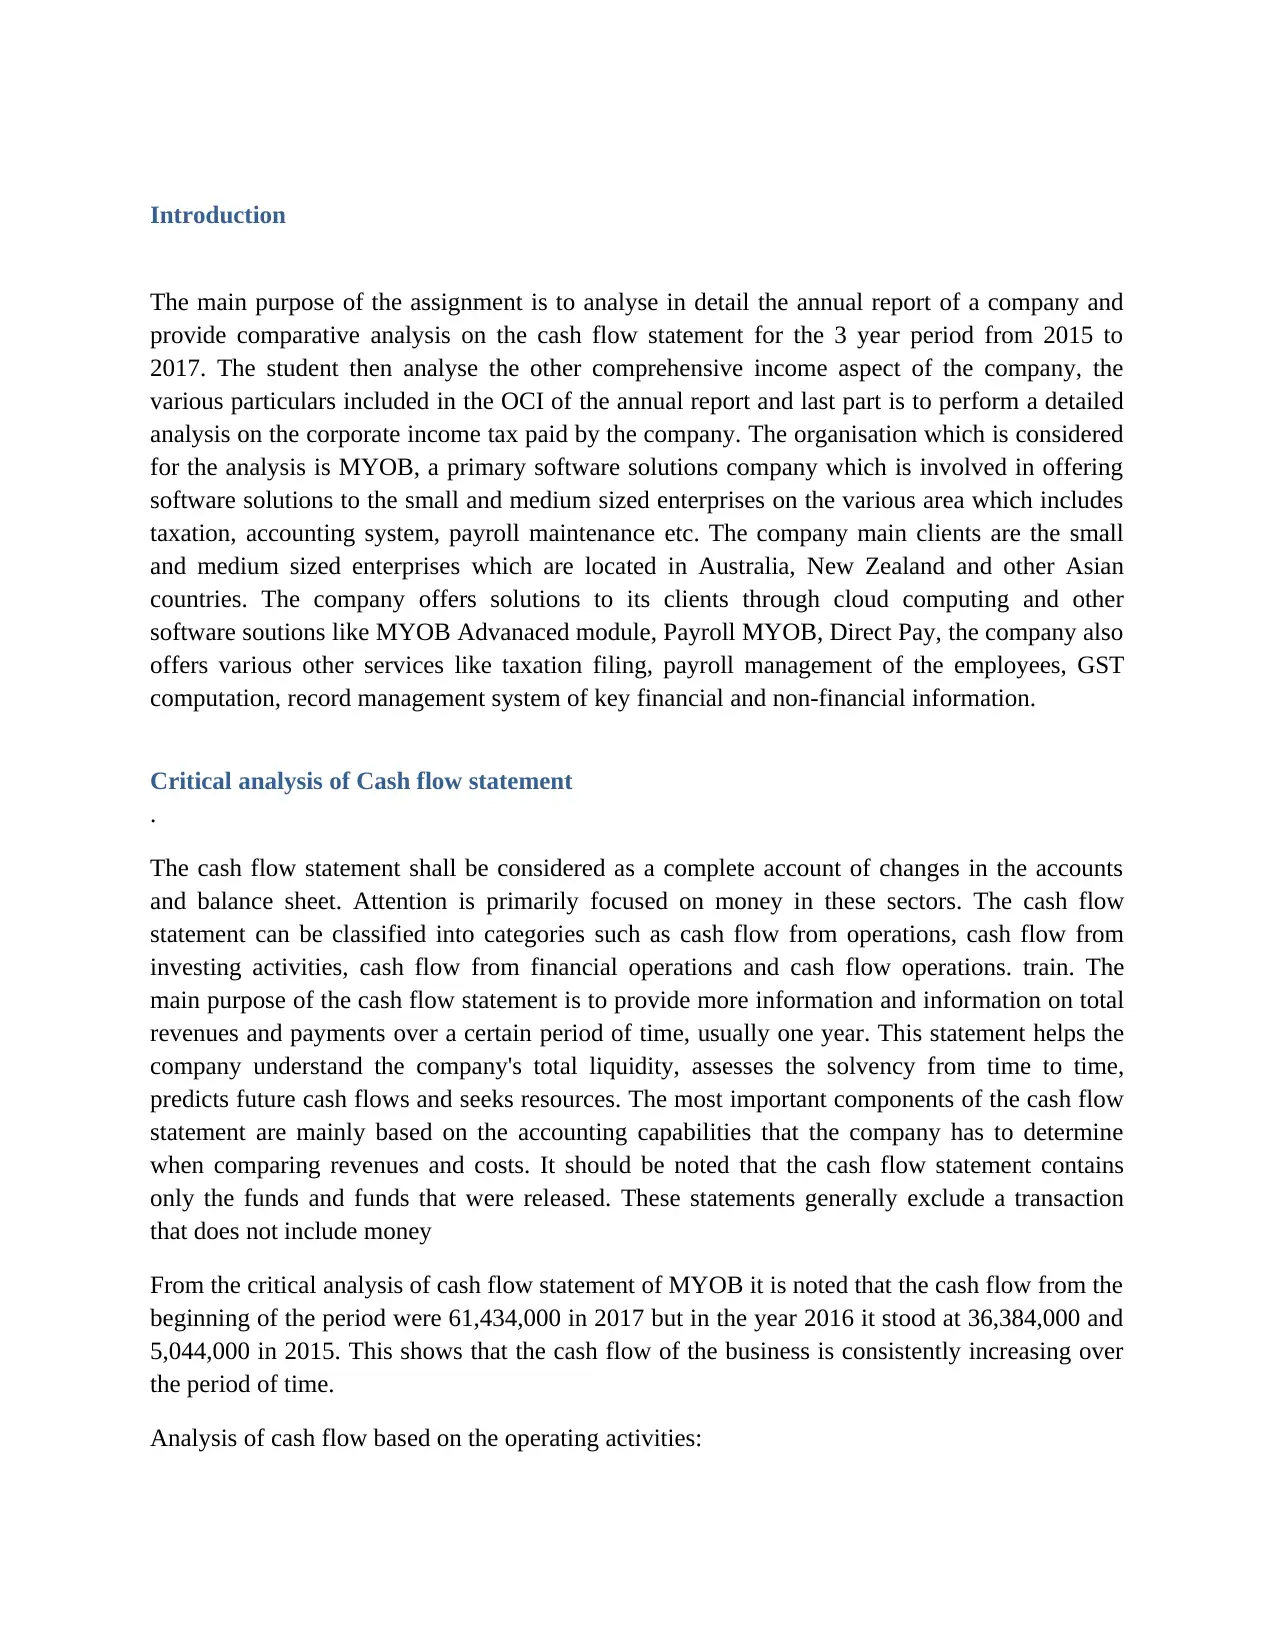
From the annual report of the company it is noted that the net cash flow based on the operating
process was 97,860,000 in 2015 whereas it was 145,833,000 in 2016 and it has grown to
163,919,000 in 2017. This shows that the business has grown to a larger extent in the past three
years.
The cash receipts of the company were at 362,211,000 in 2015, but this has significantly
increased to 406,711,000 in 2016 and 414,224,000 in 2017. Similarly the payments to the
suppliers and others has been made to a level of 213,879,000 in 2015, and this has increased to
246,153,000 in 2016 but due to continuous effort of the management the expenses has been
reduced to 233,781,000 in 2017. The net cash flow from the operating activities were at
97,860,000 in 2015, increased significantly in 2016 and stood at 145,833,000 in 2016 and
increased even further to 163,919,000 in 2017.
2015 2016 2017
Net cash from operating
activities
97,86
0
145,83
3
163,91
9
2015 2016 2017
0
20,000
40,000
60,000
80,000
100,000
120,000
140,000
160,000
180,000
Net cash from operating activities
Net cash from operating
activities
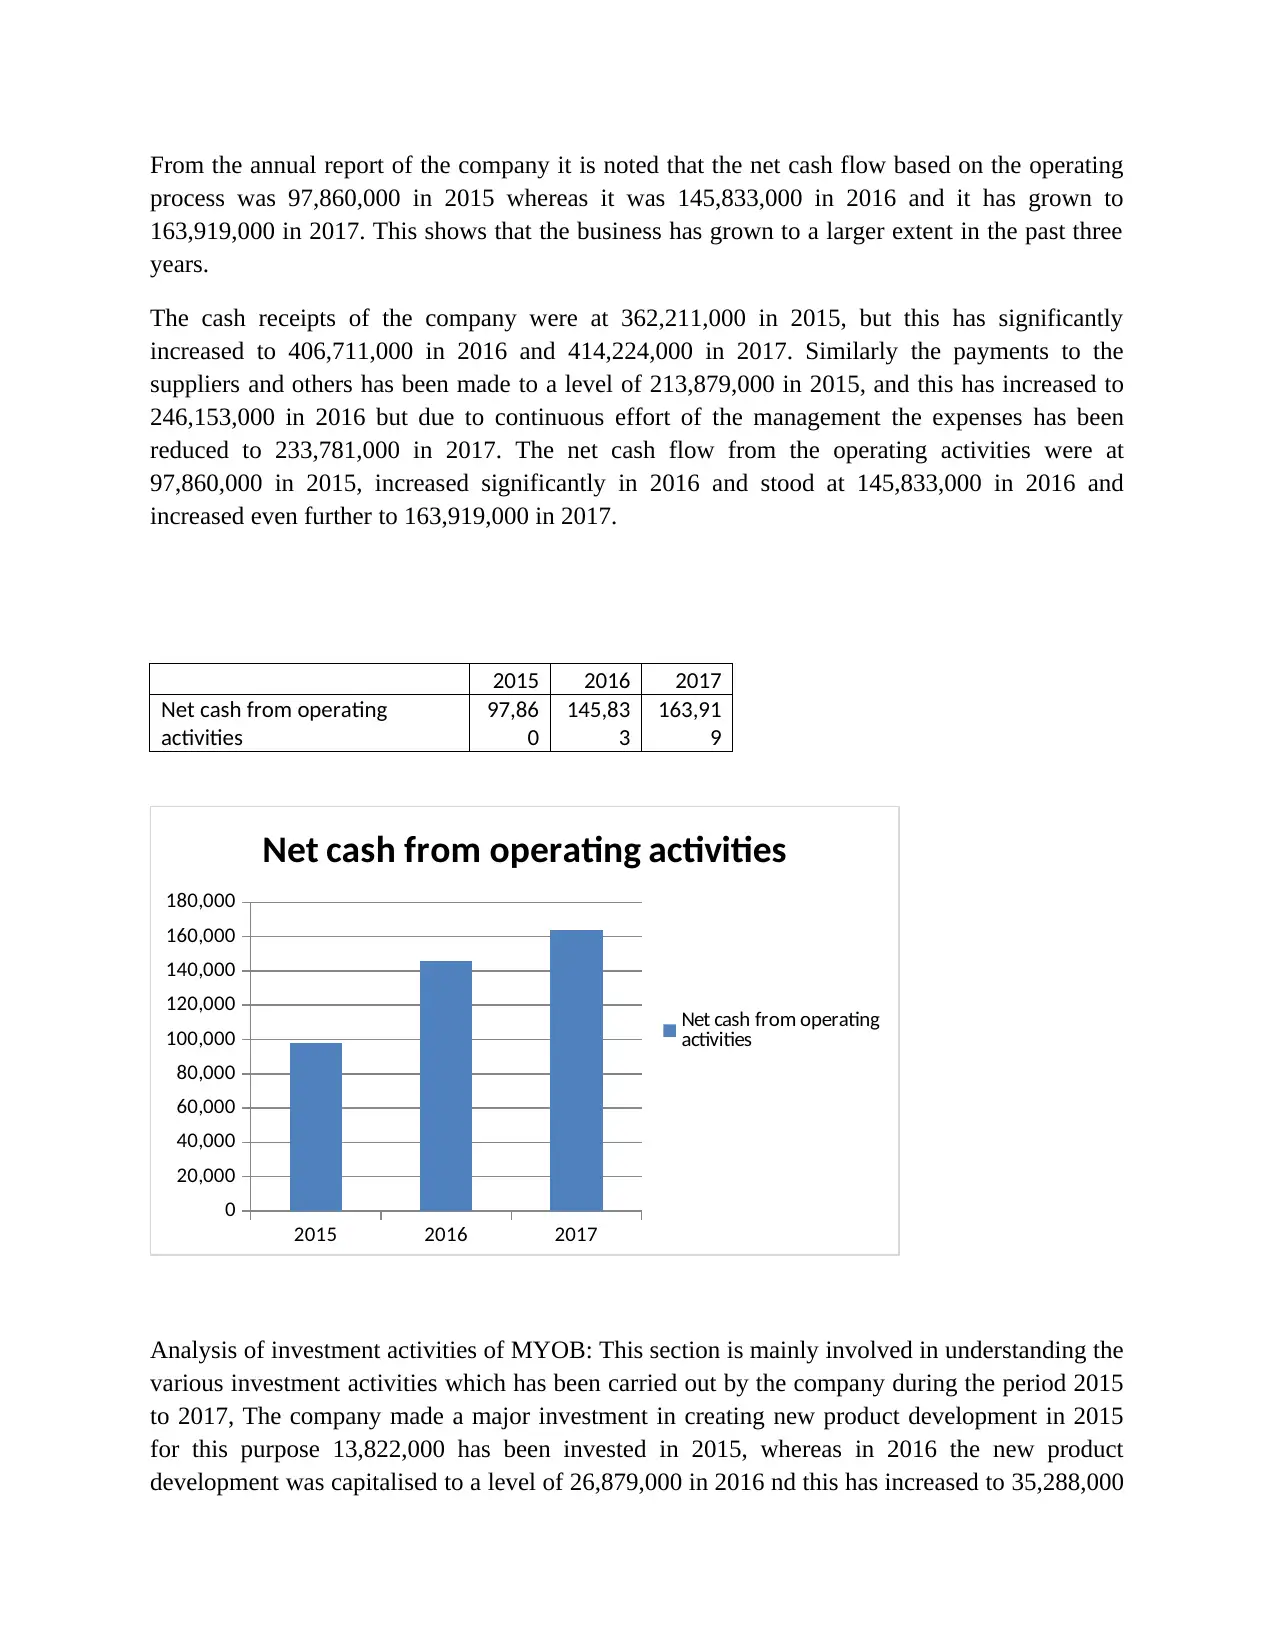
Analysis of investment activities of MYOB: This section is mainly involved in understanding the
various investment activities which has been carried out by the company during the period 2015
to 2017, The company made a major investment in creating new product development in 2015
for this purpose 13,822,000 has been invested in 2015, whereas in 2016 the new product
development was capitalised to a level of 26,879,000 in 2016 nd this has increased to 35,288,000
process was 97,860,000 in 2015 whereas it was 145,833,000 in 2016 and it has grown to
163,919,000 in 2017. This shows that the business has grown to a larger extent in the past three
years.
The cash receipts of the company were at 362,211,000 in 2015, but this has significantly
increased to 406,711,000 in 2016 and 414,224,000 in 2017. Similarly the payments to the
suppliers and others has been made to a level of 213,879,000 in 2015, and this has increased to
246,153,000 in 2016 but due to continuous effort of the management the expenses has been
reduced to 233,781,000 in 2017. The net cash flow from the operating activities were at
97,860,000 in 2015, increased significantly in 2016 and stood at 145,833,000 in 2016 and
increased even further to 163,919,000 in 2017.
2015 2016 2017
Net cash from operating
activities
97,86
0
145,83
3
163,91
9
2015 2016 2017
0
20,000
40,000
60,000
80,000
100,000
120,000
140,000
160,000
180,000
Net cash from operating activities
Net cash from operating
activities
Analysis of investment activities of MYOB: This section is mainly involved in understanding the
various investment activities which has been carried out by the company during the period 2015
to 2017, The company made a major investment in creating new product development in 2015
for this purpose 13,822,000 has been invested in 2015, whereas in 2016 the new product
development was capitalised to a level of 26,879,000 in 2016 nd this has increased to 35,288,000
⊘ This is a preview!⊘
Do you want full access?
Subscribe today to unlock all pages.
Trusted by 1+ million students worldwide
in 2017. Furthermore the company paid 13,160,000 in 2015 for the purchase of new company,
whereas in 2016 the purchase of new companies was 22,820,000 and in 2017 the value of
investment was at 47,545,000 in 2017.
The overall investment made by the company in the year 2015 was 54,605,000, whereas in the
year 2016 it was around 59,031,000 but in 2017 the investment has increased significantly and
was around 101,680,000.
2015 2016 2017
Net cash in investment activities
54,60
5
59,03
1
101,68
0
2015 2016 2017
0
20,000
40,000
60,000
80,000
100,000
120,000
Net cash in investment activities
Net cash in investment
activities
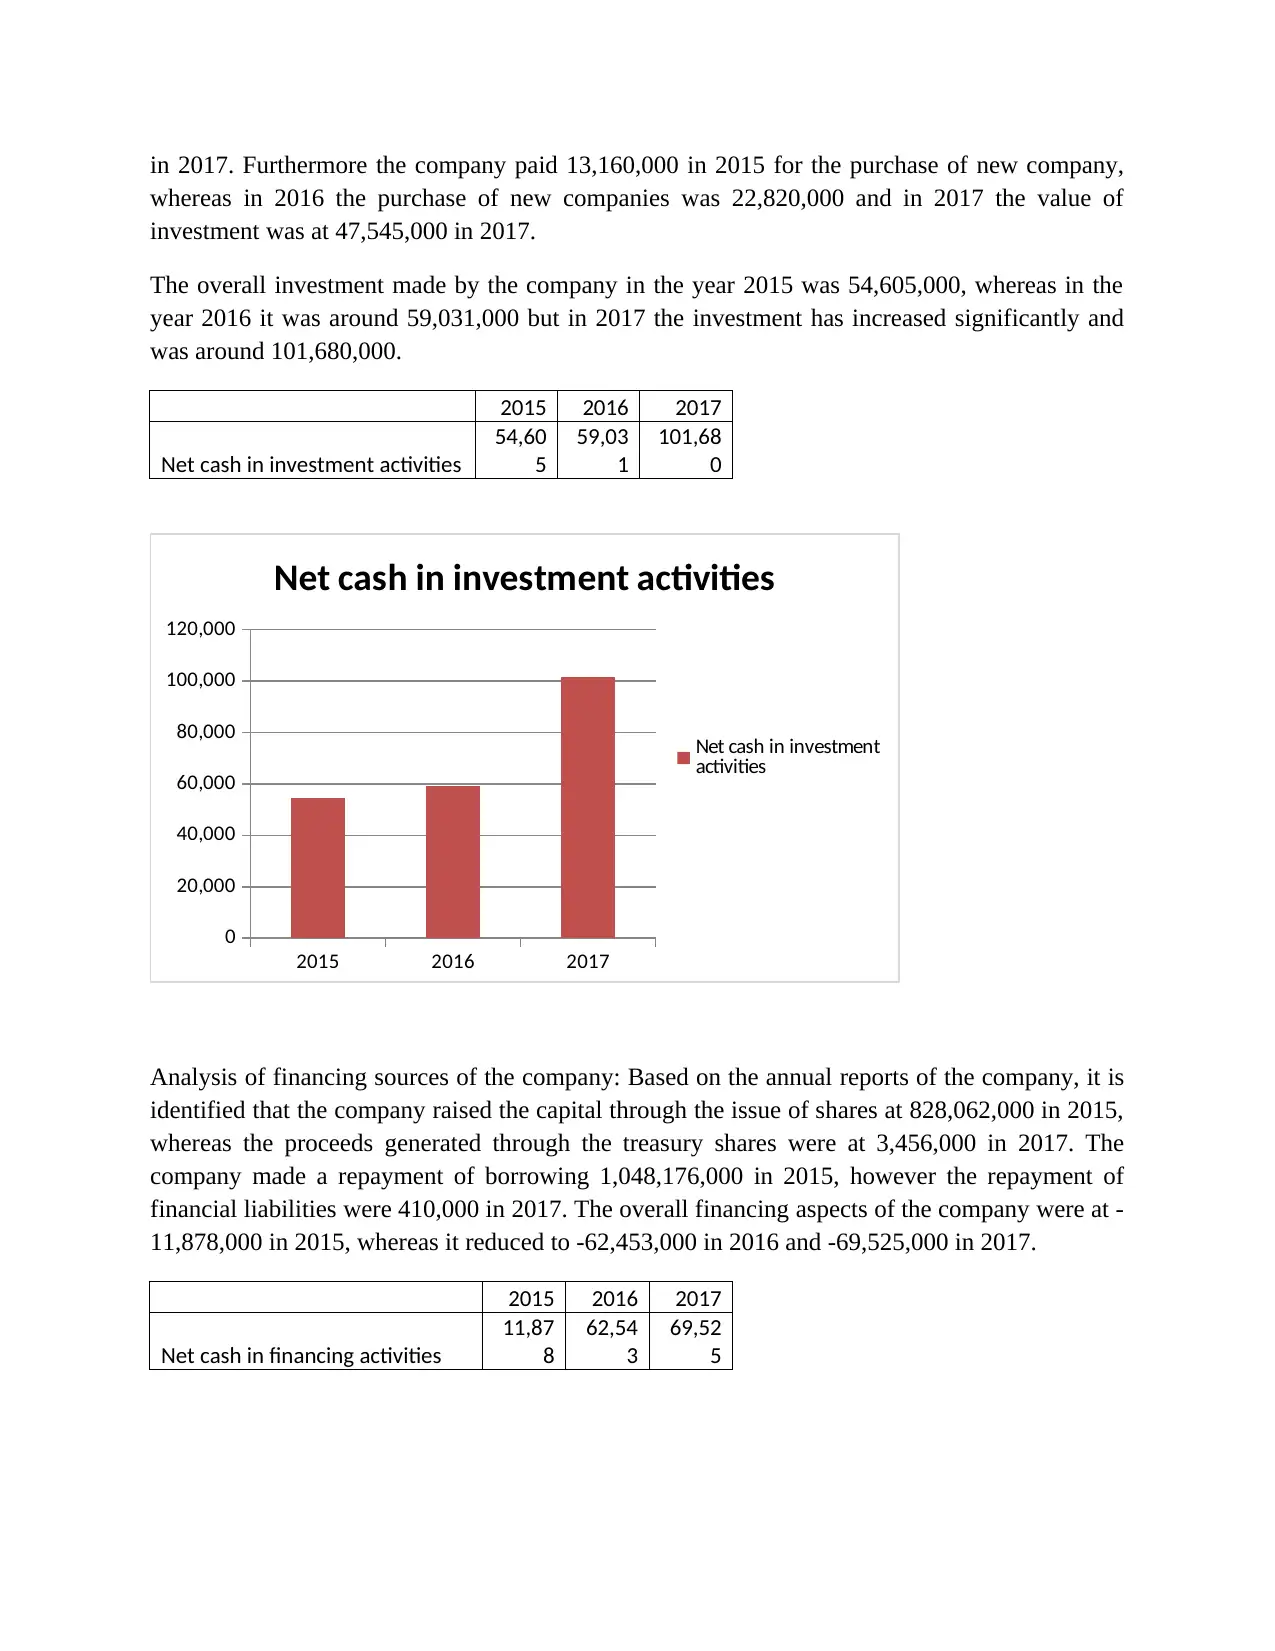
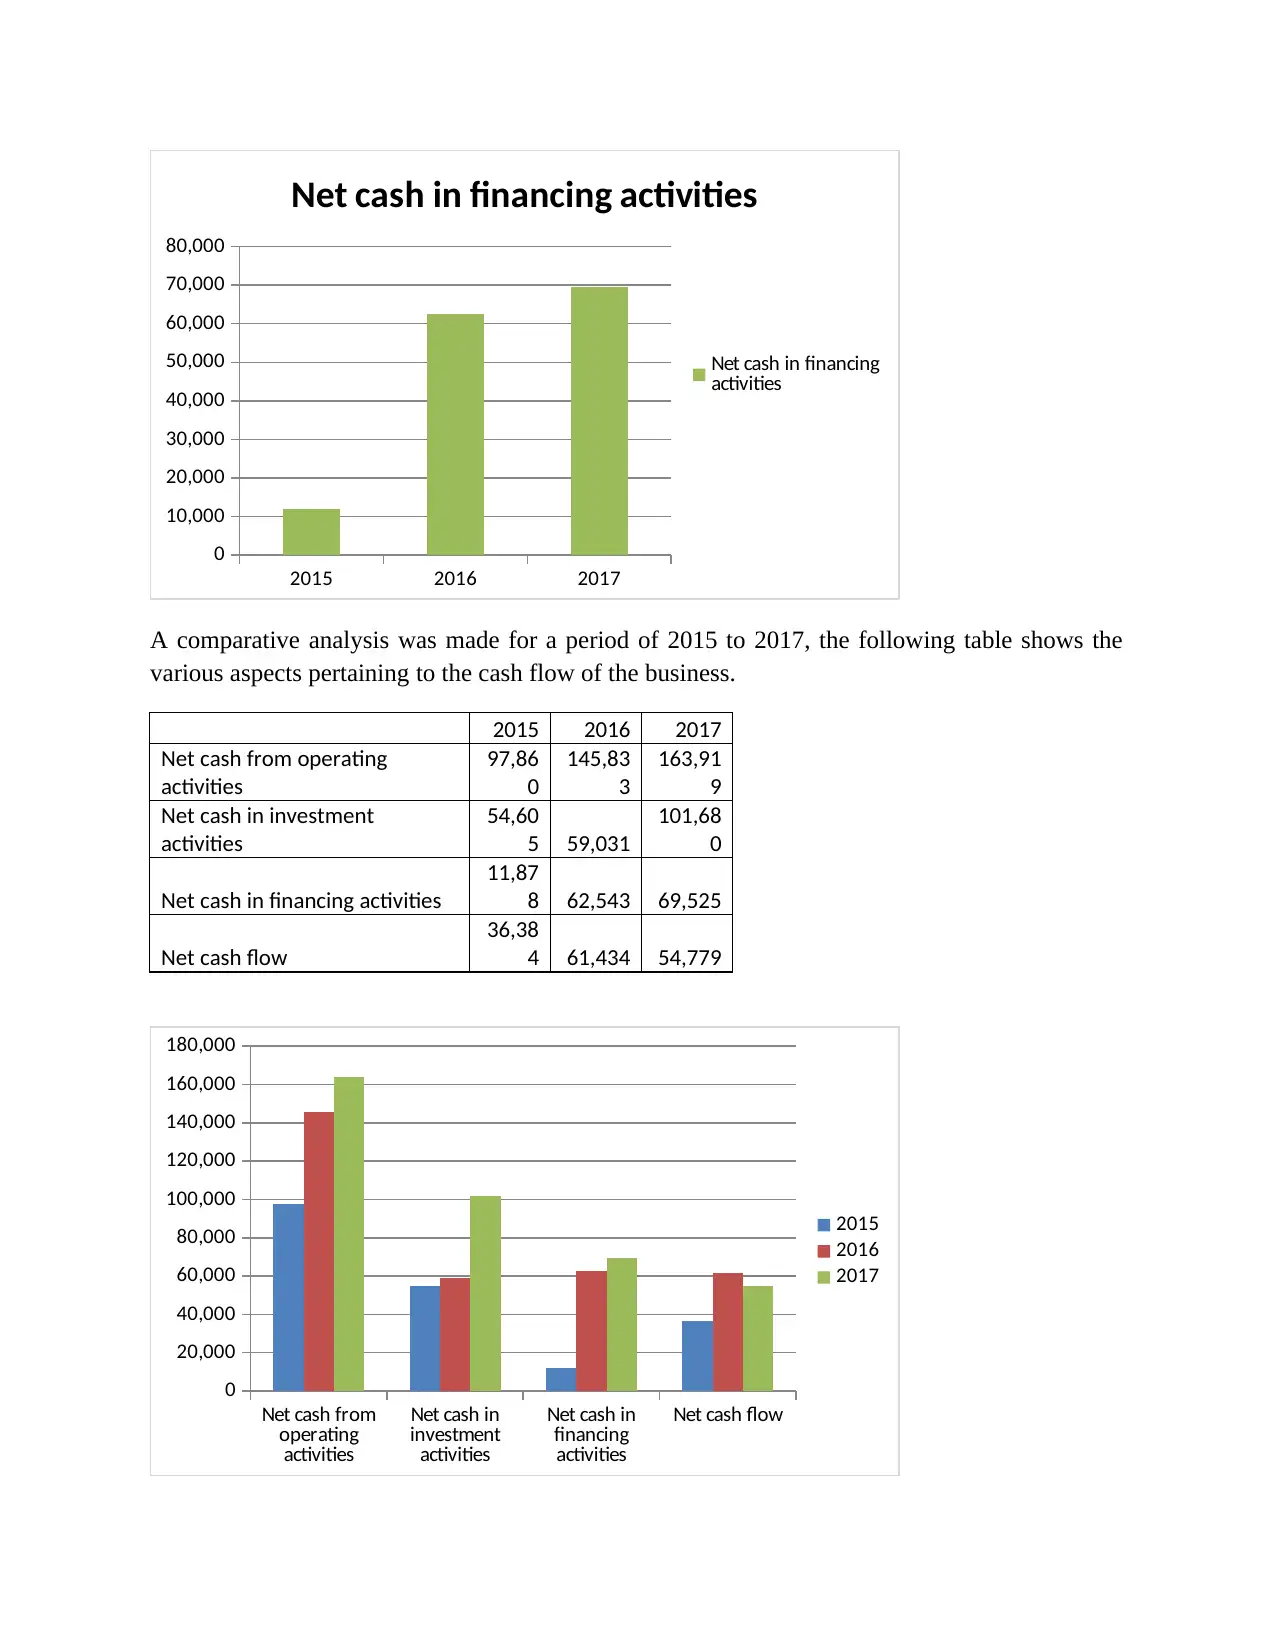
Analysis of financing sources of the company: Based on the annual reports of the company, it is
identified that the company raised the capital through the issue of shares at 828,062,000 in 2015,
whereas the proceeds generated through the treasury shares were at 3,456,000 in 2017. The
company made a repayment of borrowing 1,048,176,000 in 2015, however the repayment of
financial liabilities were 410,000 in 2017. The overall financing aspects of the company were at -
11,878,000 in 2015, whereas it reduced to -62,453,000 in 2016 and -69,525,000 in 2017.
2015 2016 2017
Net cash in financing activities
11,87
8
62,54
3
69,52
5
whereas in 2016 the purchase of new companies was 22,820,000 and in 2017 the value of
investment was at 47,545,000 in 2017.
The overall investment made by the company in the year 2015 was 54,605,000, whereas in the
year 2016 it was around 59,031,000 but in 2017 the investment has increased significantly and
was around 101,680,000.
2015 2016 2017
Net cash in investment activities
54,60
5
59,03
1
101,68
0
2015 2016 2017
0
20,000
40,000
60,000
80,000
100,000
120,000
Net cash in investment activities
Net cash in investment
activities
Analysis of financing sources of the company: Based on the annual reports of the company, it is
identified that the company raised the capital through the issue of shares at 828,062,000 in 2015,
whereas the proceeds generated through the treasury shares were at 3,456,000 in 2017. The
company made a repayment of borrowing 1,048,176,000 in 2015, however the repayment of
financial liabilities were 410,000 in 2017. The overall financing aspects of the company were at -
11,878,000 in 2015, whereas it reduced to -62,453,000 in 2016 and -69,525,000 in 2017.
2015 2016 2017
Net cash in financing activities
11,87
8
62,54
3
69,52
5
Paraphrase This Document
Need a fresh take? Get an instant paraphrase of this document with our AI Paraphraser
2015 2016 2017
0
10,000
20,000
30,000
40,000
50,000
60,000
70,000
80,000
Net cash in financing activities
Net cash in financing
activities
A comparative analysis was made for a period of 2015 to 2017, the following table shows the
various aspects pertaining to the cash flow of the business.
2015 2016 2017
Net cash from operating
activities
97,86
0
145,83
3
163,91
9
Net cash in investment
activities
54,60
5 59,031
101,68
0
Net cash in financing activities
11,87
8 62,543 69,525
Net cash flow
36,38
4 61,434 54,779
Net cash from
operating
activities
Net cash in
investment
activities
Net cash in
financing
activities
Net cash flow
0
20,000
40,000
60,000
80,000
100,000
120,000
140,000
160,000
180,000
2015
2016
2017
0
10,000
20,000
30,000
40,000
50,000
60,000
70,000
80,000
Net cash in financing activities
Net cash in financing
activities
A comparative analysis was made for a period of 2015 to 2017, the following table shows the
various aspects pertaining to the cash flow of the business.
2015 2016 2017
Net cash from operating
activities
97,86
0
145,83
3
163,91
9
Net cash in investment
activities
54,60
5 59,031
101,68
0
Net cash in financing activities
11,87
8 62,543 69,525
Net cash flow
36,38
4 61,434 54,779
Net cash from
operating
activities
Net cash in
investment
activities
Net cash in
financing
activities
Net cash flow
0
20,000
40,000
60,000
80,000
100,000
120,000
140,000
160,000
180,000
2015
2016
2017
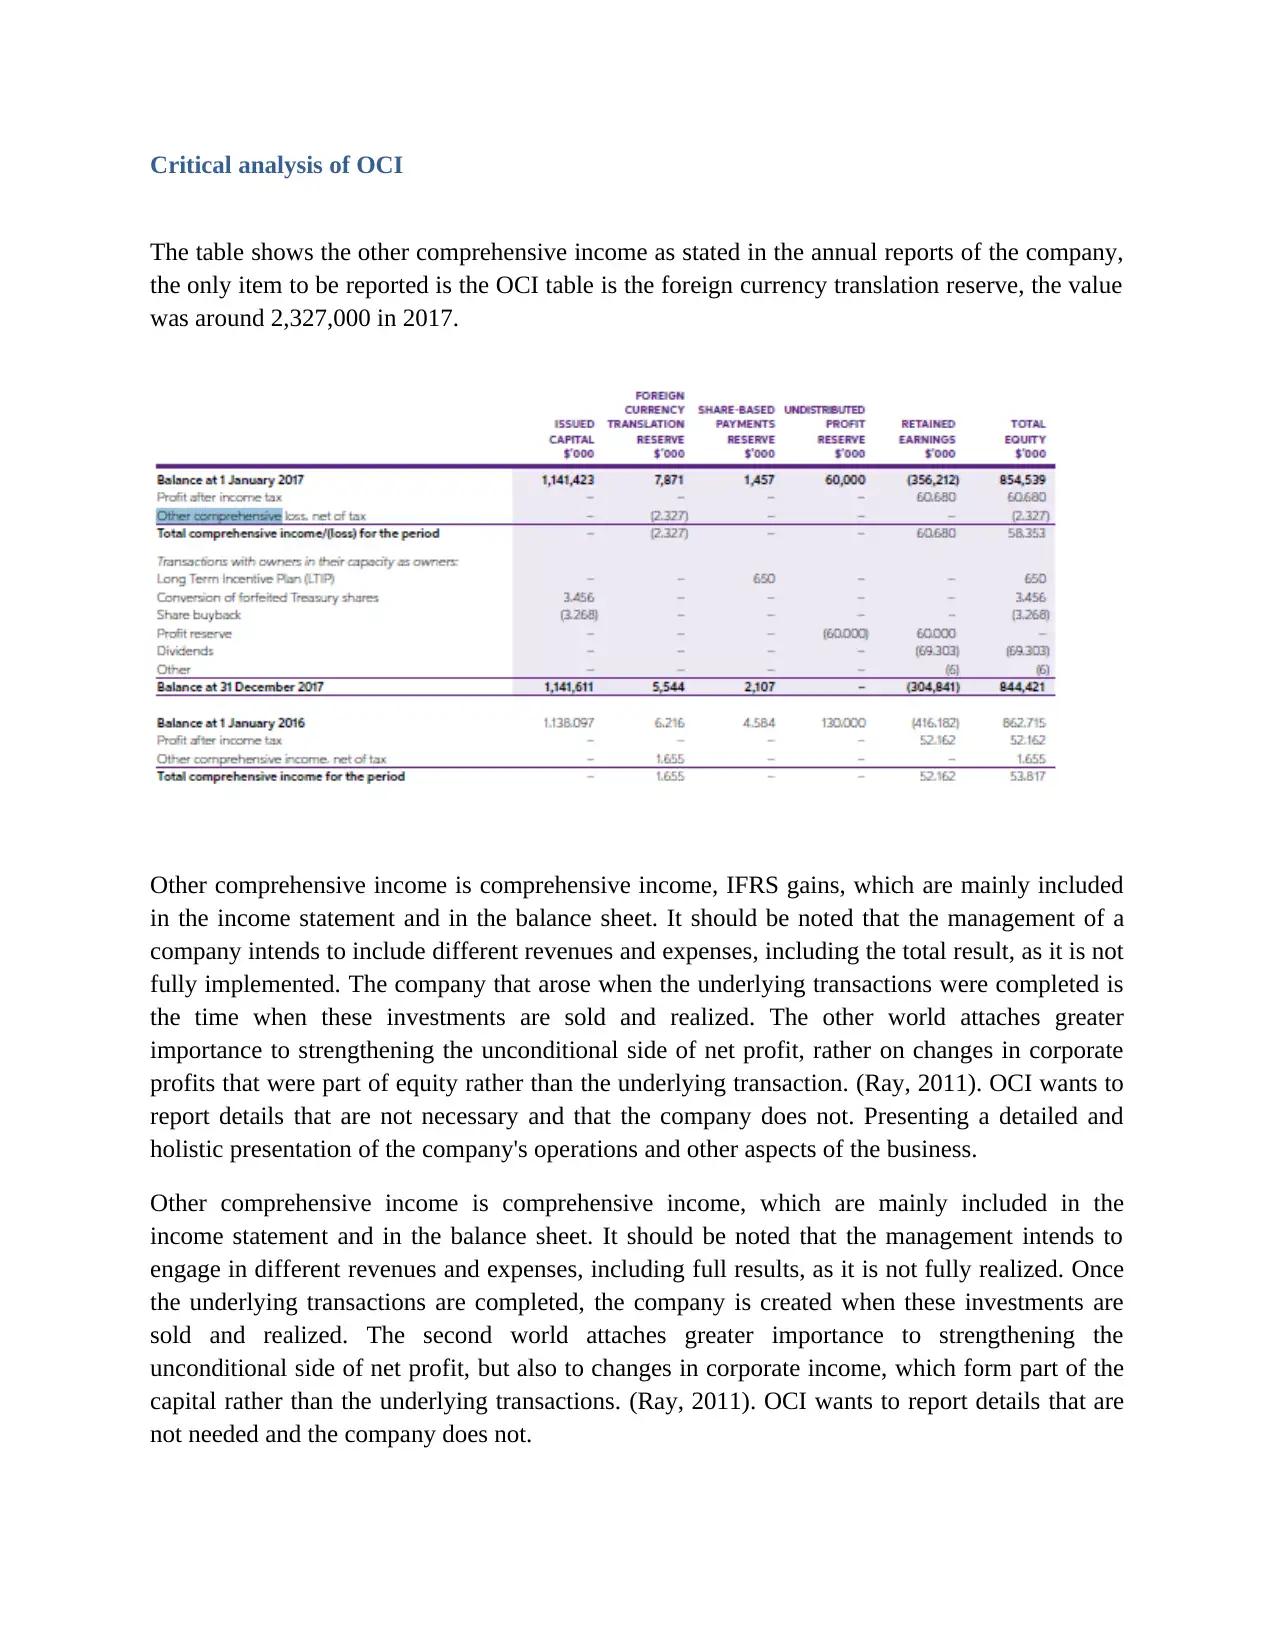
Critical analysis of OCI
The table shows the other comprehensive income as stated in the annual reports of the company,
the only item to be reported is the OCI table is the foreign currency translation reserve, the value
was around 2,327,000 in 2017.
Other comprehensive income is comprehensive income, IFRS gains, which are mainly included
in the income statement and in the balance sheet. It should be noted that the management of a
company intends to include different revenues and expenses, including the total result, as it is not
fully implemented. The company that arose when the underlying transactions were completed is
the time when these investments are sold and realized. The other world attaches greater
importance to strengthening the unconditional side of net profit, rather on changes in corporate
profits that were part of equity rather than the underlying transaction. (Ray, 2011). OCI wants to
report details that are not necessary and that the company does not. Presenting a detailed and
holistic presentation of the company's operations and other aspects of the business.
Other comprehensive income is comprehensive income, which are mainly included in the
income statement and in the balance sheet. It should be noted that the management intends to
engage in different revenues and expenses, including full results, as it is not fully realized. Once
the underlying transactions are completed, the company is created when these investments are
sold and realized. The second world attaches greater importance to strengthening the
unconditional side of net profit, but also to changes in corporate income, which form part of the
capital rather than the underlying transactions. (Ray, 2011). OCI wants to report details that are
not needed and the company does not.
⊘ This is a preview!⊘
Do you want full access?
Subscribe today to unlock all pages.
Trusted by 1+ million students worldwide
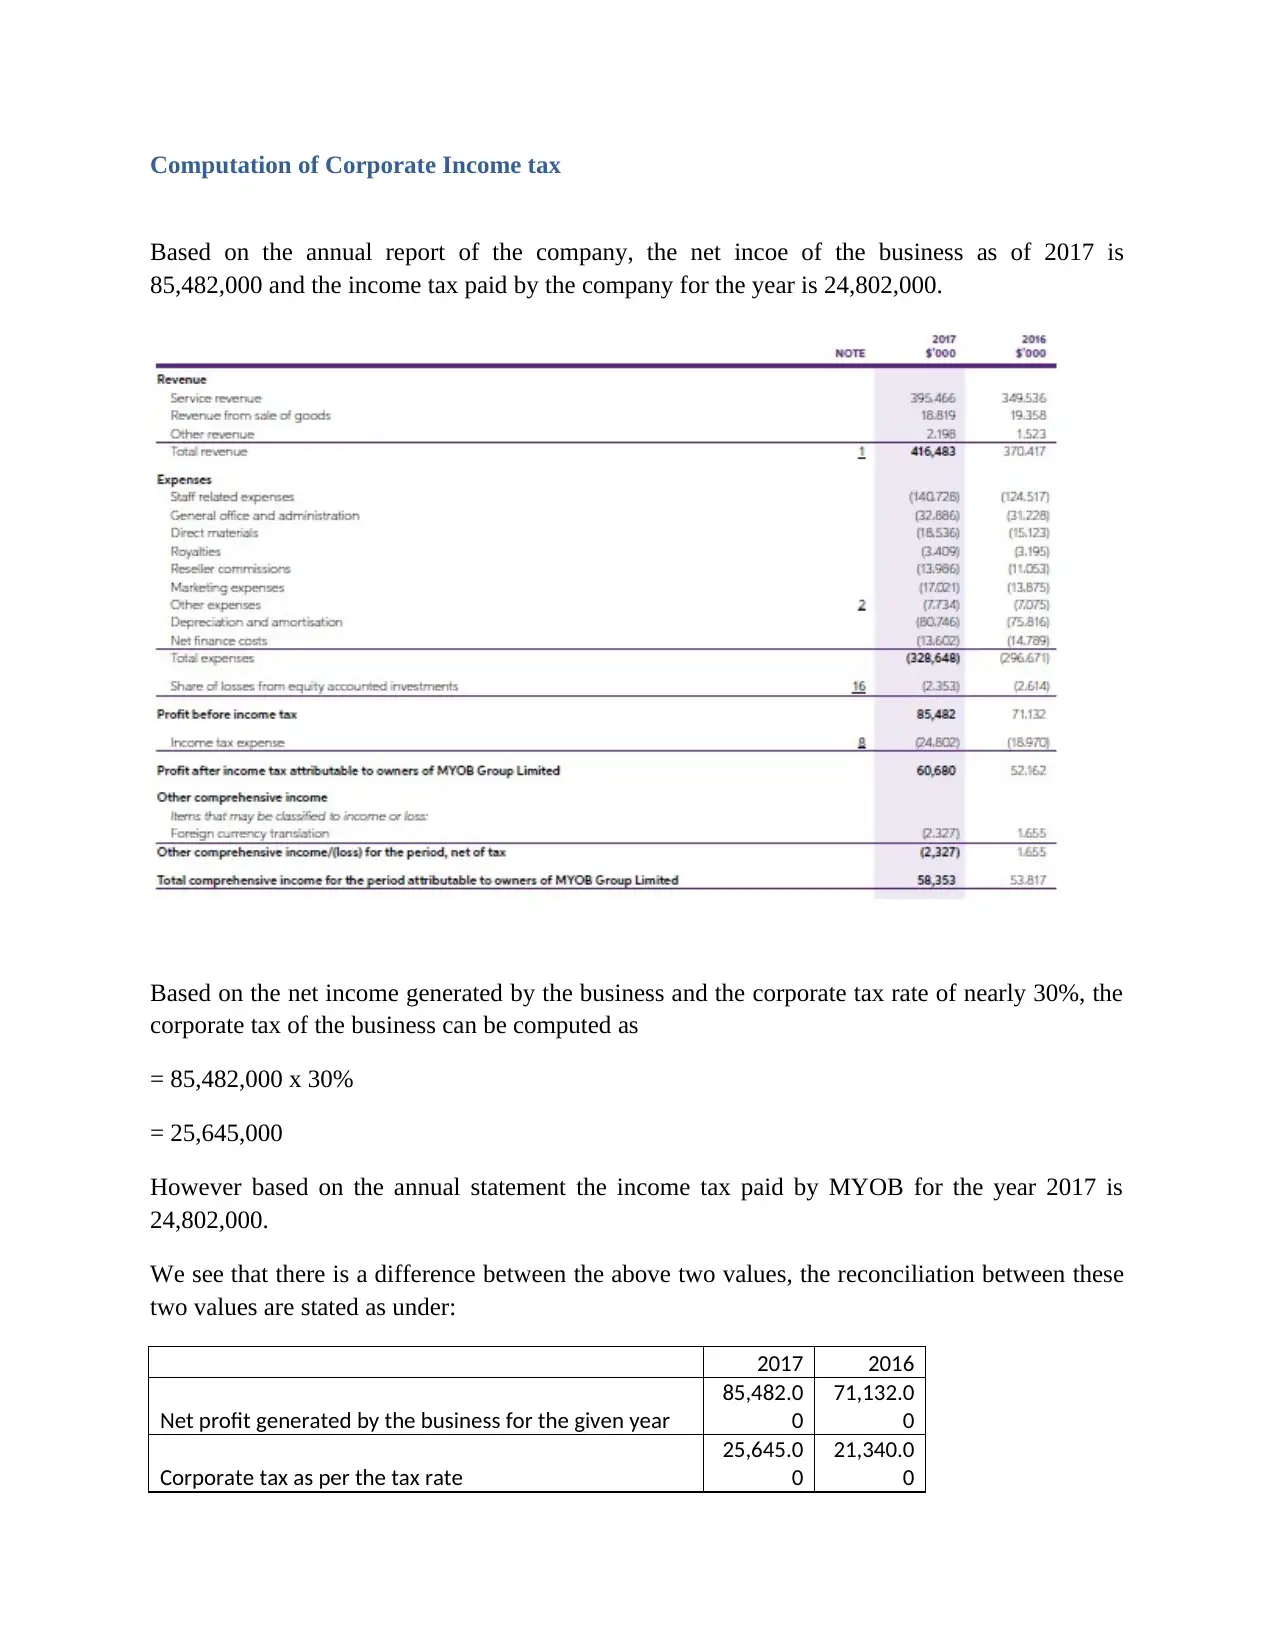
Computation of Corporate Income tax
Based on the annual report of the company, the net incoe of the business as of 2017 is
85,482,000 and the income tax paid by the company for the year is 24,802,000.
Based on the net income generated by the business and the corporate tax rate of nearly 30%, the
corporate tax of the business can be computed as
= 85,482,000 x 30%
= 25,645,000
However based on the annual statement the income tax paid by MYOB for the year 2017 is
24,802,000.
We see that there is a difference between the above two values, the reconciliation between these
two values are stated as under:
2017 2016
Net profit generated by the business for the given year
85,482.0
0
71,132.0
0
Corporate tax as per the tax rate
25,645.0
0
21,340.0
0
Paraphrase This Document
Need a fresh take? Get an instant paraphrase of this document with our AI Paraphraser
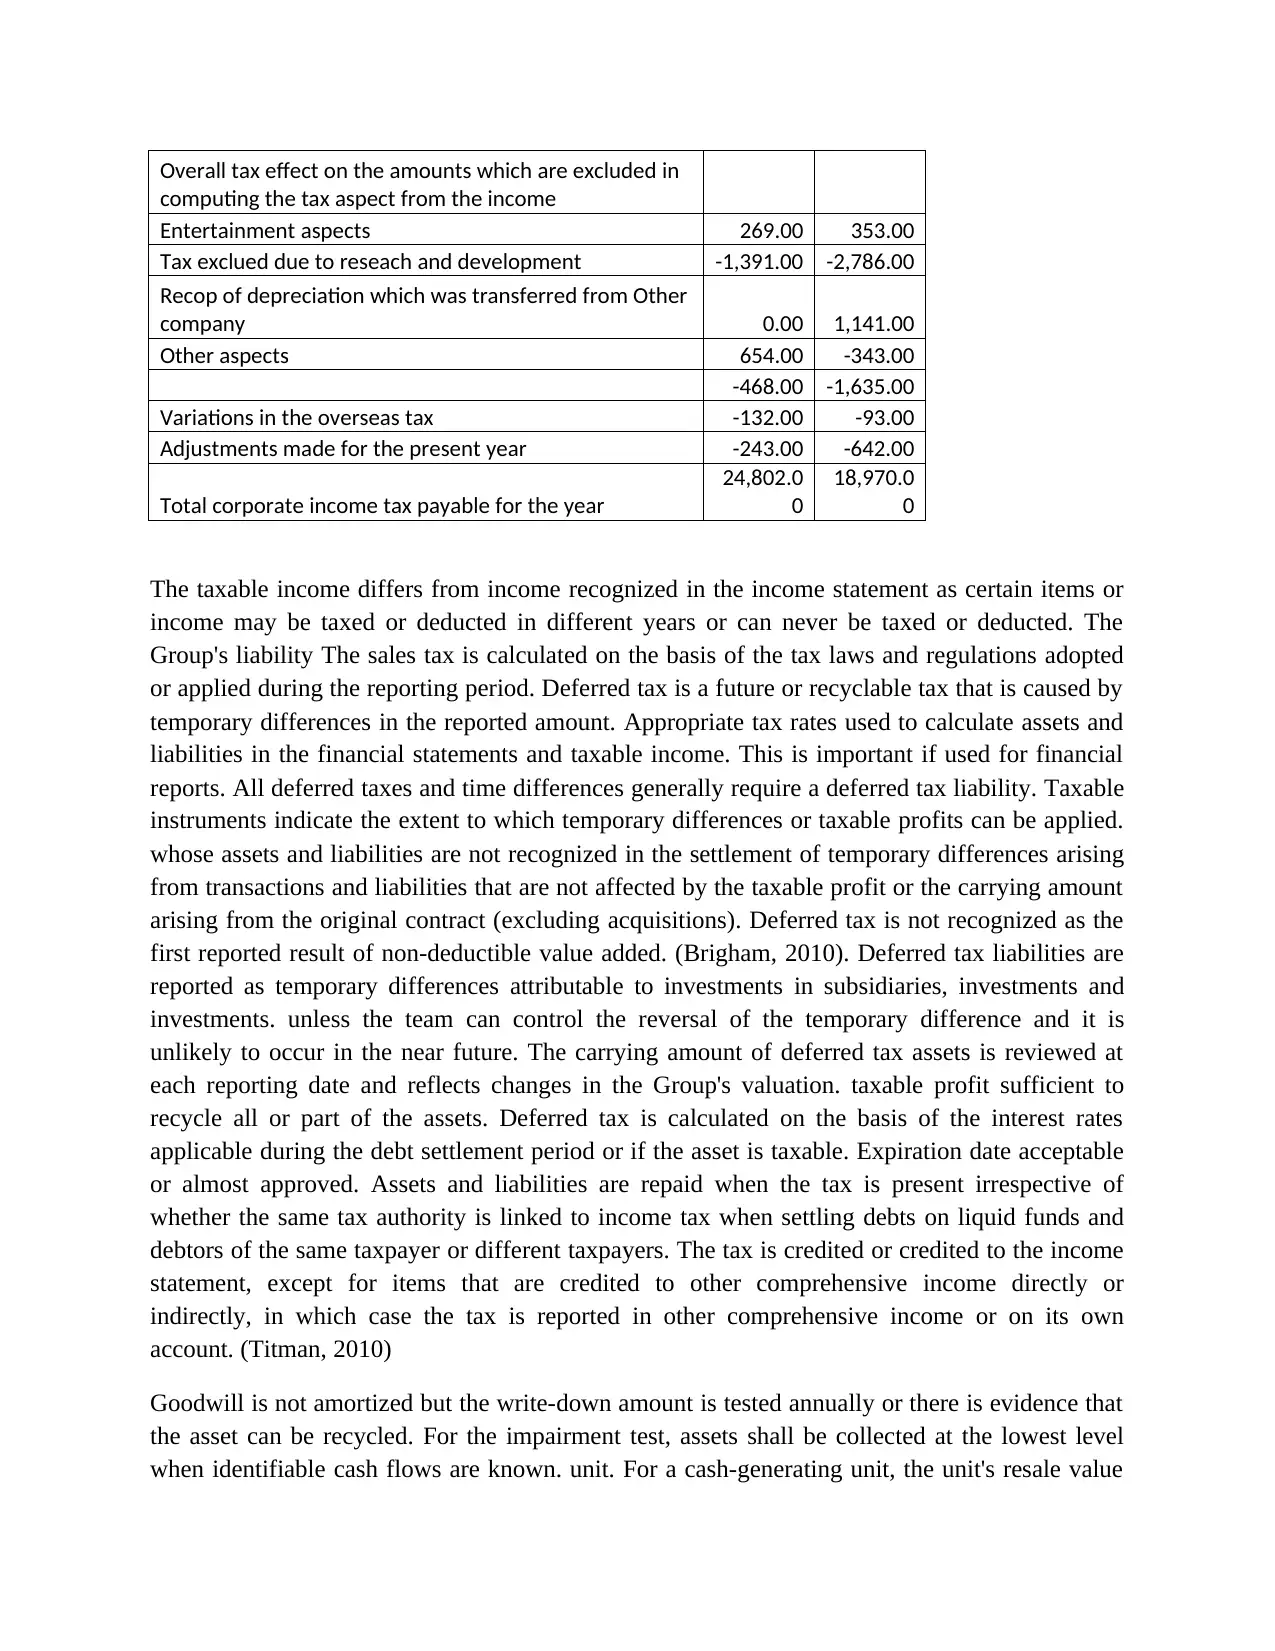
Overall tax effect on the amounts which are excluded in
computing the tax aspect from the income
Entertainment aspects 269.00 353.00
Tax exclued due to reseach and development -1,391.00 -2,786.00
Recop of depreciation which was transferred from Other
company 0.00 1,141.00
Other aspects 654.00 -343.00
-468.00 -1,635.00
Variations in the overseas tax -132.00 -93.00
Adjustments made for the present year -243.00 -642.00
Total corporate income tax payable for the year
24,802.0
0
18,970.0
0
The taxable income differs from income recognized in the income statement as certain items or
income may be taxed or deducted in different years or can never be taxed or deducted. The
Group's liability The sales tax is calculated on the basis of the tax laws and regulations adopted
or applied during the reporting period. Deferred tax is a future or recyclable tax that is caused by
temporary differences in the reported amount. Appropriate tax rates used to calculate assets and
liabilities in the financial statements and taxable income. This is important if used for financial
reports. All deferred taxes and time differences generally require a deferred tax liability. Taxable
instruments indicate the extent to which temporary differences or taxable profits can be applied.
whose assets and liabilities are not recognized in the settlement of temporary differences arising
from transactions and liabilities that are not affected by the taxable profit or the carrying amount
arising from the original contract (excluding acquisitions). Deferred tax is not recognized as the
first reported result of non-deductible value added. (Brigham, 2010). Deferred tax liabilities are
reported as temporary differences attributable to investments in subsidiaries, investments and
investments. unless the team can control the reversal of the temporary difference and it is
unlikely to occur in the near future. The carrying amount of deferred tax assets is reviewed at
each reporting date and reflects changes in the Group's valuation. taxable profit sufficient to
recycle all or part of the assets. Deferred tax is calculated on the basis of the interest rates
applicable during the debt settlement period or if the asset is taxable. Expiration date acceptable
or almost approved. Assets and liabilities are repaid when the tax is present irrespective of
whether the same tax authority is linked to income tax when settling debts on liquid funds and
debtors of the same taxpayer or different taxpayers. The tax is credited or credited to the income
statement, except for items that are credited to other comprehensive income directly or
indirectly, in which case the tax is reported in other comprehensive income or on its own
account. (Titman, 2010)
Goodwill is not amortized but the write-down amount is tested annually or there is evidence that
the asset can be recycled. For the impairment test, assets shall be collected at the lowest level
when identifiable cash flows are known. unit. For a cash-generating unit, the unit's resale value
reduces the write-down, mainly decreases the book value of goodwill associated with the
company, and then gives the entity access to other assets. The impairment loss recognized in
goodwill can not be changed in subsequent periods. The recoverable amount is the actual value,
the sale cost and the value in use. Estimated future cash flows reflecting current money market
and risk assessments at discounted discount rates before tax in current valuations are special
tools for which future cash flow analyzes have not been modified.
References
Bragg, Steven. (2007). Throughput Accounting: A Guide to Constraint Management. 1st edition.
Wiley & Sons
Brigham, E. F. (2010). Financial Management: Theory & Practice. 5th edition. Cengage
Learning.
Brooks, R. M. (2012). Financial Management. 4th edition. Prentice Hall.
Kaplan, R. S., & Young, M. S. (2011). Management Accounting. 3rd edition. Prentice Hall.
MYOB. (2017). Annual report of MYOB
Ray, G., & Eric, N. (2011). Managerial Accounting. McGraw-Hill/Irwin.
Titman, S. J. (2010). Financial Management. Prentice Hall.
Weygandt. (2011). Managerial Accounting: Tools for Business Decision Making (6th ed.).
Wiley.
⊘ This is a preview!⊘
Do you want full access?
Subscribe today to unlock all pages.
Trusted by 1+ million students worldwide
1 out of 9
Related Documents


Your All-in-One AI-Powered Toolkit for Academic Success.
+13062052269
info@desklib.com
Available 24*7 on WhatsApp / Email
![[object Object]](/_next/static/media/star-bottom.7253800d.svg)
Unlock your academic potential
Copyright © 2020–2026 A2Z Services. All Rights Reserved. Developed and managed by ZUCOL.