Comparative Financial Analysis: NAB and ANZ Bank Performance 2017-2018
VerifiedAdded on 2022/10/06
|6
|755
|492
Case Study
AI Summary
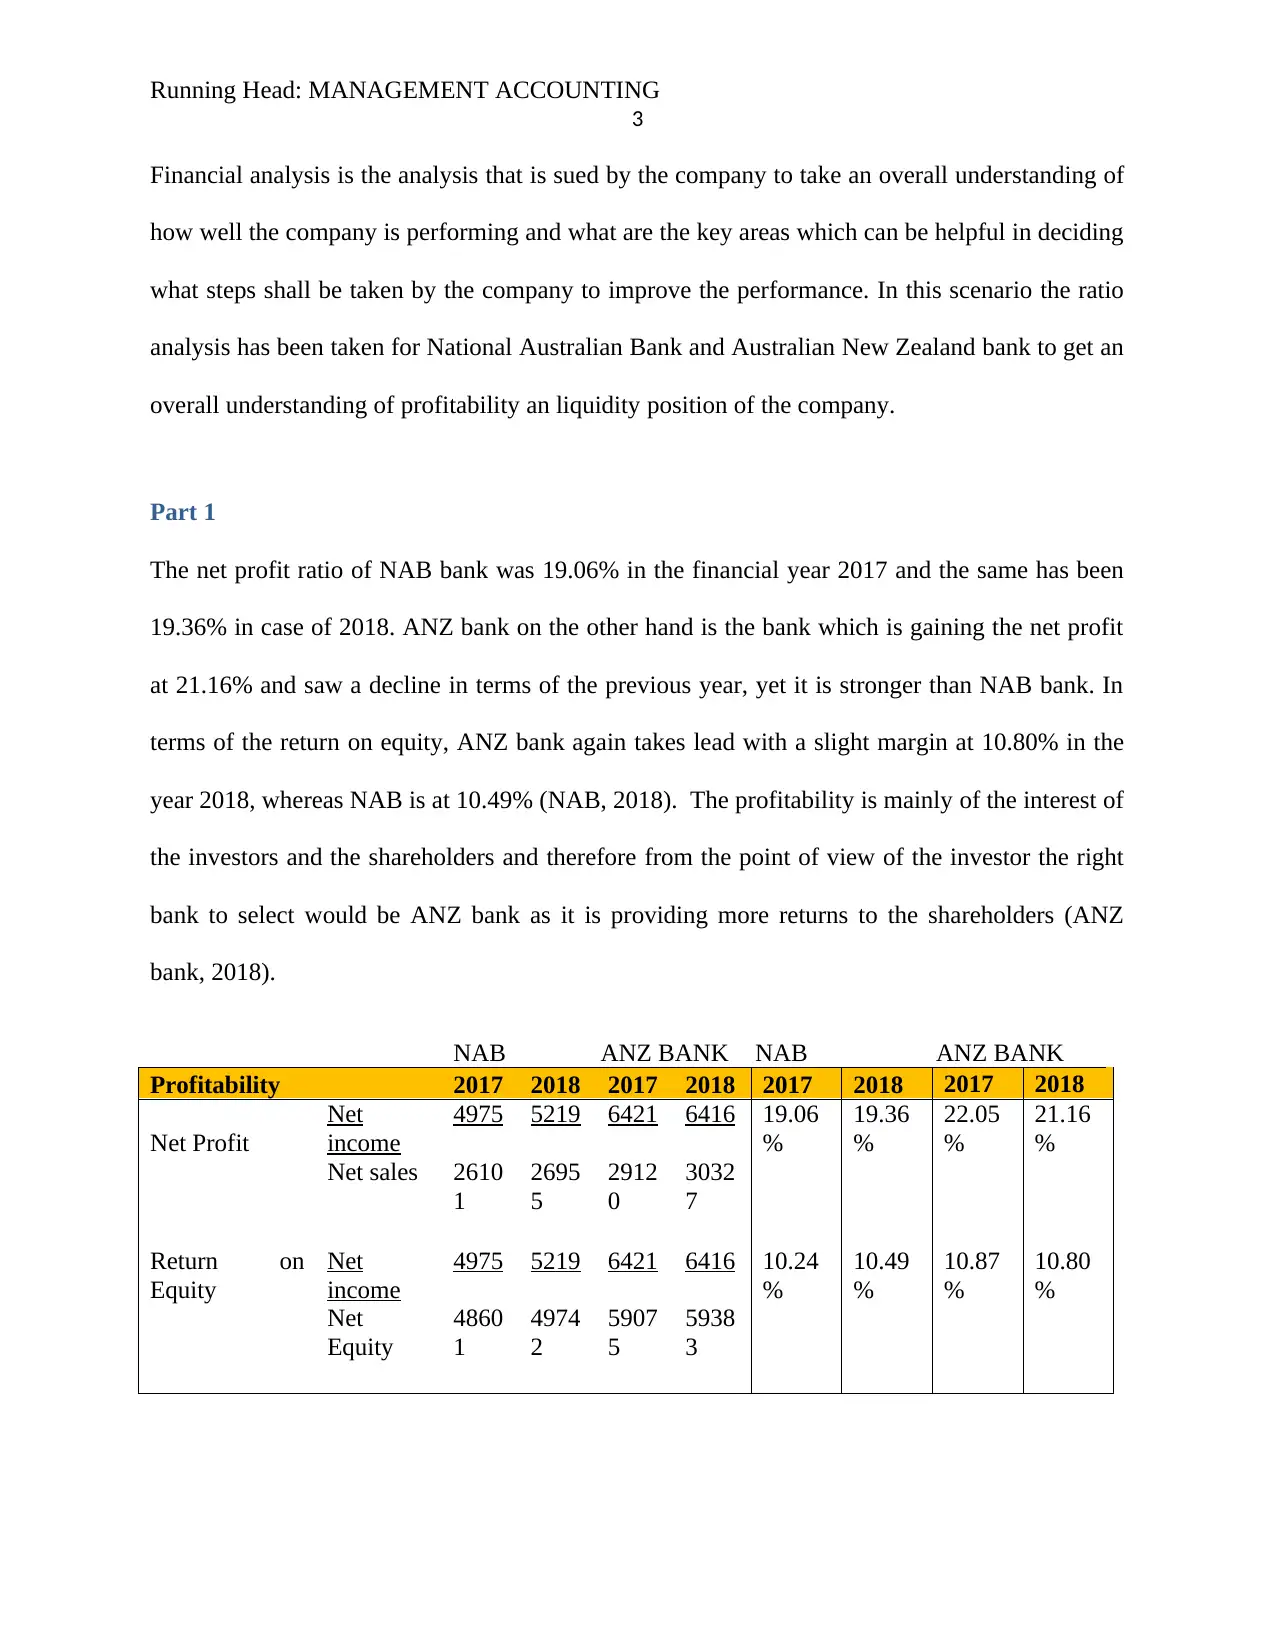
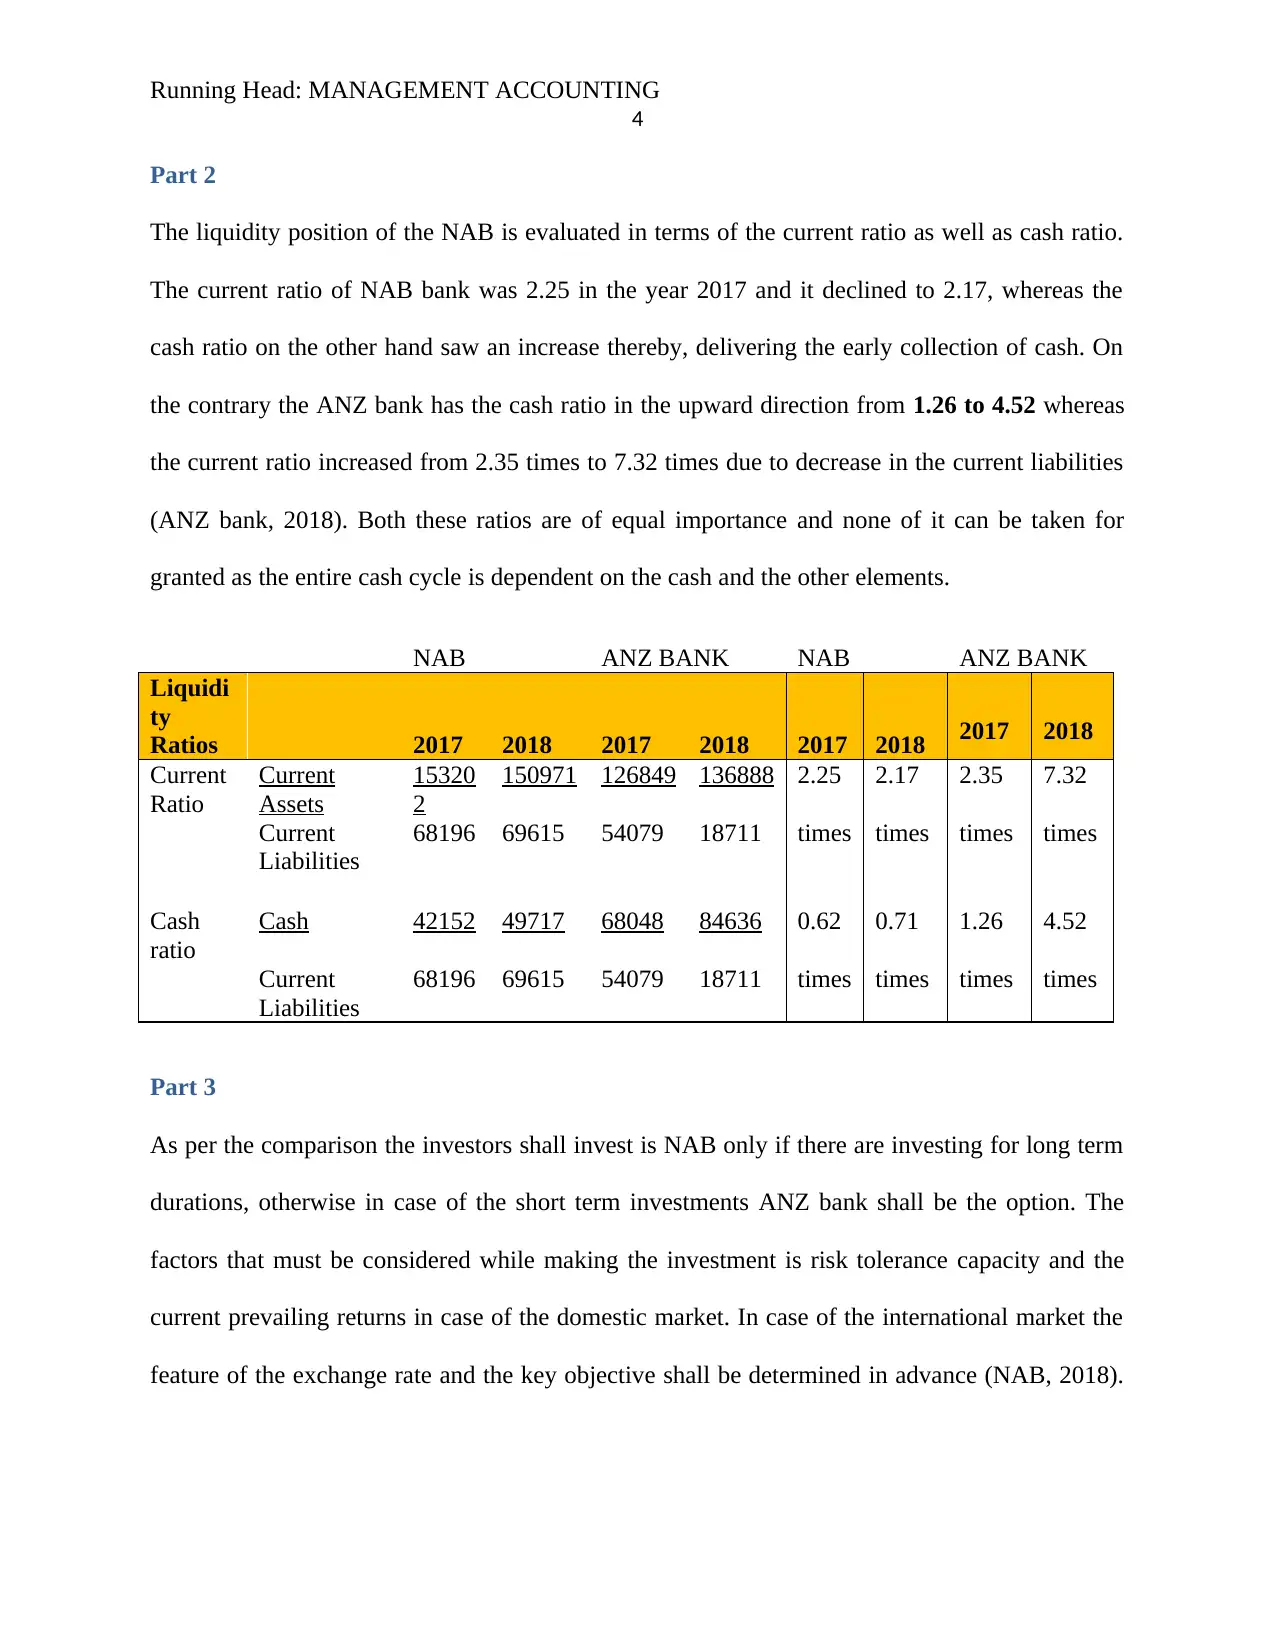
This case study provides a financial analysis of the National Australia Bank (NAB) and the Australian New Zealand (ANZ) Bank, focusing on their performance in 2017 and 2018. The analysis utilizes financial ratios, including net profit ratio, return on equity, current ratio, and cash ratio, to assess the profitability and liquidity positions of both banks. The study compares the performance of NAB and ANZ, highlighting ANZ's stronger performance in terms of profitability and liquidity. The conclusion suggests that ANZ Bank is performing better overall, with the potential for NAB to improve and become a viable option for long-term investments. The report also includes references to the annual reports of both banks.

Running Head: MANAGEMENT ACCOUNTING
1
MANAGEMENT ACCOUNTING
1
MANAGEMENT ACCOUNTING
Paraphrase This Document
Need a fresh take? Get an instant paraphrase of this document with our AI Paraphraser

Running Head: MANAGEMENT ACCOUNTING
2
Table of Contents
Part 1................................................................................................................................................3
Part 2................................................................................................................................................3
Part 3................................................................................................................................................4
References........................................................................................................................................5

Running Head: MANAGEMENT ACCOUNTING
3
Financial analysis is the analysis that is sued by the company to take an overall understanding of
how well the company is performing and what are the key areas which can be helpful in deciding
what steps shall be taken by the company to improve the performance. In this scenario the ratio
analysis has been taken for National Australian Bank and Australian New Zealand bank to get an
overall understanding of profitability an liquidity position of the company.
Part 1
The net profit ratio of NAB bank was 19.06% in the financial year 2017 and the same has been
19.36% in case of 2018. ANZ bank on the other hand is the bank which is gaining the net profit
at 21.16% and saw a decline in terms of the previous year, yet it is stronger than NAB bank. In
terms of the return on equity, ANZ bank again takes lead with a slight margin at 10.80% in the
year 2018, whereas NAB is at 10.49% (NAB, 2018). The profitability is mainly of the interest of
the investors and the shareholders and therefore from the point of view of the investor the right
bank to select would be ANZ bank as it is providing more returns to the shareholders (ANZ
bank, 2018).
NAB ANZ BANK NAB ANZ BANK
Profitability 2017 2018 2017 2018 2017 2018 2017 2018
Net Profit
Net
income
4975 5219 6421 6416 19.06
%
19.36
%
22.05
%
21.16
%
Net sales 2610
1
2695
5
2912
0
3032
7
Return on
Equity
Net
income
4975 5219 6421 6416 10.24
%
10.49
%
10.87
%
10.80
%
Net
Equity
4860
1
4974
2
5907
5
5938
3
3
Financial analysis is the analysis that is sued by the company to take an overall understanding of
how well the company is performing and what are the key areas which can be helpful in deciding
what steps shall be taken by the company to improve the performance. In this scenario the ratio
analysis has been taken for National Australian Bank and Australian New Zealand bank to get an
overall understanding of profitability an liquidity position of the company.
Part 1
The net profit ratio of NAB bank was 19.06% in the financial year 2017 and the same has been
19.36% in case of 2018. ANZ bank on the other hand is the bank which is gaining the net profit
at 21.16% and saw a decline in terms of the previous year, yet it is stronger than NAB bank. In
terms of the return on equity, ANZ bank again takes lead with a slight margin at 10.80% in the
year 2018, whereas NAB is at 10.49% (NAB, 2018). The profitability is mainly of the interest of
the investors and the shareholders and therefore from the point of view of the investor the right
bank to select would be ANZ bank as it is providing more returns to the shareholders (ANZ
bank, 2018).
NAB ANZ BANK NAB ANZ BANK
Profitability 2017 2018 2017 2018 2017 2018 2017 2018
Net Profit
Net
income
4975 5219 6421 6416 19.06
%
19.36
%
22.05
%
21.16
%
Net sales 2610
1
2695
5
2912
0
3032
7
Return on
Equity
Net
income
4975 5219 6421 6416 10.24
%
10.49
%
10.87
%
10.80
%
Net
Equity
4860
1
4974
2
5907
5
5938
3
⊘ This is a preview!⊘
Do you want full access?
Subscribe today to unlock all pages.

Trusted by 1+ million students worldwide

Running Head: MANAGEMENT ACCOUNTING
4
Part 2
The liquidity position of the NAB is evaluated in terms of the current ratio as well as cash ratio.
The current ratio of NAB bank was 2.25 in the year 2017 and it declined to 2.17, whereas the
cash ratio on the other hand saw an increase thereby, delivering the early collection of cash. On
the contrary the ANZ bank has the cash ratio in the upward direction from 1.26 to 4.52 whereas
the current ratio increased from 2.35 times to 7.32 times due to decrease in the current liabilities
(ANZ bank, 2018). Both these ratios are of equal importance and none of it can be taken for
granted as the entire cash cycle is dependent on the cash and the other elements.
NAB ANZ BANK NAB ANZ BANK
Liquidi
ty
Ratios 2017 2018 2017 2018 2017 2018 2017 2018
Current
Ratio
Current
Assets
15320
2
150971 126849 136888 2.25 2.17 2.35 7.32
Current
Liabilities
68196 69615 54079 18711 times times times times
Cash
ratio
Cash 42152 49717 68048 84636 0.62 0.71 1.26 4.52
Current
Liabilities
68196 69615 54079 18711 times times times times
Part 3
As per the comparison the investors shall invest is NAB only if there are investing for long term
durations, otherwise in case of the short term investments ANZ bank shall be the option. The
factors that must be considered while making the investment is risk tolerance capacity and the
current prevailing returns in case of the domestic market. In case of the international market the
feature of the exchange rate and the key objective shall be determined in advance (NAB, 2018).
Paraphrase This Document
Need a fresh take? Get an instant paraphrase of this document with our AI Paraphraser

Running Head: MANAGEMENT ACCOUNTING
5
As per the overall analysis it can be stated that the NAB bank needs to improve the performances
whereas ANZ bank is already leading (ANZ bank, 2018).
Conclusion
From the overall analysis it can be concluded that ANZ bank is performing better and smoothly
in comparison to National Australian Bank. Whether in terms of profitability or in terms of
liquidity ANZ bank is in lead. Also, as determined the short term decisions and the earning can
be availed by ANZ bank whereas NAB bank if improves the performance in the near future can
be opted for long term purposes.

Running Head: MANAGEMENT ACCOUNTING
6
References
ANZ bank, (2018) Annual Report [Online] Available from
https://www.anz.com/content/dam/anzcom/shareholder/anz_2018_annual_report_final.pdf
[Accessed on 29th September 2019]
NAB, (2018) Annual Report [Online] Available from
https://www.nab.com.au/content/dam/nabrwd/documents/reports/corporate/2018-annual-
financial-report.pdf [Accessed on 29th September 2019]
⊘ This is a preview!⊘
Do you want full access?
Subscribe today to unlock all pages.

Trusted by 1+ million students worldwide
1 out of 6

Your All-in-One AI-Powered Toolkit for Academic Success.
+13062052269
info@desklib.com
Available 24*7 on WhatsApp / Email
Unlock your academic potential
Copyright © 2020–2025 A2Z Services. All Rights Reserved. Developed and managed by ZUCOL.