Financial Performance Analysis of National Australia Bank (NAB)
VerifiedAdded on 2023/03/17
|17
|4841
|80
Report
AI Summary
This report presents a financial performance analysis of National Australia Bank (NAB) over the period from 2016 to 2018. The analysis begins with a description of NAB, an Australian financial services provider, and then proceeds to evaluate its financial performance using profitability and operating efficiency ratios. The report calculates and interprets key metrics such as net profit margin, return on assets (ROA), return on equity (ROE), asset turnover, receivable turnover, and account payable turnover. Furthermore, the report includes a cash management analysis, focusing on marketable securities, and a sensitivity analysis. It also identifies and discusses systemic and unsystemic risks that may influence NAB's performance, along with the bank's dividend payout and policy. The report concludes with a recommendation for inclusion in an investment portfolio.

Running head: FINANCIAL PERFORMANCE ANALYSIS OF NAB 1
Financial Performance Analysis of National Australia Bank
Author
Institution
Date
Financial Performance Analysis of National Australia Bank
Author
Institution
Date
Paraphrase This Document
Need a fresh take? Get an instant paraphrase of this document with our AI Paraphraser

FINANCIAL PERFORMANCE ANALYSIS OF NAB 2
Abstract
Financial performance analysis is a significant aspect for any investor since it aids in
determining performance and efficient of entity’s management as indicated in financial
reports and records. It was also established that financial analysis aids in examining
organization’s efficiency and profitability as well as other signs that an entity is carried out in
rational manner. The paper aimed to evaluate financial performance of National Australia
Bank over the past three years since 2016. Based on the analysis, National Australian Bank is
considered as an Australian financial service provides that engages in provision of business
banking and personal banking services. As per the analysis, it was found out that NAB has
been experiencing improved profitability ratios. Thus, the bank has been profitable and
efficient enough in the past three years on how it handles its resources to generate income or
revenue over time. Therefore, one should consider including the bank in his or her investment
portfolio.
FINANCIAL PERFORMANCE ANALYSIS OF NAB 3
Financial Performance Analysis of National Australia Bank
I. Introduction
Financial performance appraisal is a process of determining financial and operating
features of an entity from financial and accounting statements (Fabozzi & Peterson, 2013). In
other words, it entails assessment and interpretation of organization’s financial statements in
a manner that undertakes whole diagnosis of financial soundness and profitability of an entity
(Foster, 2016). This is aimed at determining performance and efficient of entity’s
management as indicated in financial reports and records (Uotila, Maula, Keil & Zahra,
2009). As such, the paper aims to evaluate financial performance of National Australia Bank
over the past three years since 2016. The paper would be structured as follows; first, it would
begin with brief description of National Australia Bank followed by financial ratio analysis of
the bank based on profitability and operating efficiency ratios. It would then present cash
management analysis and sensitivity analysis of the company financial performance over the
past three years. Besides, the paper also identifies and discusses some of the un-systemic and
systemic risks that might influence performance of NAB. It also highlights NAB dividend
payout as well as its dividend policy through the three year period. This presents some of the
dividend policies the company might have implemented and how they keep on changing over
time. Finally, it concludes with recommendation letter as to why the client should include
NAB in his investment portfolio.
II. Financial Analysis of National Australia Bank
2.1. Description of National Australia Bank Limited
The National Australian Bank is one of the Australian financial service provides that
offers integrated and comprehensive range of financial and banking services including the
wealth management across New Zealand and Australia (National Australian Bank, 2018). In
other words, it is an Australian financial institution that engages in provision of business
⊘ This is a preview!⊘
Do you want full access?
Subscribe today to unlock all pages.
Trusted by 1+ million students worldwide
FINANCIAL PERFORMANCE ANALYSIS OF NAB 4
banking and personal banking services. The firm operates under the following segments; that
is, corporate as well as institutional banking, NZ banking, Business and Private Banking,
Customer Products and Services as well as Wealth Management and Consumer Banking.
Business and Private banking division focuses on the SMEs clients that include the NAB
business franchises with some specialized government, health, community, education and
agriculture services alongside with the private banking (National Australian Bank, 2016). On
the other hand, Corporate as well as Institutional Banking division entails fixed income,
capital financing businesses, international branches, asset servicing as well as corporate
banking operations. It is amongst the fourth largest banking firm in Australia in market
capitalisation, clients and total earnings (National Australian Bank, 2018). Besides, by 2018,
the bank had around 33,283 workers across Australia including workers working across all its
subsidiaries. The bank offers personal banking under nabtrade and the UBank brands as well
as business banking including treasury, specialised finance, asset servicing and debt markets
(National Australian Bank, 2016). The bank also offers financial services and products to
insurance, retail, business and corporate clients across New Zealand. Additionally, NAB
offers business solutions including insurance, investment as well as superannuation (National
Australian Bank, 2017). NAB was formed in the year 1982 once Commercial Banking
Company in Sydney merged with National Bank of the Australia. This merge triggered
substantial offshore expansion over the years.
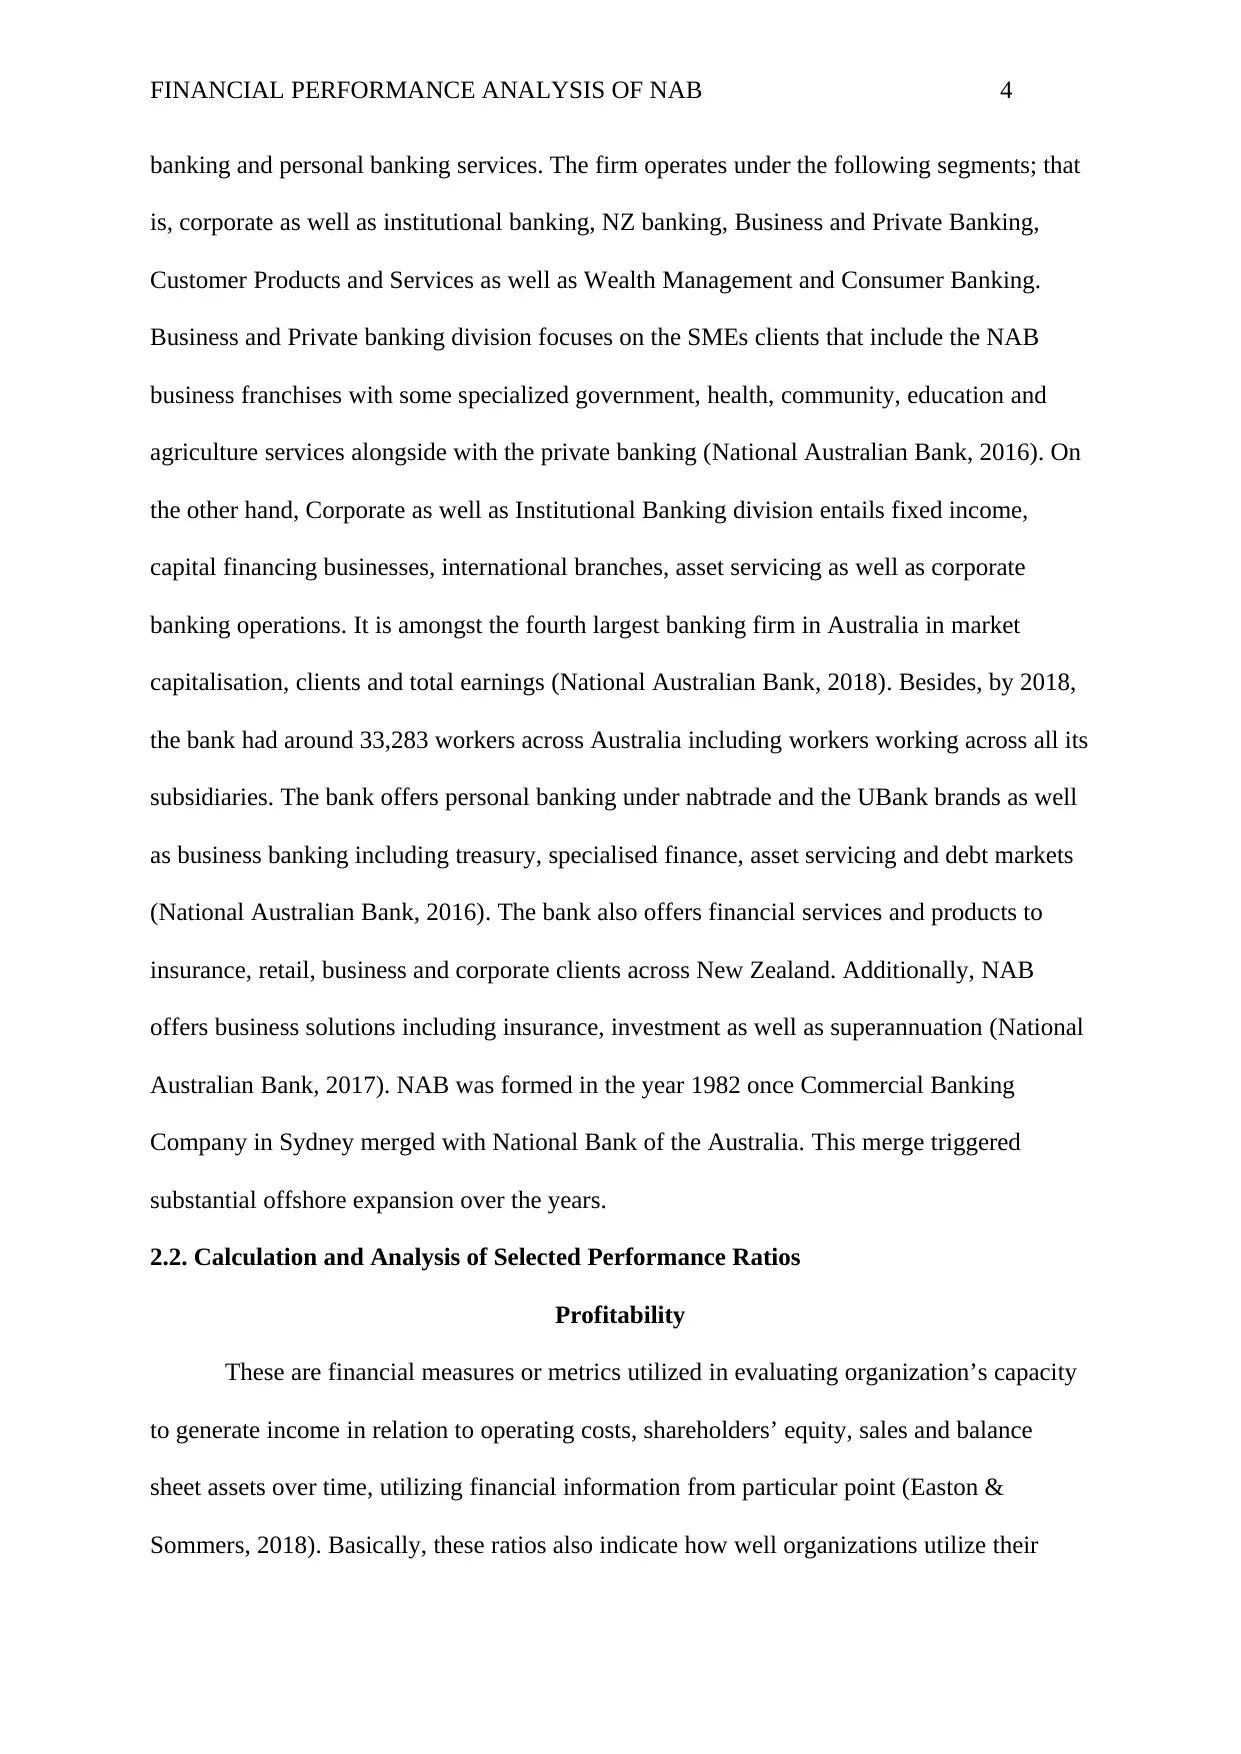
2.2. Calculation and Analysis of Selected Performance Ratios
Profitability
These are financial measures or metrics utilized in evaluating organization’s capacity
to generate income in relation to operating costs, shareholders’ equity, sales and balance
sheet assets over time, utilizing financial information from particular point (Easton &
Sommers, 2018). Basically, these ratios also indicate how well organizations utilize their
banking and personal banking services. The firm operates under the following segments; that
is, corporate as well as institutional banking, NZ banking, Business and Private Banking,
Customer Products and Services as well as Wealth Management and Consumer Banking.
Business and Private banking division focuses on the SMEs clients that include the NAB
business franchises with some specialized government, health, community, education and
agriculture services alongside with the private banking (National Australian Bank, 2016). On
the other hand, Corporate as well as Institutional Banking division entails fixed income,
capital financing businesses, international branches, asset servicing as well as corporate
banking operations. It is amongst the fourth largest banking firm in Australia in market
capitalisation, clients and total earnings (National Australian Bank, 2018). Besides, by 2018,
the bank had around 33,283 workers across Australia including workers working across all its
subsidiaries. The bank offers personal banking under nabtrade and the UBank brands as well
as business banking including treasury, specialised finance, asset servicing and debt markets
(National Australian Bank, 2016). The bank also offers financial services and products to
insurance, retail, business and corporate clients across New Zealand. Additionally, NAB
offers business solutions including insurance, investment as well as superannuation (National
Australian Bank, 2017). NAB was formed in the year 1982 once Commercial Banking
Company in Sydney merged with National Bank of the Australia. This merge triggered
substantial offshore expansion over the years.
2.2. Calculation and Analysis of Selected Performance Ratios
Profitability
These are financial measures or metrics utilized in evaluating organization’s capacity
to generate income in relation to operating costs, shareholders’ equity, sales and balance
sheet assets over time, utilizing financial information from particular point (Easton &
Sommers, 2018). Basically, these ratios also indicate how well organizations utilize their
Paraphrase This Document
Need a fresh take? Get an instant paraphrase of this document with our AI Paraphraser
FINANCIAL PERFORMANCE ANALYSIS OF NAB 5
existing assets in generating income as well as value for stakeholders (Fabozzi & Peterson,
2013). They are set of financial measures applied in determining capacity of an entity to
generate some earnings (Titman, Keown, Martin & Martin, 2011). The ratios are favourable
whenever they improve over time or comparative better than competitors’ outcomes.
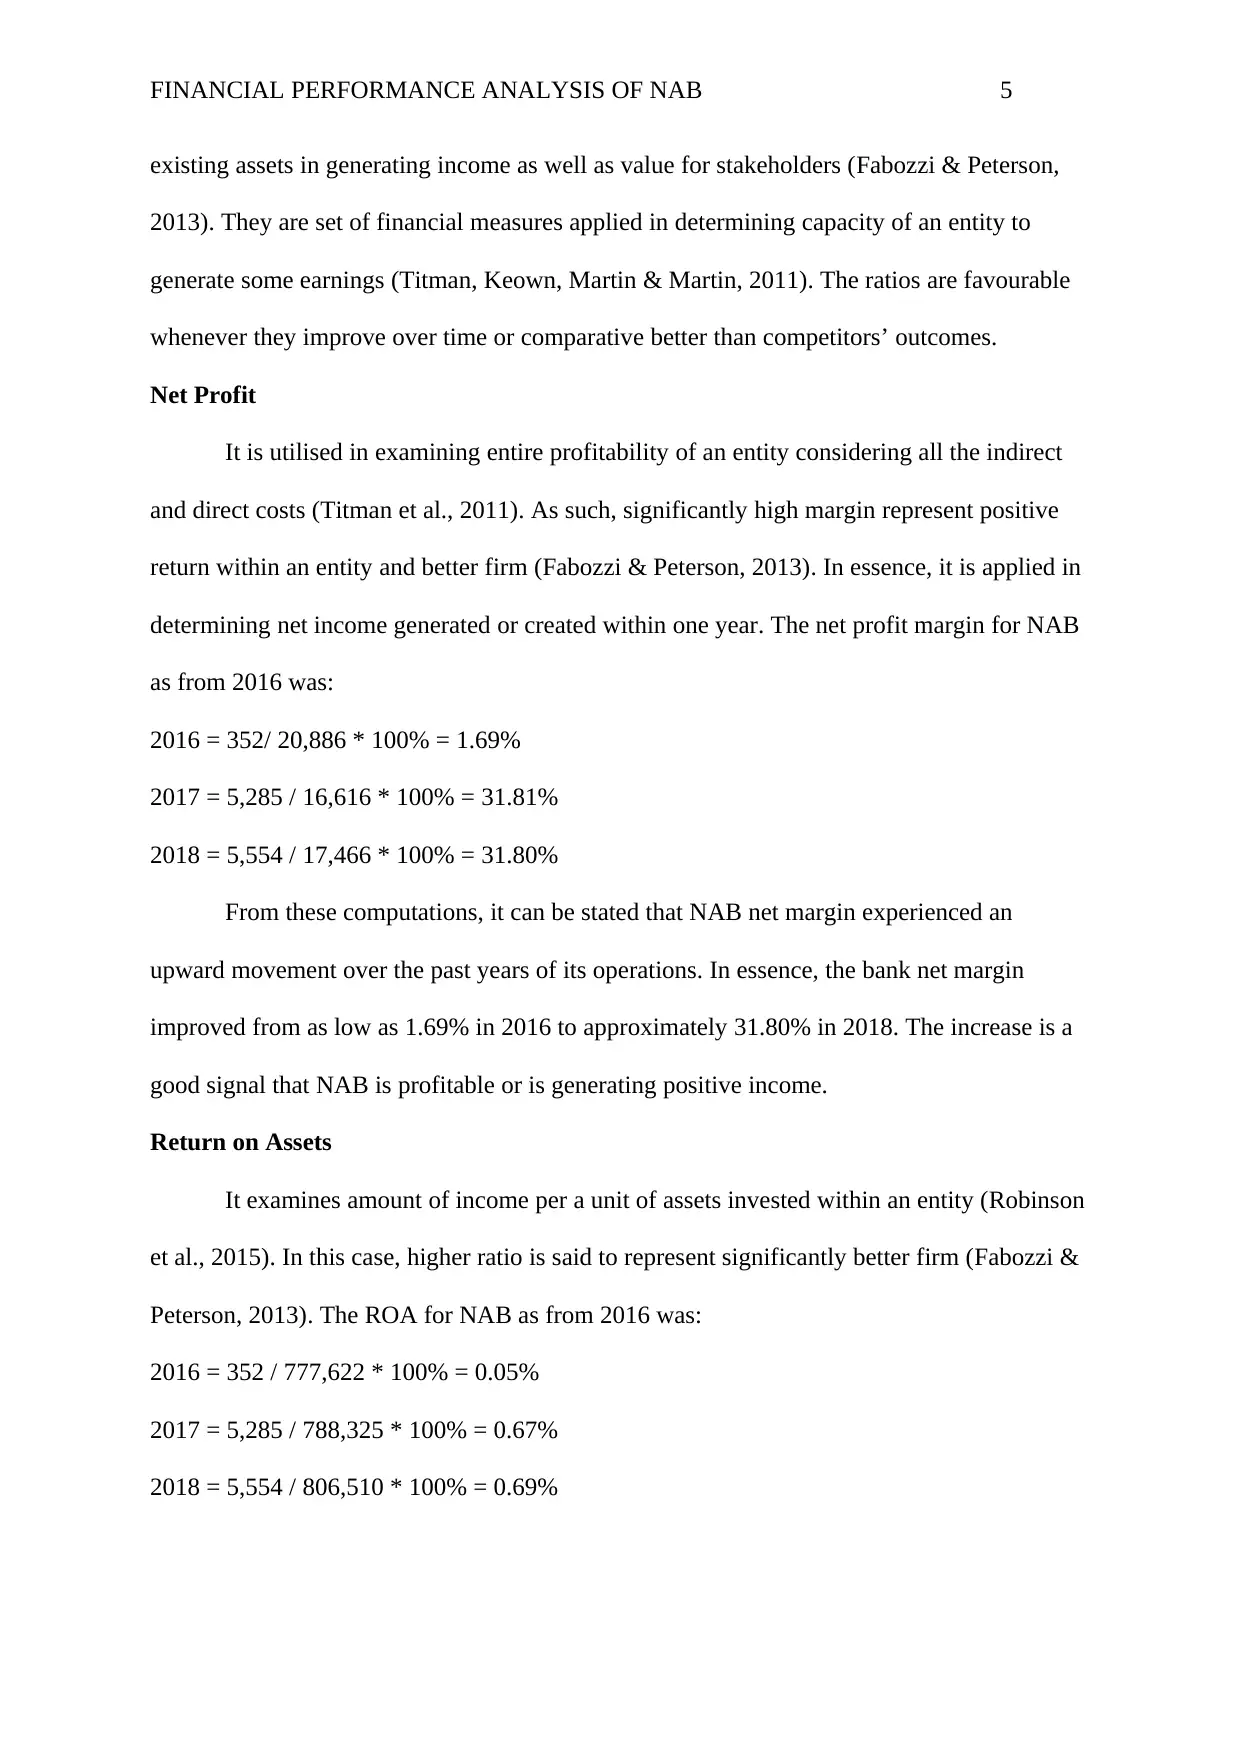
Net Profit
It is utilised in examining entire profitability of an entity considering all the indirect
and direct costs (Titman et al., 2011). As such, significantly high margin represent positive
return within an entity and better firm (Fabozzi & Peterson, 2013). In essence, it is applied in
determining net income generated or created within one year. The net profit margin for NAB
as from 2016 was:
2016 = 352/ 20,886 * 100% = 1.69%
2017 = 5,285 / 16,616 * 100% = 31.81%
2018 = 5,554 / 17,466 * 100% = 31.80%
From these computations, it can be stated that NAB net margin experienced an
upward movement over the past years of its operations. In essence, the bank net margin
improved from as low as 1.69% in 2016 to approximately 31.80% in 2018. The increase is a
good signal that NAB is profitable or is generating positive income.
Return on Assets
It examines amount of income per a unit of assets invested within an entity (Robinson
et al., 2015). In this case, higher ratio is said to represent significantly better firm (Fabozzi &
Peterson, 2013). The ROA for NAB as from 2016 was:
2016 = 352 / 777,622 * 100% = 0.05%
2017 = 5,285 / 788,325 * 100% = 0.67%
2018 = 5,554 / 806,510 * 100% = 0.69%
existing assets in generating income as well as value for stakeholders (Fabozzi & Peterson,
2013). They are set of financial measures applied in determining capacity of an entity to
generate some earnings (Titman, Keown, Martin & Martin, 2011). The ratios are favourable
whenever they improve over time or comparative better than competitors’ outcomes.
Net Profit
It is utilised in examining entire profitability of an entity considering all the indirect
and direct costs (Titman et al., 2011). As such, significantly high margin represent positive
return within an entity and better firm (Fabozzi & Peterson, 2013). In essence, it is applied in
determining net income generated or created within one year. The net profit margin for NAB
as from 2016 was:
2016 = 352/ 20,886 * 100% = 1.69%
2017 = 5,285 / 16,616 * 100% = 31.81%
2018 = 5,554 / 17,466 * 100% = 31.80%
From these computations, it can be stated that NAB net margin experienced an
upward movement over the past years of its operations. In essence, the bank net margin
improved from as low as 1.69% in 2016 to approximately 31.80% in 2018. The increase is a
good signal that NAB is profitable or is generating positive income.
Return on Assets
It examines amount of income per a unit of assets invested within an entity (Robinson
et al., 2015). In this case, higher ratio is said to represent significantly better firm (Fabozzi &
Peterson, 2013). The ROA for NAB as from 2016 was:
2016 = 352 / 777,622 * 100% = 0.05%
2017 = 5,285 / 788,325 * 100% = 0.67%
2018 = 5,554 / 806,510 * 100% = 0.69%
FINANCIAL PERFORMANCE ANALYSIS OF NAB 6
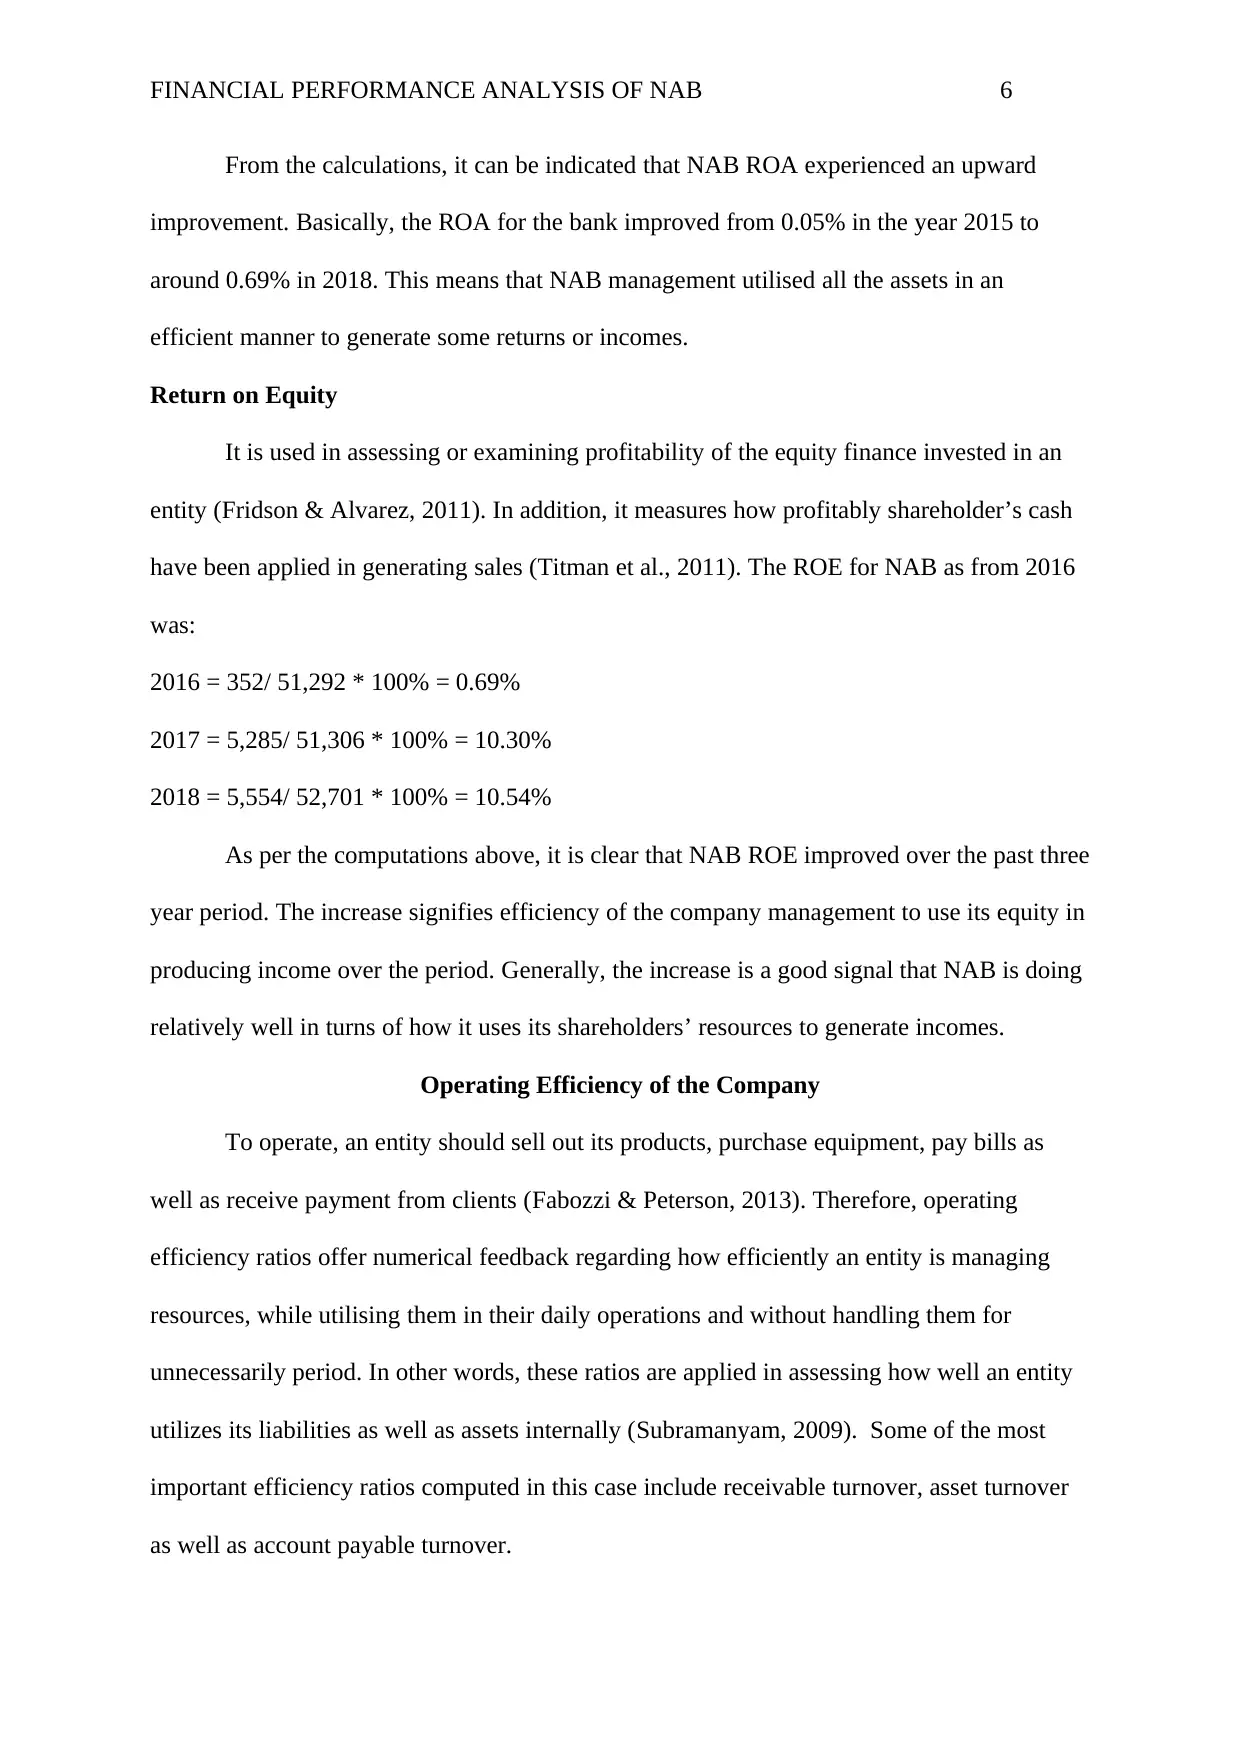
From the calculations, it can be indicated that NAB ROA experienced an upward
improvement. Basically, the ROA for the bank improved from 0.05% in the year 2015 to
around 0.69% in 2018. This means that NAB management utilised all the assets in an
efficient manner to generate some returns or incomes.
Return on Equity
It is used in assessing or examining profitability of the equity finance invested in an
entity (Fridson & Alvarez, 2011). In addition, it measures how profitably shareholder’s cash
have been applied in generating sales (Titman et al., 2011). The ROE for NAB as from 2016
was:
2016 = 352/ 51,292 * 100% = 0.69%
2017 = 5,285/ 51,306 * 100% = 10.30%
2018 = 5,554/ 52,701 * 100% = 10.54%
As per the computations above, it is clear that NAB ROE improved over the past three
year period. The increase signifies efficiency of the company management to use its equity in
producing income over the period. Generally, the increase is a good signal that NAB is doing
relatively well in turns of how it uses its shareholders’ resources to generate incomes.
Operating Efficiency of the Company
To operate, an entity should sell out its products, purchase equipment, pay bills as
well as receive payment from clients (Fabozzi & Peterson, 2013). Therefore, operating
efficiency ratios offer numerical feedback regarding how efficiently an entity is managing
resources, while utilising them in their daily operations and without handling them for
unnecessarily period. In other words, these ratios are applied in assessing how well an entity
utilizes its liabilities as well as assets internally (Subramanyam, 2009). Some of the most
important efficiency ratios computed in this case include receivable turnover, asset turnover
as well as account payable turnover.
⊘ This is a preview!⊘
Do you want full access?
Subscribe today to unlock all pages.
Trusted by 1+ million students worldwide
FINANCIAL PERFORMANCE ANALYSIS OF NAB 7
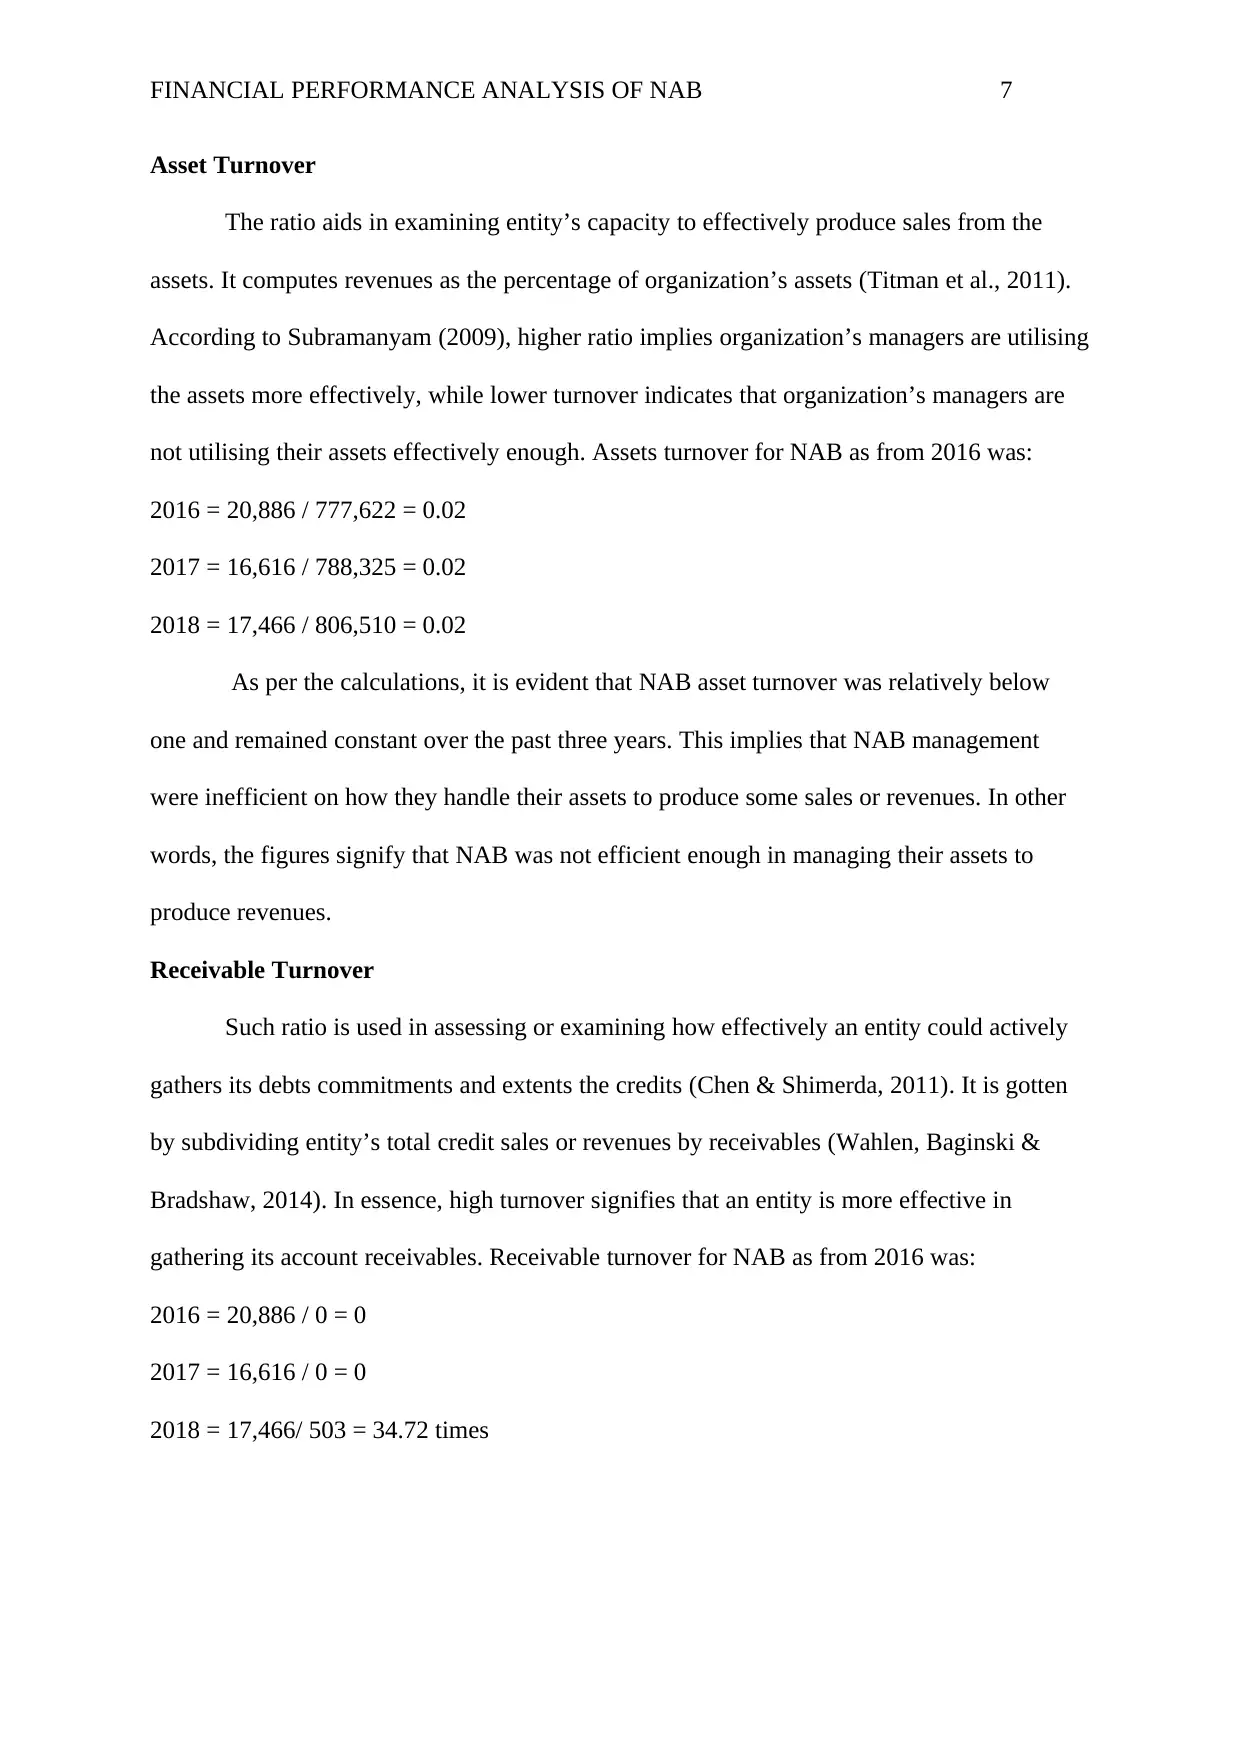
Asset Turnover
The ratio aids in examining entity’s capacity to effectively produce sales from the
assets. It computes revenues as the percentage of organization’s assets (Titman et al., 2011).
According to Subramanyam (2009), higher ratio implies organization’s managers are utilising
the assets more effectively, while lower turnover indicates that organization’s managers are
not utilising their assets effectively enough. Assets turnover for NAB as from 2016 was:
2016 = 20,886 / 777,622 = 0.02
2017 = 16,616 / 788,325 = 0.02
2018 = 17,466 / 806,510 = 0.02
As per the calculations, it is evident that NAB asset turnover was relatively below
one and remained constant over the past three years. This implies that NAB management
were inefficient on how they handle their assets to produce some sales or revenues. In other
words, the figures signify that NAB was not efficient enough in managing their assets to
produce revenues.
Receivable Turnover
Such ratio is used in assessing or examining how effectively an entity could actively
gathers its debts commitments and extents the credits (Chen & Shimerda, 2011). It is gotten
by subdividing entity’s total credit sales or revenues by receivables (Wahlen, Baginski &
Bradshaw, 2014). In essence, high turnover signifies that an entity is more effective in
gathering its account receivables. Receivable turnover for NAB as from 2016 was:
2016 = 20,886 / 0 = 0
2017 = 16,616 / 0 = 0
2018 = 17,466/ 503 = 34.72 times
Paraphrase This Document
Need a fresh take? Get an instant paraphrase of this document with our AI Paraphraser
FINANCIAL PERFORMANCE ANALYSIS OF NAB 8
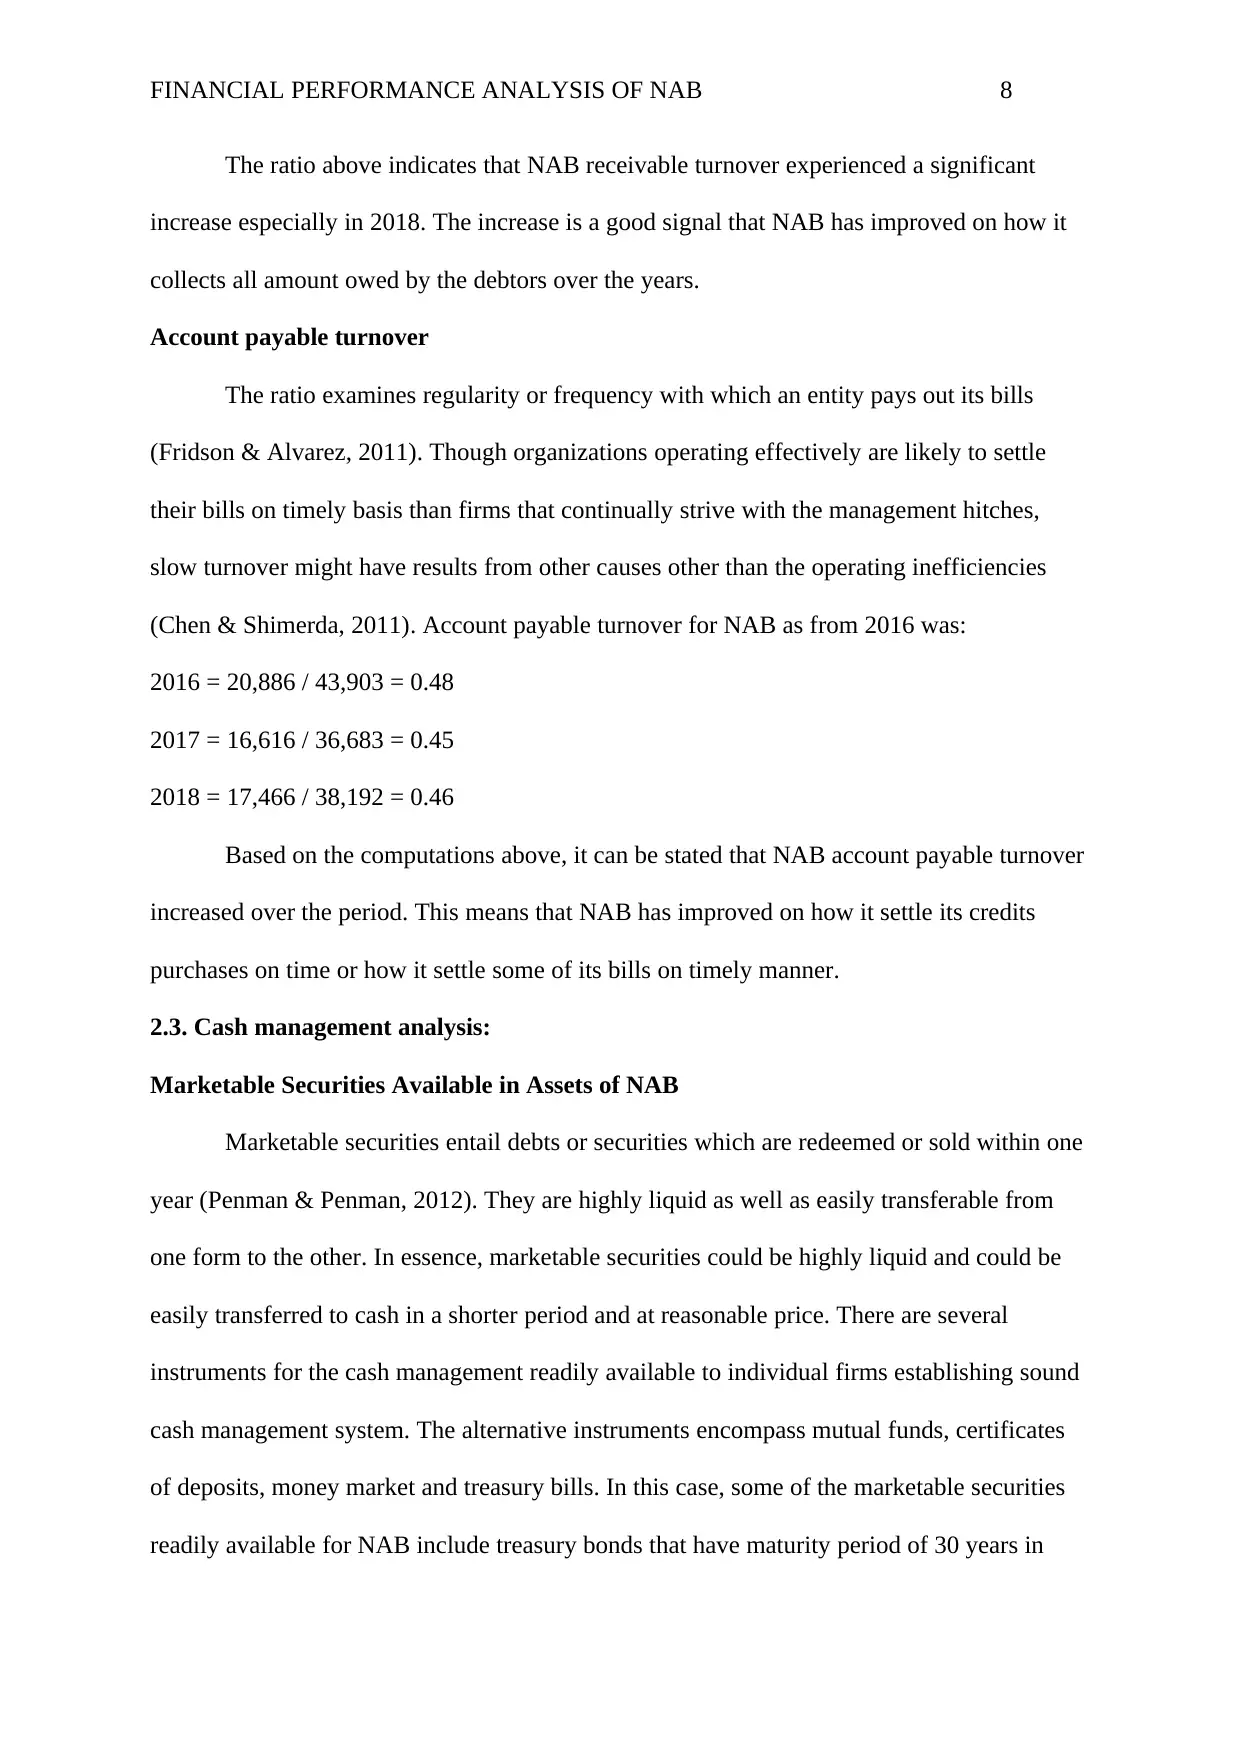
The ratio above indicates that NAB receivable turnover experienced a significant
increase especially in 2018. The increase is a good signal that NAB has improved on how it
collects all amount owed by the debtors over the years.
Account payable turnover
The ratio examines regularity or frequency with which an entity pays out its bills
(Fridson & Alvarez, 2011). Though organizations operating effectively are likely to settle
their bills on timely basis than firms that continually strive with the management hitches,
slow turnover might have results from other causes other than the operating inefficiencies
(Chen & Shimerda, 2011). Account payable turnover for NAB as from 2016 was:
2016 = 20,886 / 43,903 = 0.48
2017 = 16,616 / 36,683 = 0.45
2018 = 17,466 / 38,192 = 0.46
Based on the computations above, it can be stated that NAB account payable turnover
increased over the period. This means that NAB has improved on how it settle its credits
purchases on time or how it settle some of its bills on timely manner.
2.3. Cash management analysis:
Marketable Securities Available in Assets of NAB
Marketable securities entail debts or securities which are redeemed or sold within one
year (Penman & Penman, 2012). They are highly liquid as well as easily transferable from
one form to the other. In essence, marketable securities could be highly liquid and could be
easily transferred to cash in a shorter period and at reasonable price. There are several
instruments for the cash management readily available to individual firms establishing sound
cash management system. The alternative instruments encompass mutual funds, certificates
of deposits, money market and treasury bills. In this case, some of the marketable securities
readily available for NAB include treasury bonds that have maturity period of 30 years in
FINANCIAL PERFORMANCE ANALYSIS OF NAB 9
2018. Generally, bonds are some of the most common marketable securities for NAB
(National Australian Bank, 2018). These are considered significant source of finances to
NAB which are striving to improve financially. These are securities issued by the bank
permitting it to borrow some cash from the investors. The company also had market
securities inform of indirect investments which includes the hedging derivatives. Such
instruments present ownership in the investment firms.
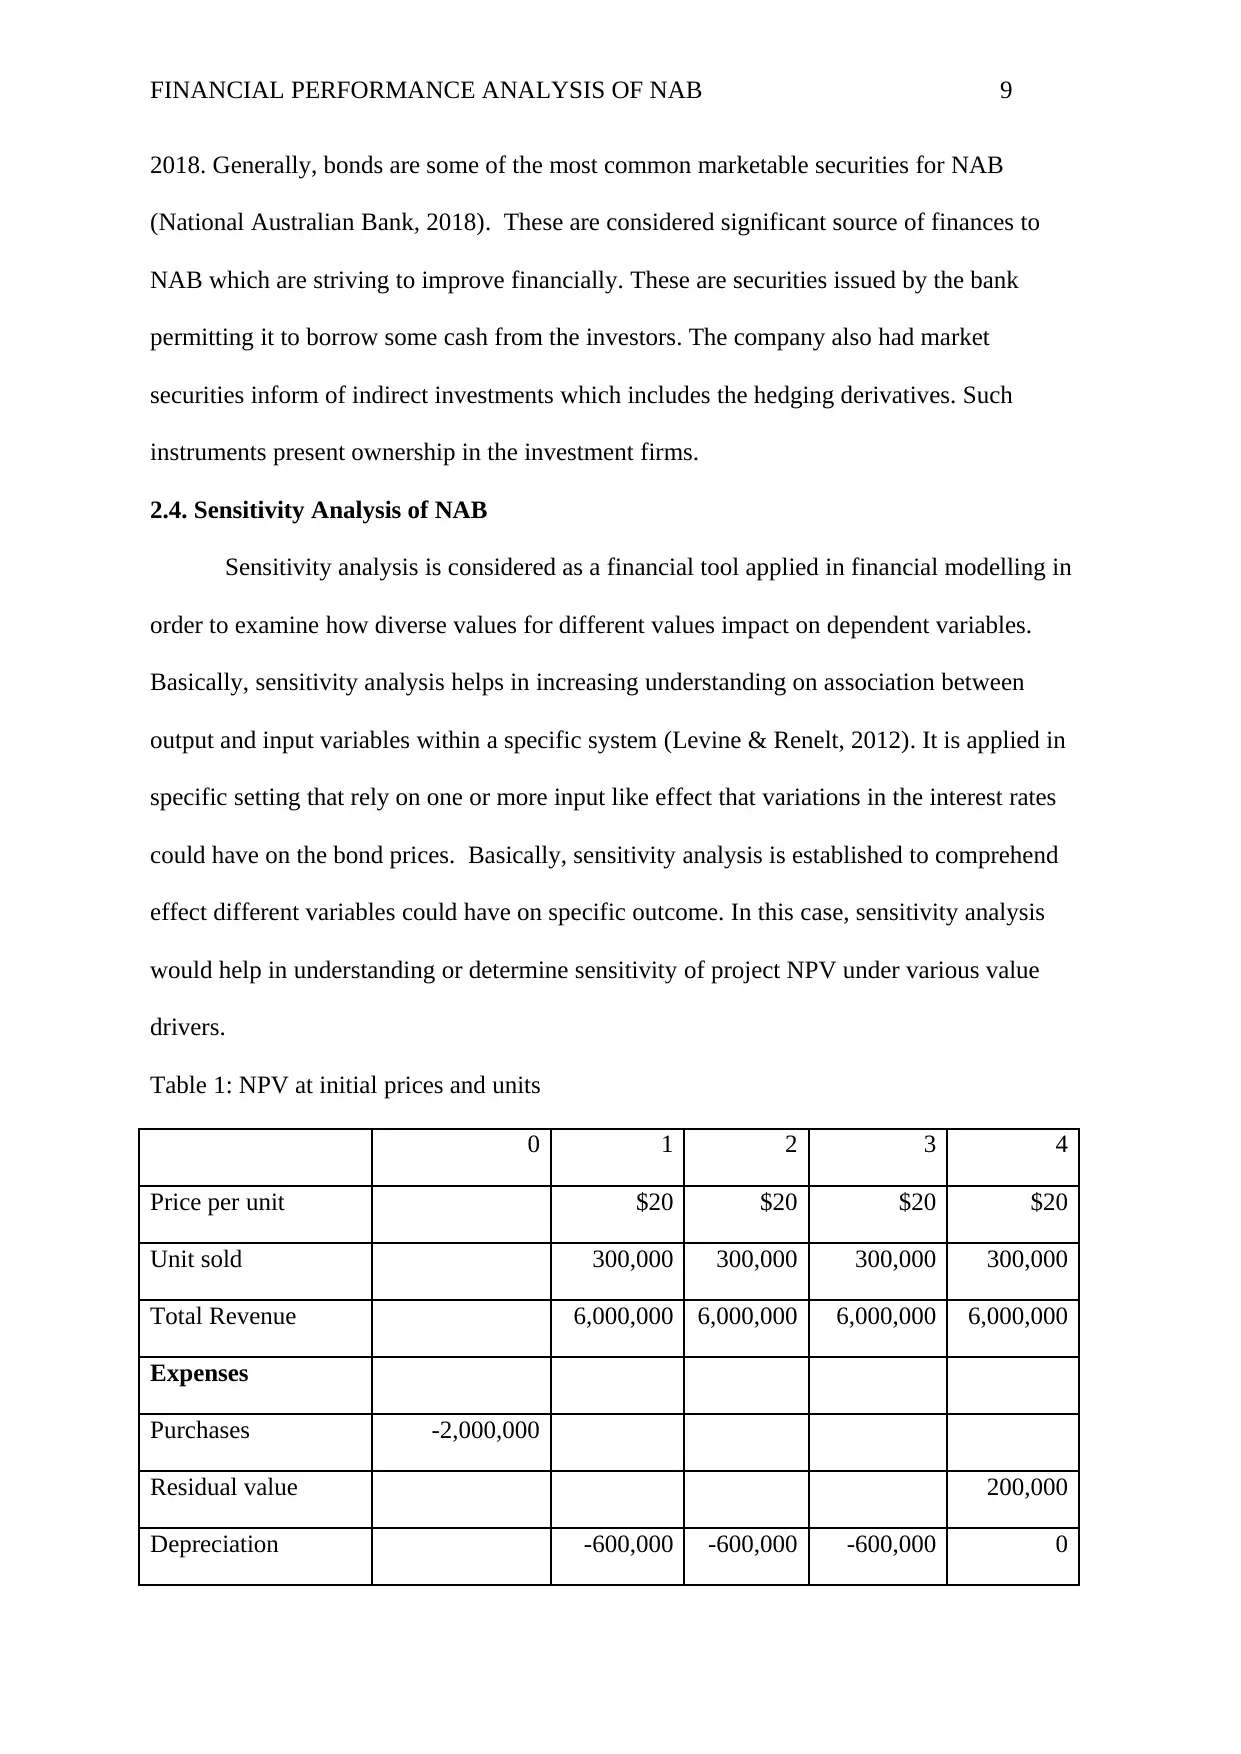
2.4. Sensitivity Analysis of NAB
Sensitivity analysis is considered as a financial tool applied in financial modelling in
order to examine how diverse values for different values impact on dependent variables.
Basically, sensitivity analysis helps in increasing understanding on association between
output and input variables within a specific system (Levine & Renelt, 2012). It is applied in
specific setting that rely on one or more input like effect that variations in the interest rates
could have on the bond prices. Basically, sensitivity analysis is established to comprehend
effect different variables could have on specific outcome. In this case, sensitivity analysis
would help in understanding or determine sensitivity of project NPV under various value
drivers.
Table 1: NPV at initial prices and units
0 1 2 3 4
Price per unit $20 $20 $20 $20
Unit sold 300,000 300,000 300,000 300,000
Total Revenue 6,000,000 6,000,000 6,000,000 6,000,000
Expenses
Purchases -2,000,000
Residual value 200,000
Depreciation -600,000 -600,000 -600,000 0
2018. Generally, bonds are some of the most common marketable securities for NAB
(National Australian Bank, 2018). These are considered significant source of finances to
NAB which are striving to improve financially. These are securities issued by the bank
permitting it to borrow some cash from the investors. The company also had market
securities inform of indirect investments which includes the hedging derivatives. Such
instruments present ownership in the investment firms.
2.4. Sensitivity Analysis of NAB
Sensitivity analysis is considered as a financial tool applied in financial modelling in
order to examine how diverse values for different values impact on dependent variables.
Basically, sensitivity analysis helps in increasing understanding on association between
output and input variables within a specific system (Levine & Renelt, 2012). It is applied in
specific setting that rely on one or more input like effect that variations in the interest rates
could have on the bond prices. Basically, sensitivity analysis is established to comprehend
effect different variables could have on specific outcome. In this case, sensitivity analysis
would help in understanding or determine sensitivity of project NPV under various value
drivers.
Table 1: NPV at initial prices and units
0 1 2 3 4
Price per unit $20 $20 $20 $20
Unit sold 300,000 300,000 300,000 300,000
Total Revenue 6,000,000 6,000,000 6,000,000 6,000,000
Expenses
Purchases -2,000,000
Residual value 200,000
Depreciation -600,000 -600,000 -600,000 0
⊘ This is a preview!⊘
Do you want full access?
Subscribe today to unlock all pages.
Trusted by 1+ million students worldwide
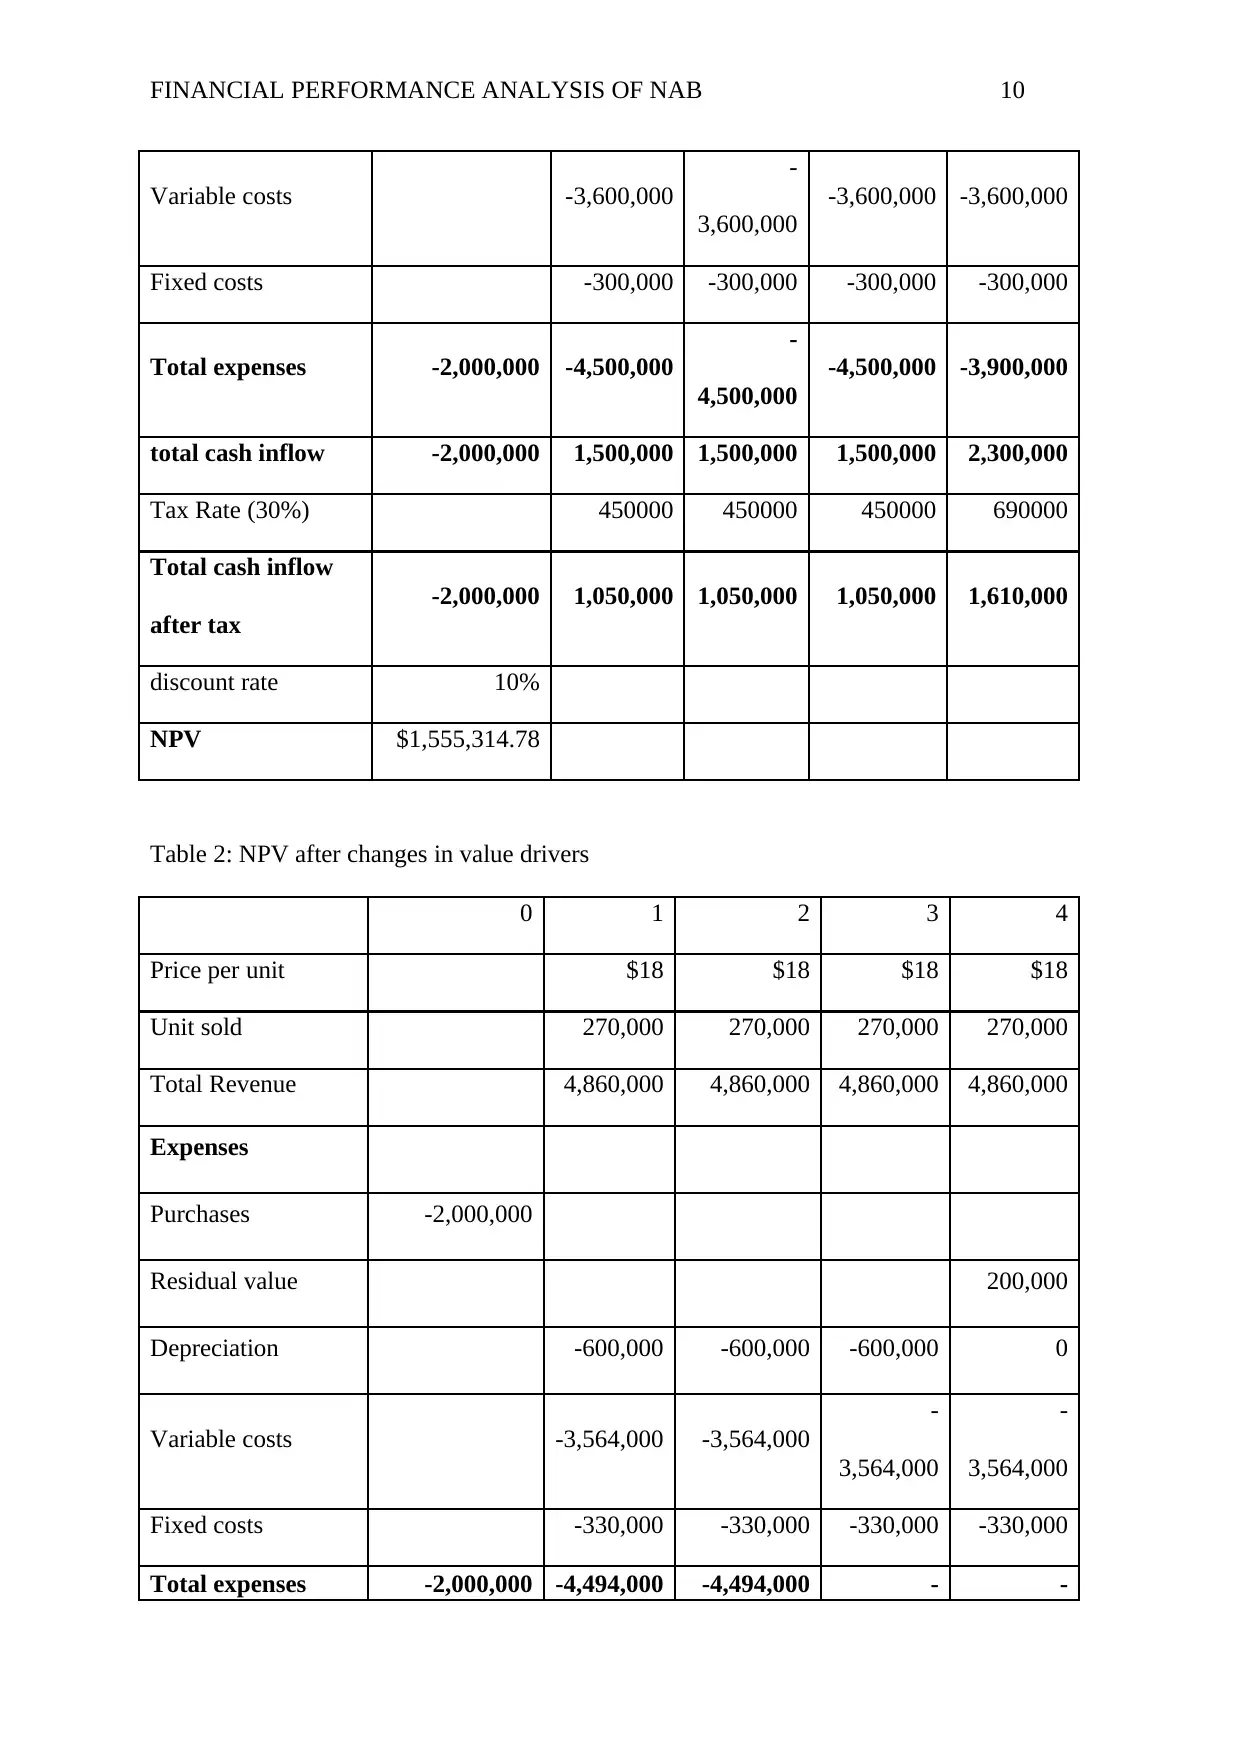
FINANCIAL PERFORMANCE ANALYSIS OF NAB 10
Variable costs -3,600,000
-
3,600,000
-3,600,000 -3,600,000
Fixed costs -300,000 -300,000 -300,000 -300,000
Total expenses -2,000,000 -4,500,000
-
4,500,000
-4,500,000 -3,900,000
total cash inflow -2,000,000 1,500,000 1,500,000 1,500,000 2,300,000
Tax Rate (30%) 450000 450000 450000 690000
Total cash inflow
after tax
-2,000,000 1,050,000 1,050,000 1,050,000 1,610,000
discount rate 10%
NPV $1,555,314.78
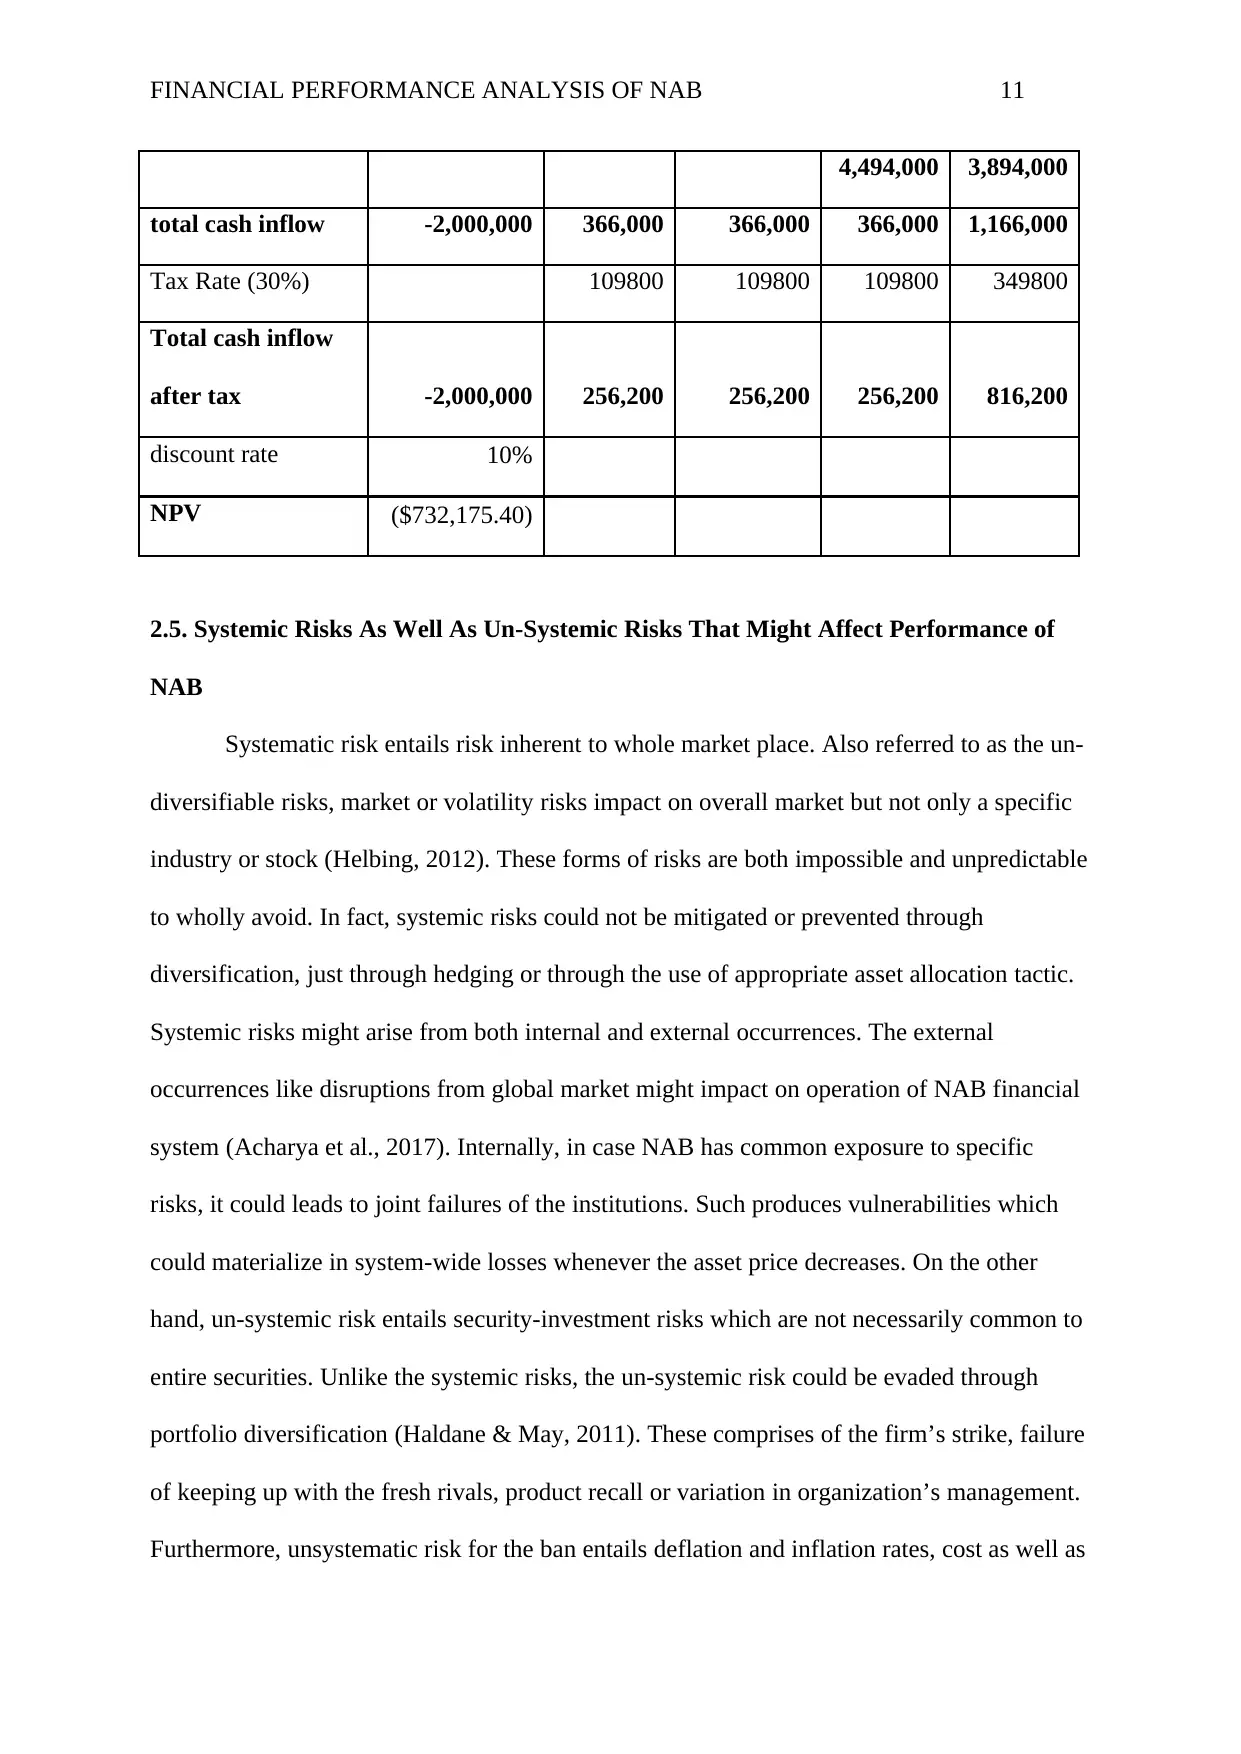
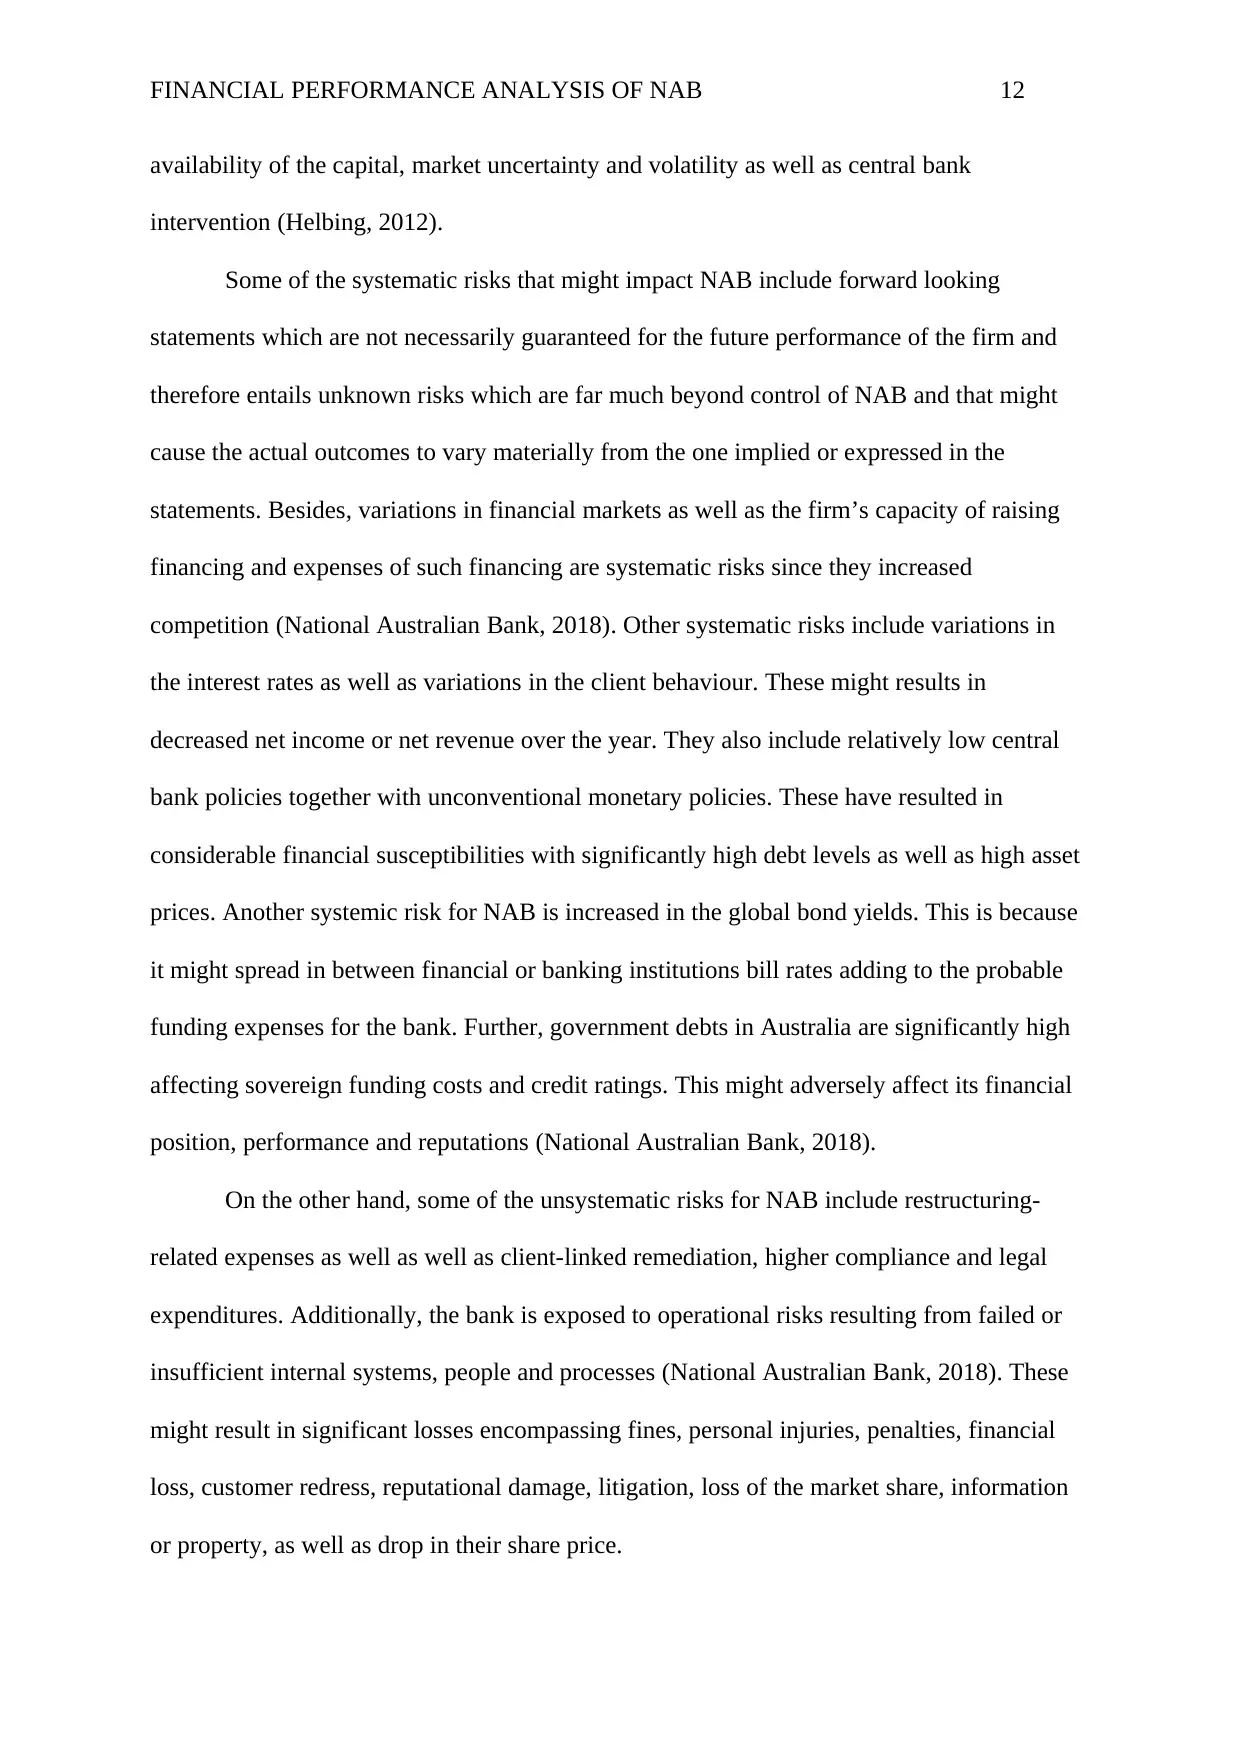
Table 2: NPV after changes in value drivers
0 1 2 3 4
Price per unit $18 $18 $18 $18
Unit sold 270,000 270,000 270,000 270,000
Total Revenue 4,860,000 4,860,000 4,860,000 4,860,000
Expenses
Purchases -2,000,000
Residual value 200,000
Depreciation -600,000 -600,000 -600,000 0
Variable costs -3,564,000 -3,564,000
-
3,564,000
-
3,564,000
Fixed costs -330,000 -330,000 -330,000 -330,000
Total expenses -2,000,000 -4,494,000 -4,494,000 - -
Variable costs -3,600,000
-
3,600,000
-3,600,000 -3,600,000
Fixed costs -300,000 -300,000 -300,000 -300,000
Total expenses -2,000,000 -4,500,000
-
4,500,000
-4,500,000 -3,900,000
total cash inflow -2,000,000 1,500,000 1,500,000 1,500,000 2,300,000
Tax Rate (30%) 450000 450000 450000 690000
Total cash inflow
after tax
-2,000,000 1,050,000 1,050,000 1,050,000 1,610,000
discount rate 10%
NPV $1,555,314.78
Table 2: NPV after changes in value drivers
0 1 2 3 4
Price per unit $18 $18 $18 $18
Unit sold 270,000 270,000 270,000 270,000
Total Revenue 4,860,000 4,860,000 4,860,000 4,860,000
Expenses
Purchases -2,000,000
Residual value 200,000
Depreciation -600,000 -600,000 -600,000 0
Variable costs -3,564,000 -3,564,000
-
3,564,000
-
3,564,000
Fixed costs -330,000 -330,000 -330,000 -330,000
Total expenses -2,000,000 -4,494,000 -4,494,000 - -
Paraphrase This Document
Need a fresh take? Get an instant paraphrase of this document with our AI Paraphraser
FINANCIAL PERFORMANCE ANALYSIS OF NAB 11
4,494,000 3,894,000
total cash inflow -2,000,000 366,000 366,000 366,000 1,166,000
Tax Rate (30%) 109800 109800 109800 349800
Total cash inflow
after tax -2,000,000 256,200 256,200 256,200 816,200
discount rate 10%
NPV ($732,175.40)
2.5. Systemic Risks As Well As Un-Systemic Risks That Might Affect Performance of
NAB
Systematic risk entails risk inherent to whole market place. Also referred to as the un-
diversifiable risks, market or volatility risks impact on overall market but not only a specific
industry or stock (Helbing, 2012). These forms of risks are both impossible and unpredictable
to wholly avoid. In fact, systemic risks could not be mitigated or prevented through
diversification, just through hedging or through the use of appropriate asset allocation tactic.
Systemic risks might arise from both internal and external occurrences. The external
occurrences like disruptions from global market might impact on operation of NAB financial
system (Acharya et al., 2017). Internally, in case NAB has common exposure to specific
risks, it could leads to joint failures of the institutions. Such produces vulnerabilities which
could materialize in system-wide losses whenever the asset price decreases. On the other
hand, un-systemic risk entails security-investment risks which are not necessarily common to
entire securities. Unlike the systemic risks, the un-systemic risk could be evaded through
portfolio diversification (Haldane & May, 2011). These comprises of the firm’s strike, failure
of keeping up with the fresh rivals, product recall or variation in organization’s management.
Furthermore, unsystematic risk for the ban entails deflation and inflation rates, cost as well as
FINANCIAL PERFORMANCE ANALYSIS OF NAB 12
availability of the capital, market uncertainty and volatility as well as central bank
intervention (Helbing, 2012).
Some of the systematic risks that might impact NAB include forward looking
statements which are not necessarily guaranteed for the future performance of the firm and
therefore entails unknown risks which are far much beyond control of NAB and that might
cause the actual outcomes to vary materially from the one implied or expressed in the
statements. Besides, variations in financial markets as well as the firm’s capacity of raising
financing and expenses of such financing are systematic risks since they increased
competition (National Australian Bank, 2018). Other systematic risks include variations in
the interest rates as well as variations in the client behaviour. These might results in
decreased net income or net revenue over the year. They also include relatively low central
bank policies together with unconventional monetary policies. These have resulted in
considerable financial susceptibilities with significantly high debt levels as well as high asset
prices. Another systemic risk for NAB is increased in the global bond yields. This is because
it might spread in between financial or banking institutions bill rates adding to the probable
funding expenses for the bank. Further, government debts in Australia are significantly high
affecting sovereign funding costs and credit ratings. This might adversely affect its financial
position, performance and reputations (National Australian Bank, 2018).
On the other hand, some of the unsystematic risks for NAB include restructuring-
related expenses as well as well as client-linked remediation, higher compliance and legal
expenditures. Additionally, the bank is exposed to operational risks resulting from failed or
insufficient internal systems, people and processes (National Australian Bank, 2018). These
might result in significant losses encompassing fines, personal injuries, penalties, financial
loss, customer redress, reputational damage, litigation, loss of the market share, information
or property, as well as drop in their share price.
⊘ This is a preview!⊘
Do you want full access?
Subscribe today to unlock all pages.
Trusted by 1+ million students worldwide
1 out of 17
Related Documents


Your All-in-One AI-Powered Toolkit for Academic Success.
+13062052269
info@desklib.com
Available 24*7 on WhatsApp / Email
![[object Object]](/_next/static/media/star-bottom.7253800d.svg)
Unlock your academic potential
Copyright © 2020–2026 A2Z Services. All Rights Reserved. Developed and managed by ZUCOL.