Statistical Report: Analysis of Nando's Business and Economic Data
VerifiedAdded on 2020/12/09
|13
|2863
|486
Report
AI Summary
This report presents a statistical analysis of Nando's, a popular restaurant chain, examining its business and economic data. It begins with an executive summary and introduction to statistical analysis, highlighting its importance in business decision-making. The report then delves into the nature and purpose of Nando's data, evaluating its economic performance and growth. Various data analysis methods are employed, including mean, standard deviation, and regression analysis, to assess the company's performance. The report also explores sample size determination and hypothesis testing methodologies. Furthermore, it examines the differences between descriptive, exploratory, and confirmatory analysis techniques, along with the application of deductive and inductive approaches. The report concludes by providing an overview of sample data sets, such as pie charts and histograms, to illustrate the statistical concepts discussed. This comprehensive analysis offers insights into Nando's business operations and the application of statistical methods in a real-world context.
STATISTICS
FOR
MANAGEMENT
FOR
MANAGEMENT
Paraphrase This Document
Need a fresh take? Get an instant paraphrase of this document with our AI Paraphraser
Table of Contents
EXECUTIVE SUMMARY.............................................................................................................3
INTRODUCTION...........................................................................................................................1
TASK 1............................................................................................................................................1
P1 Evaluating the nature and purpose of the NANDO'S and economical data/ information 1
P2 Evaluation of the data from a variety of sources using different methods of analysation 2
Fig.1. Hypothesis analysis..........................5
M1 Evaluating the methods of the analysation used to present the business and economic
data/ information....................................................................................................................5
D1 Examining the differences in implementation between methods of descriptive,
exploratory and confirmatory analysis of business and economic data ................................6
Deductive and Inductive approach.........................................................................................6
Sample sets of data.................................................................................................................6
CONCLUSION................................................................................................................................9
REFERENCES .............................................................................................................................10
EXECUTIVE SUMMARY
This report summarises as the nature and process of business and economic information
from a range of different published source. Apart from this, data evaluation has also been
explained in this report with help of various methods of analysis. As difference in application
methods of descriptive, exploratory and confirmatory analysis of business and economic data has
been explained.
⊘ This is a preview!⊘
Do you want full access?
Subscribe today to unlock all pages.
Trusted by 1+ million students worldwide
INTRODUCTION
Statistical analysis is a component of data analytics which includes collecting and
scrutinizing every data sample in a set of items from which sample can be drawn. These data are
very helpful for the business and its manager as it is helpful in process of decision making. The
main characteristics of statistical data is that they are raw in nature and it is beneficial in decision
making and policy making. Statistical knowledge is helpful in collecting effective data and
employing correct analysis for these data in order to make decision on basis of data and for
forecasting data. These data are very beneficial for organisation in order to attain business
objectives and goals. Statistics involves the statistical units for research, statistical techniques,
collection of units or data and analysation after that interpretation.
This report pertain the statistical analysis of the NANDO'S , and African chicken
restaurant which was established in 1987 by two young men, in Johannesburg, South Africa with
a motive to to provide most delicious chicken in South Africa. Moreover, in order to provide
the systematic report the brief analysation of statistics for management of NANDO'S Africa,
power point presentation of its information and attractive posters in order to examine properly in
attractive manner.
TASK 1
P1 Evaluating the nature and purpose of the NANDO'S and economical data/ information
NANDO'S is the most famous non-veg restaurant established in 1987 in South Africa, by
two young men, their dream was to facilitate the taste of delicious chicken to the people of South
Africa as well as across the world (Keller, 2015). The Chicken provided by NANDO'S is fresh
flame -grilled and prepared in a PERi-PERi marinade. It was Mozambican street food, inspired
by the colonial influences of the Portuguese cooking. The NANDO'S PERi-PERi chicken has
the massive global taste. The organisation provides the delicious chicken in 1200 restaurants
across 35 countries. The restaurant is very popular in UK, Australia, South Africa and USA for
it's delicious chicken.
Besides providing the delicious chicken the range of master classes covering the finance,
employee relations, operational processes and leadership. Conducted quarterly for the better
support to the organisation. The organisation plans to open 20 new restaurant this year and have
6300 employees in all restaurants across the world. The organisation attained the excellent scores
1
Paraphrase This Document
Need a fresh take? Get an instant paraphrase of this document with our AI Paraphraser
for well being the manager, the team work and managing the other fields of the organisation.
Also the organisation came second for leadership and achieved the third place positions for fair
deal, not only this the NANDO'S also managed 72% of personal growth. The organisation wants
to expand it's branches throughout the world by distributing it's franchisee to the local restaurants
of the different regions of different nations of the world.
The purpose of the business is to facilitates delicious PERi-PERi chicken throughout the
world in different countries in order to expand the business in across the world and to promote
the brand by distributing the franchise of the restaurant to different restaurants of different
regions of different countries. Along with this motive the economic data or the business
performance of the NANDO'S is quite impressive and growing towards the achievements of
desired targets. The organisation is a casual dinning restaurant operating with 1200 restaurants in
35 countries of the world, since 1987. NANDO'S progressing with a higher rate then its industry
as restaurant business is growing at 11.9% while the revenues of the organisation increases by
13.9% in last preceding year. In context of gross profit which was £189m in last financial year
and in current year after increment it reached to £194.7m, it indicates the growth or increment
rate of 113.7% in its gross profits. Although in previous year unfortunately the organisation
incurred loss which was charged by the goodwill of the organisation, thus it results in decrement
in value of goodwill from £341.6m to £331.1m, it happened because of the wreckage loss of
£12.7m. Incurred by the organisation in last preceding year. The organisation held enough liquid
position as the cash operations are efficient as cash flow statement shows a tremendous growth
£407 to £3727 which is 8.15 times in comparison of last year.
P2 Evaluation of the data from a variety of sources using different methods of analysation
The NANDO'S has the impressive growth rate and organisation expanding the business
throughout the world. There are several methods used to analyse the performance and the
progress of the organisation. Not only this there are several methods of organisational data
analysis, as there are two types of the data; qualitative and quantitative data in the performance
report of the organisation. Both the quantitative and qualitative data is essential to analyse in
order to know the organisation's actual performance and there are different methods used for the
analysation of NANDO'S which are as follows.
Mean: The arithmetic mean is the data analysing method most commonly, as the the
arithmetic mean used as the 'average unit' (Gentle, Härdle and Mori, 2012). The mean is crucial
2
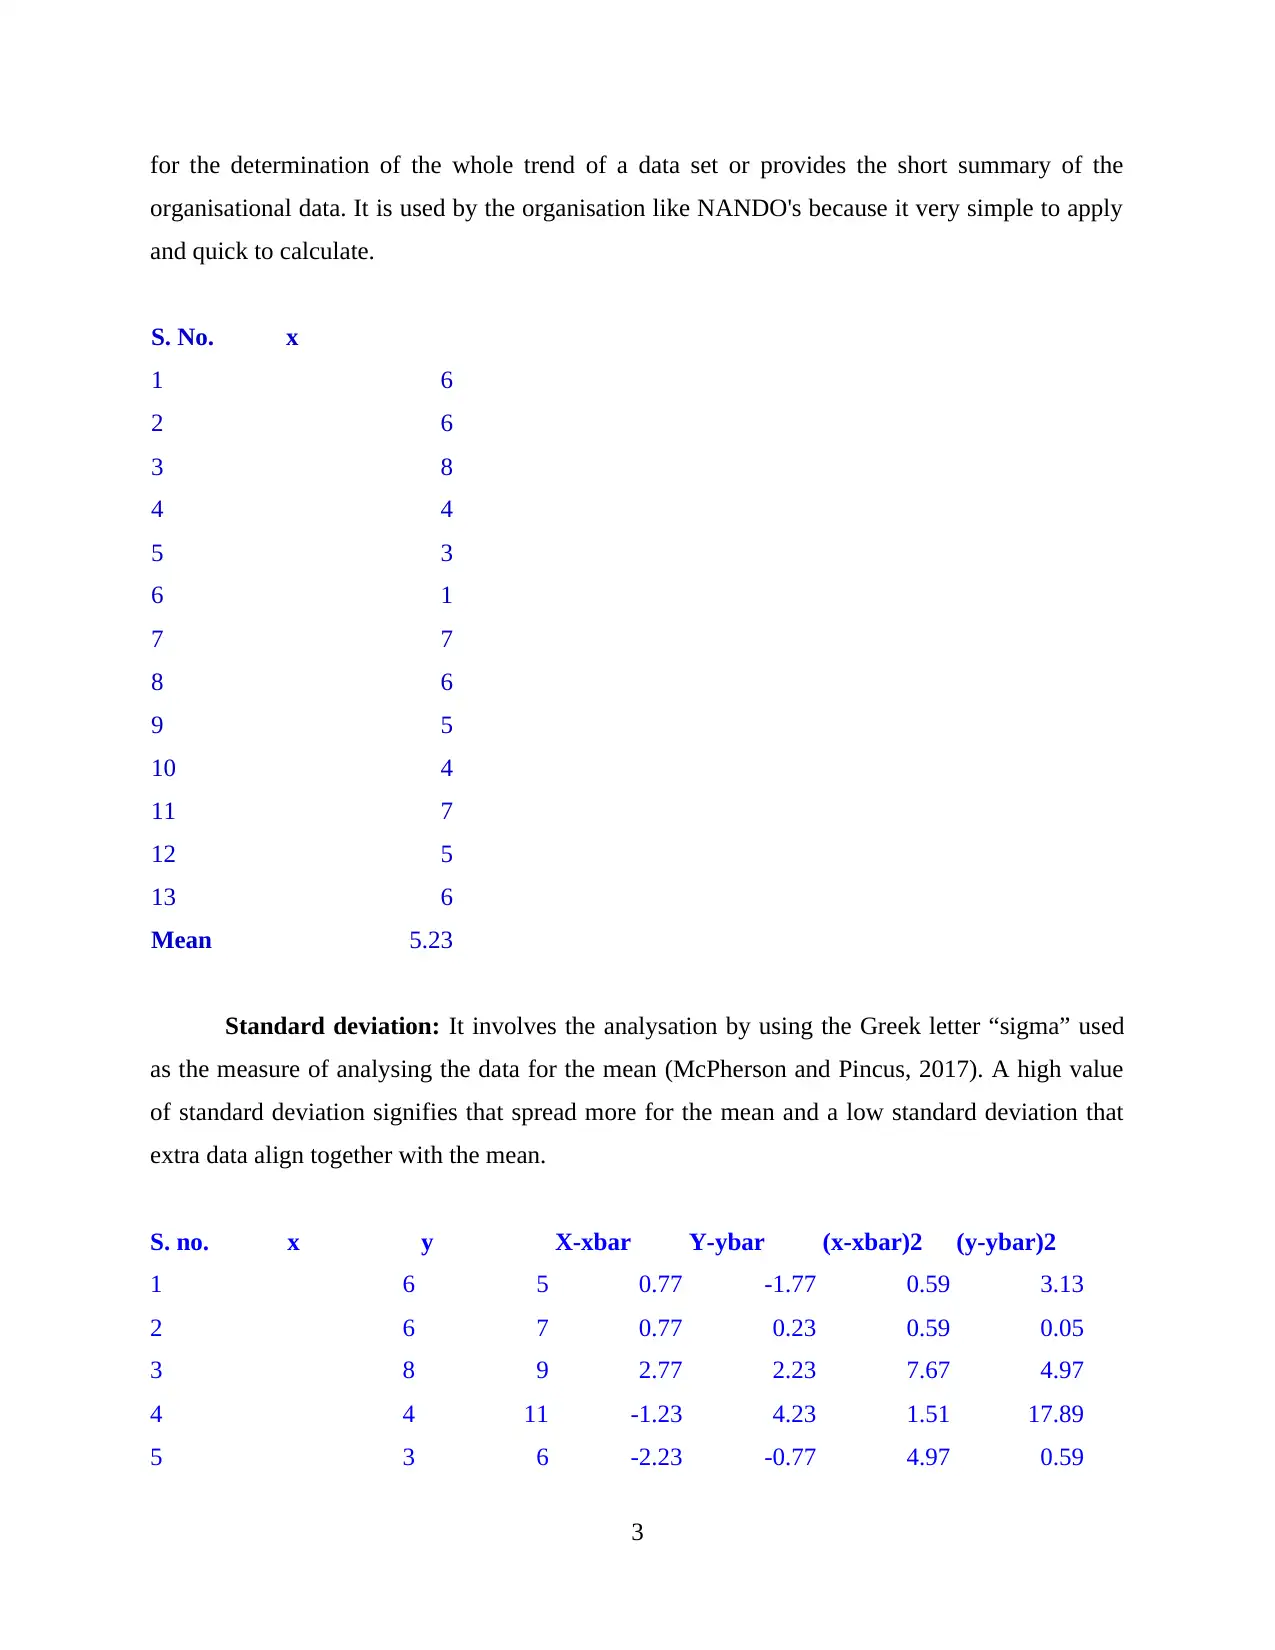
for the determination of the whole trend of a data set or provides the short summary of the
organisational data. It is used by the organisation like NANDO's because it very simple to apply
and quick to calculate.
S. No. x
1 6
2 6
3 8
4 4
5 3
6 1
7 7
8 6
9 5
10 4
11 7
12 5
13 6
Mean 5.23
Standard deviation: It involves the analysation by using the Greek letter “sigma” used
as the measure of analysing the data for the mean (McPherson and Pincus, 2017). A high value
of standard deviation signifies that spread more for the mean and a low standard deviation that
extra data align together with the mean.
S. no. x y X-xbar Y-ybar (x-xbar)2 (y-ybar)2
1 6 5 0.77 -1.77 0.59 3.13
2 6 7 0.77 0.23 0.59 0.05
3 8 9 2.77 2.23 7.67 4.97
4 4 11 -1.23 4.23 1.51 17.89
5 3 6 -2.23 -0.77 4.97 0.59
3
⊘ This is a preview!⊘
Do you want full access?
Subscribe today to unlock all pages.
Trusted by 1+ million students worldwide
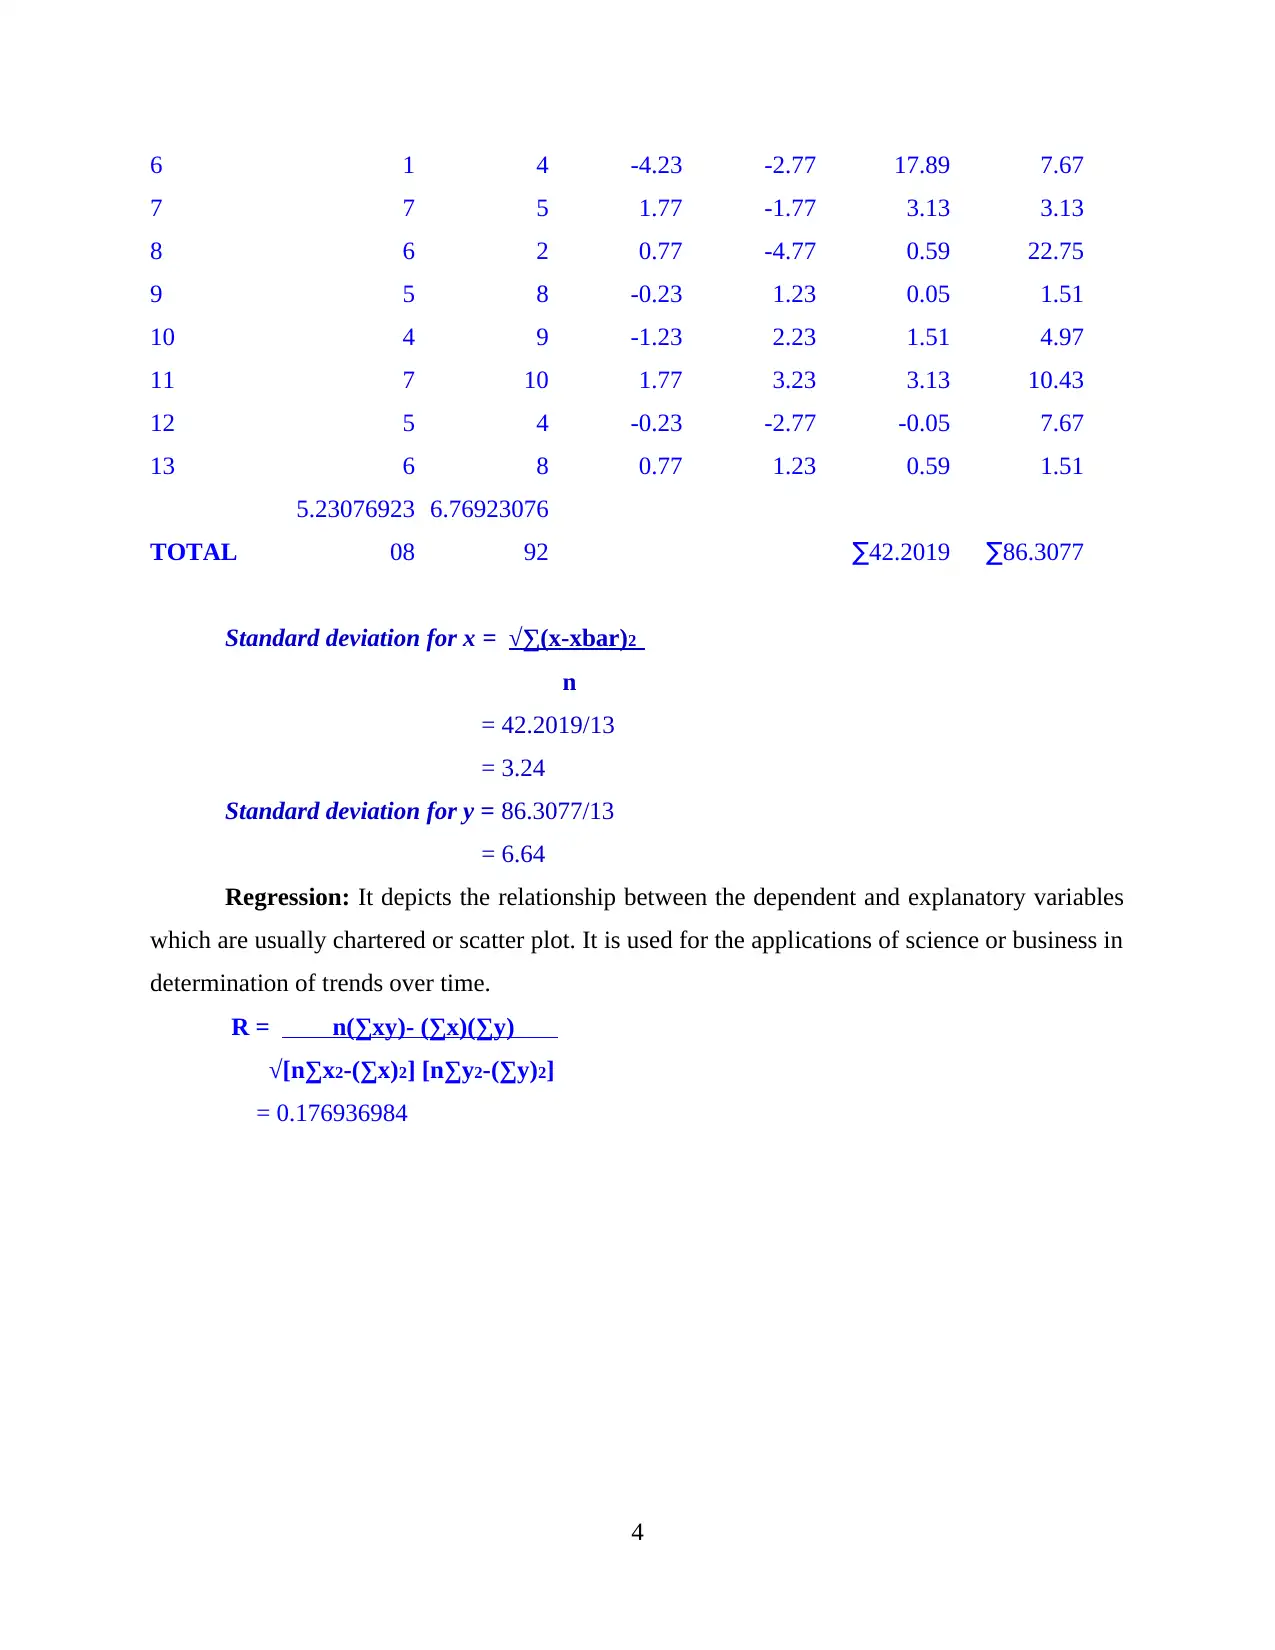
6 1 4 -4.23 -2.77 17.89 7.67
7 7 5 1.77 -1.77 3.13 3.13
8 6 2 0.77 -4.77 0.59 22.75
9 5 8 -0.23 1.23 0.05 1.51
10 4 9 -1.23 2.23 1.51 4.97
11 7 10 1.77 3.23 3.13 10.43
12 5 4 -0.23 -2.77 -0.05 7.67
13 6 8 0.77 1.23 0.59 1.51
TOTAL
5.23076923
08
6.76923076
92 ∑42.2019 ∑86.3077
Standard deviation for x = √∑(x-xbar)2
n
= 42.2019/13
= 3.24
Standard deviation for y = 86.3077/13
= 6.64
Regression: It depicts the relationship between the dependent and explanatory variables
which are usually chartered or scatter plot. It is used for the applications of science or business in
determination of trends over time.
R = n(∑xy)- (∑x)(∑y)
√[n∑x2-(∑x)2] [n∑y2-(∑y)2]
= 0.176936984
4
Paraphrase This Document
Need a fresh take? Get an instant paraphrase of this document with our AI Paraphraser
1 2 3 4 5 6 7 8 9 10 11 12 13 14
-8
-6
-4
-2
0
2
4
6
Y-ybar
X-xbar
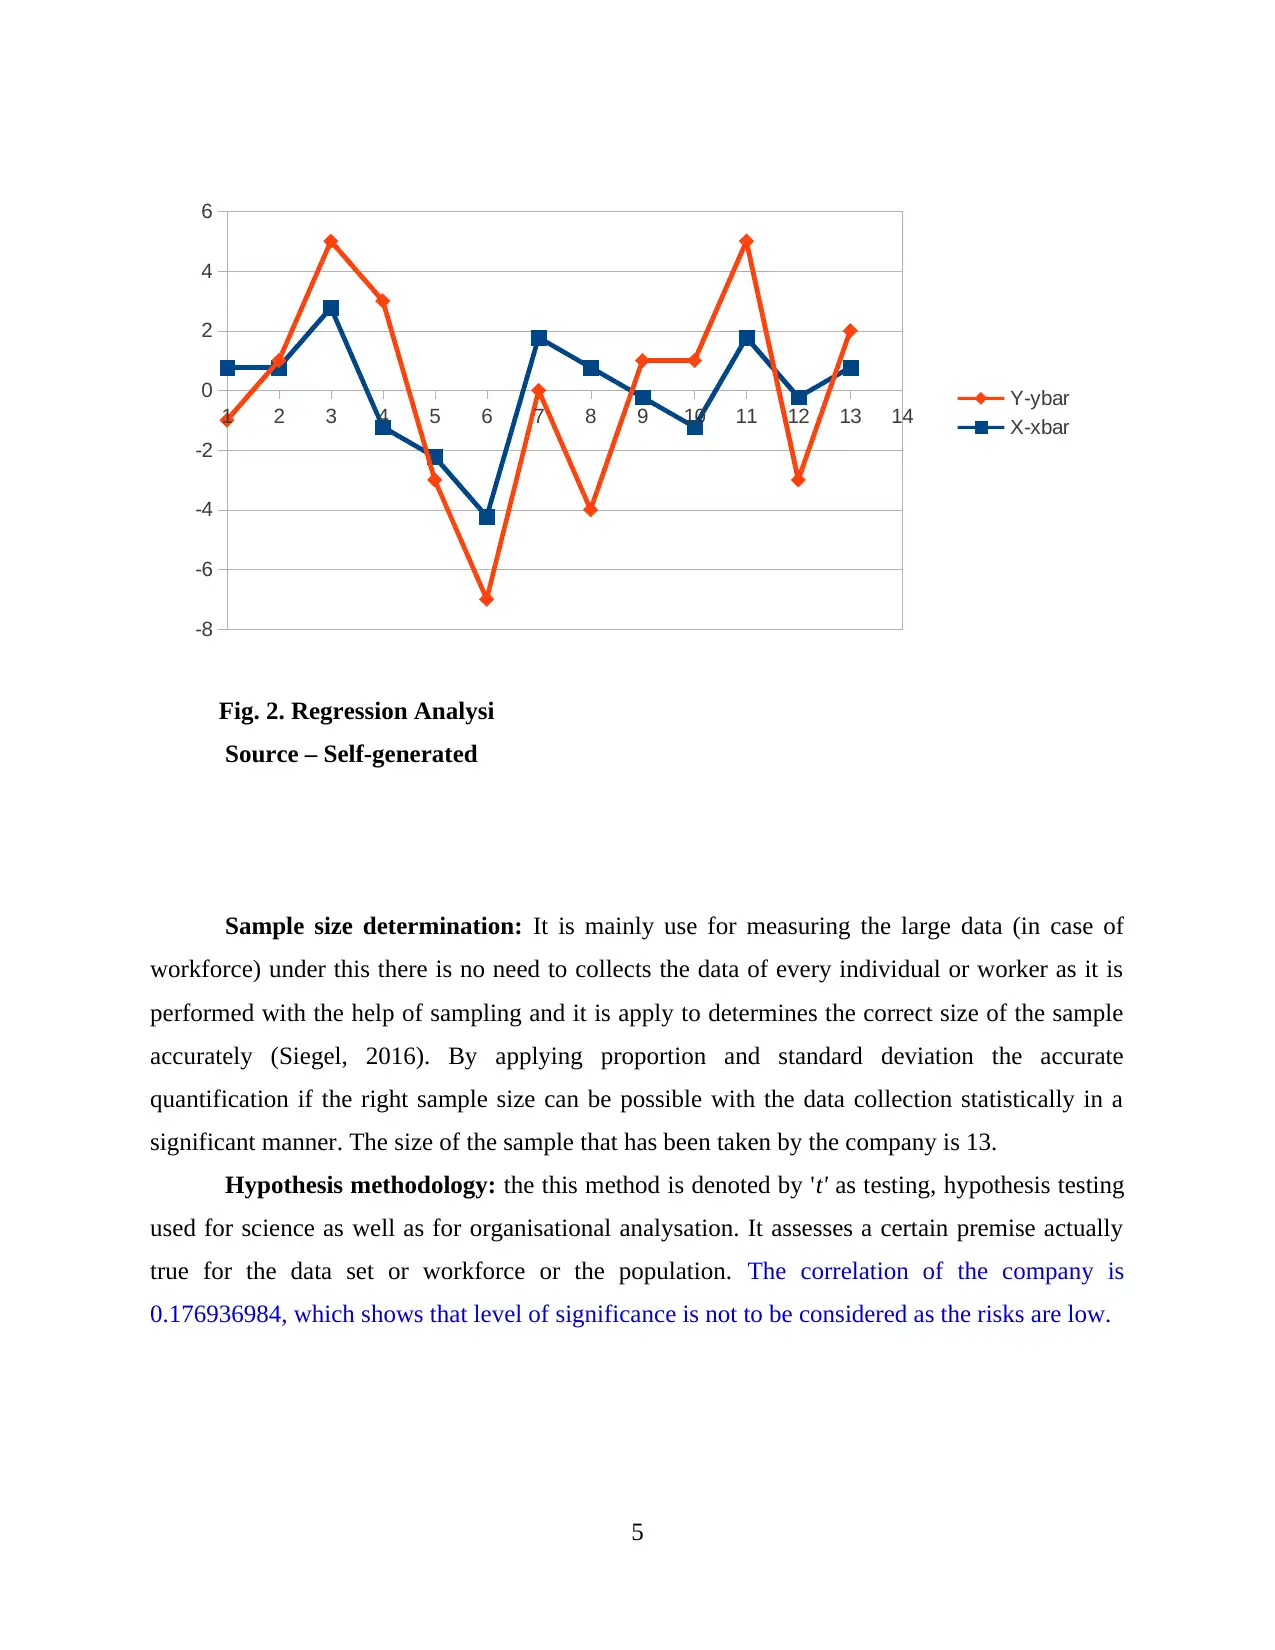
Fig. 2. Regression Analysi
Source – Self-generated
Sample size determination: It is mainly use for measuring the large data (in case of
workforce) under this there is no need to collects the data of every individual or worker as it is
performed with the help of sampling and it is apply to determines the correct size of the sample
accurately (Siegel, 2016). By applying proportion and standard deviation the accurate
quantification if the right sample size can be possible with the data collection statistically in a
significant manner. The size of the sample that has been taken by the company is 13.
Hypothesis methodology: the this method is denoted by 't' as testing, hypothesis testing
used for science as well as for organisational analysation. It assesses a certain premise actually
true for the data set or workforce or the population. The correlation of the company is
0.176936984, which shows that level of significance is not to be considered as the risks are low.
5
-8
-6
-4
-2
0
2
4
6
Y-ybar
X-xbar
Fig. 2. Regression Analysi
Source – Self-generated
Sample size determination: It is mainly use for measuring the large data (in case of
workforce) under this there is no need to collects the data of every individual or worker as it is
performed with the help of sampling and it is apply to determines the correct size of the sample
accurately (Siegel, 2016). By applying proportion and standard deviation the accurate
quantification if the right sample size can be possible with the data collection statistically in a
significant manner. The size of the sample that has been taken by the company is 13.
Hypothesis methodology: the this method is denoted by 't' as testing, hypothesis testing
used for science as well as for organisational analysation. It assesses a certain premise actually
true for the data set or workforce or the population. The correlation of the company is
0.176936984, which shows that level of significance is not to be considered as the risks are low.
5

H0 H1
0
0.2
0.4
0.6
0.8
1
1.2
0.176936984
1
Fig.1. Hypothesis analysis
Source: Self-generated
M1 Evaluating the methods of the analysation used to present the business and economic data/
information
The methods used for the analysation of the present business and economic data are
calculation of Mean, standard deviation, sample size determination and hypothesis methodology
are used for the quantification of the organisational data as well as the economic data. It is
essential to determine the accurate values of organisational information and it is also beneficial
in identification and rectification of the errors in collection, sampling and analysation of the
organisational as well as the economic data.
D1 Examining the differences in implementation between methods of descriptive, exploratory
and confirmatory analysis of business and economic data
According to the Karabag and Berggren, (2014), the difference between methods and their
application in business and economic data are as follows.
Descriptive statistics: It is summarized form of collective information based on samples
and not developed on probability basis. Measures like central tenancy and variability are
used to describe data. Example- papers reporting on human subjects.
Inferential statistics: A random sample from population is taken to make conclusion
about public. This statistics is used when examination of all population is not possible.
Example- quantifying the parameters about the population and hypothesis testing.
6
⊘ This is a preview!⊘
Do you want full access?
Subscribe today to unlock all pages.
Trusted by 1+ million students worldwide
Confirmatory analysis: It is used to measure and understand the nature of the construct
or factor, it means the analyze the data of hypothesis measurement model which is based
on the analytical research and theories about the data or facts.
Deductive and Inductive approach
Inductive approach is a qualitative method of content analysis which is used to develop
theory and identify themes of studying documents, recordings and other verbal material. This can
be used by business by analysis of studying documents and other verbal material.
Deductive approach mainly focuses on the aimed and testing theories. This helps to
explain the casual relationship between concepts and variables. By knowing the casual
relationship between concepts and other variables business can avoid risk and can get benefit
throughout their business.
Sample sets of data
A data sample is a set of data which collected from a statistical population by define
procedure. The sample usually represents a subset of manageable size. The different sample are
discussed as below:
Pie chart:
A pie chart is a statistical graphic which is divided into slices in order to illustrate
numerical proportion. It is used for showing percentage or proportional data and usually the
percentage represented by each category is provided next to corresponding slice of pie. These
charts are useful for displaying data for around 6 categories or fewer.
Histogram:
A histogram is useful for summarize discrete or continuous data. It gives a visual
representation of numerical data by displaying various data points which fall within a specified
range of values. It is important in determining by median and distribution of data.
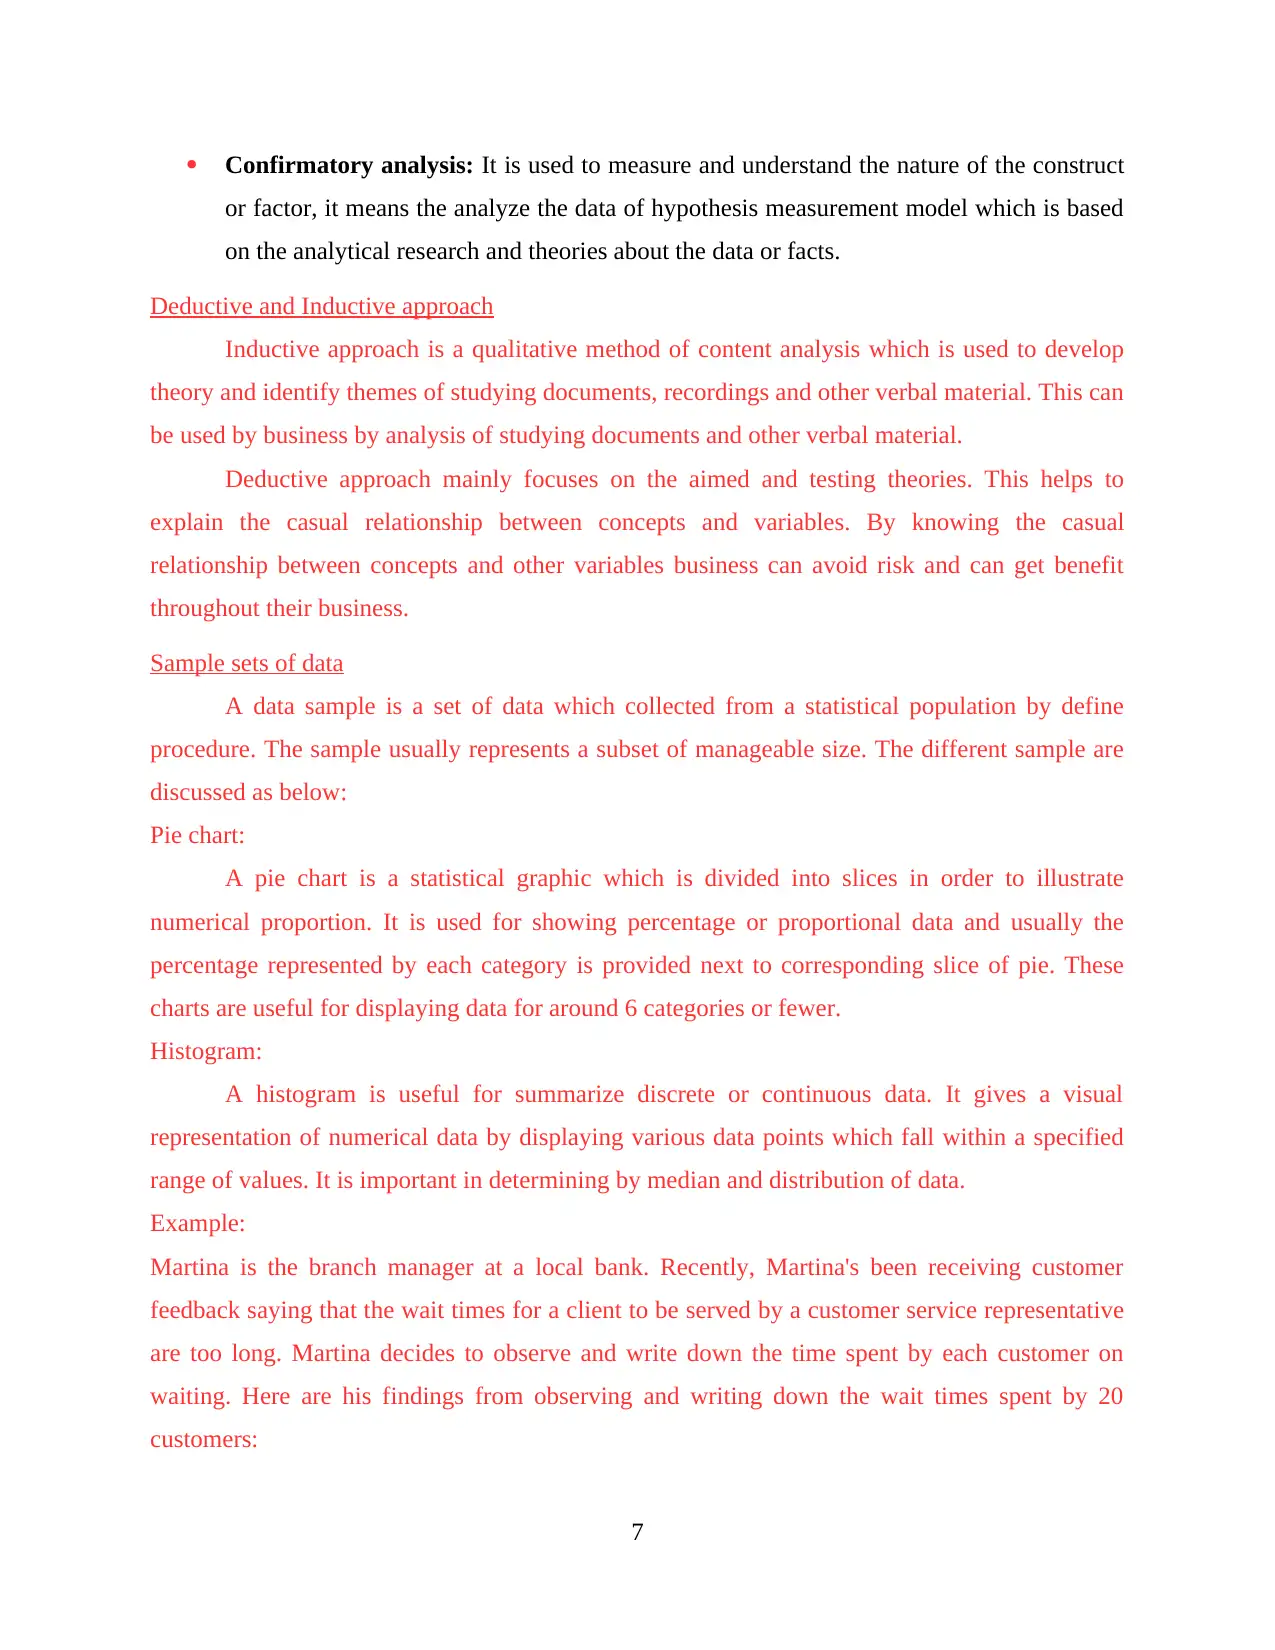
Example:
Martina is the branch manager at a local bank. Recently, Martina's been receiving customer
feedback saying that the wait times for a client to be served by a customer service representative
are too long. Martina decides to observe and write down the time spent by each customer on
waiting. Here are his findings from observing and writing down the wait times spent by 20
customers:
7
or factor, it means the analyze the data of hypothesis measurement model which is based
on the analytical research and theories about the data or facts.
Deductive and Inductive approach
Inductive approach is a qualitative method of content analysis which is used to develop
theory and identify themes of studying documents, recordings and other verbal material. This can
be used by business by analysis of studying documents and other verbal material.
Deductive approach mainly focuses on the aimed and testing theories. This helps to
explain the casual relationship between concepts and variables. By knowing the casual
relationship between concepts and other variables business can avoid risk and can get benefit
throughout their business.
Sample sets of data
A data sample is a set of data which collected from a statistical population by define
procedure. The sample usually represents a subset of manageable size. The different sample are
discussed as below:
Pie chart:
A pie chart is a statistical graphic which is divided into slices in order to illustrate
numerical proportion. It is used for showing percentage or proportional data and usually the
percentage represented by each category is provided next to corresponding slice of pie. These
charts are useful for displaying data for around 6 categories or fewer.
Histogram:
A histogram is useful for summarize discrete or continuous data. It gives a visual
representation of numerical data by displaying various data points which fall within a specified
range of values. It is important in determining by median and distribution of data.
Example:
Martina is the branch manager at a local bank. Recently, Martina's been receiving customer
feedback saying that the wait times for a client to be served by a customer service representative
are too long. Martina decides to observe and write down the time spent by each customer on
waiting. Here are his findings from observing and writing down the wait times spent by 20
customers:
7
Paraphrase This Document
Need a fresh take? Get an instant paraphrase of this document with our AI Paraphraser
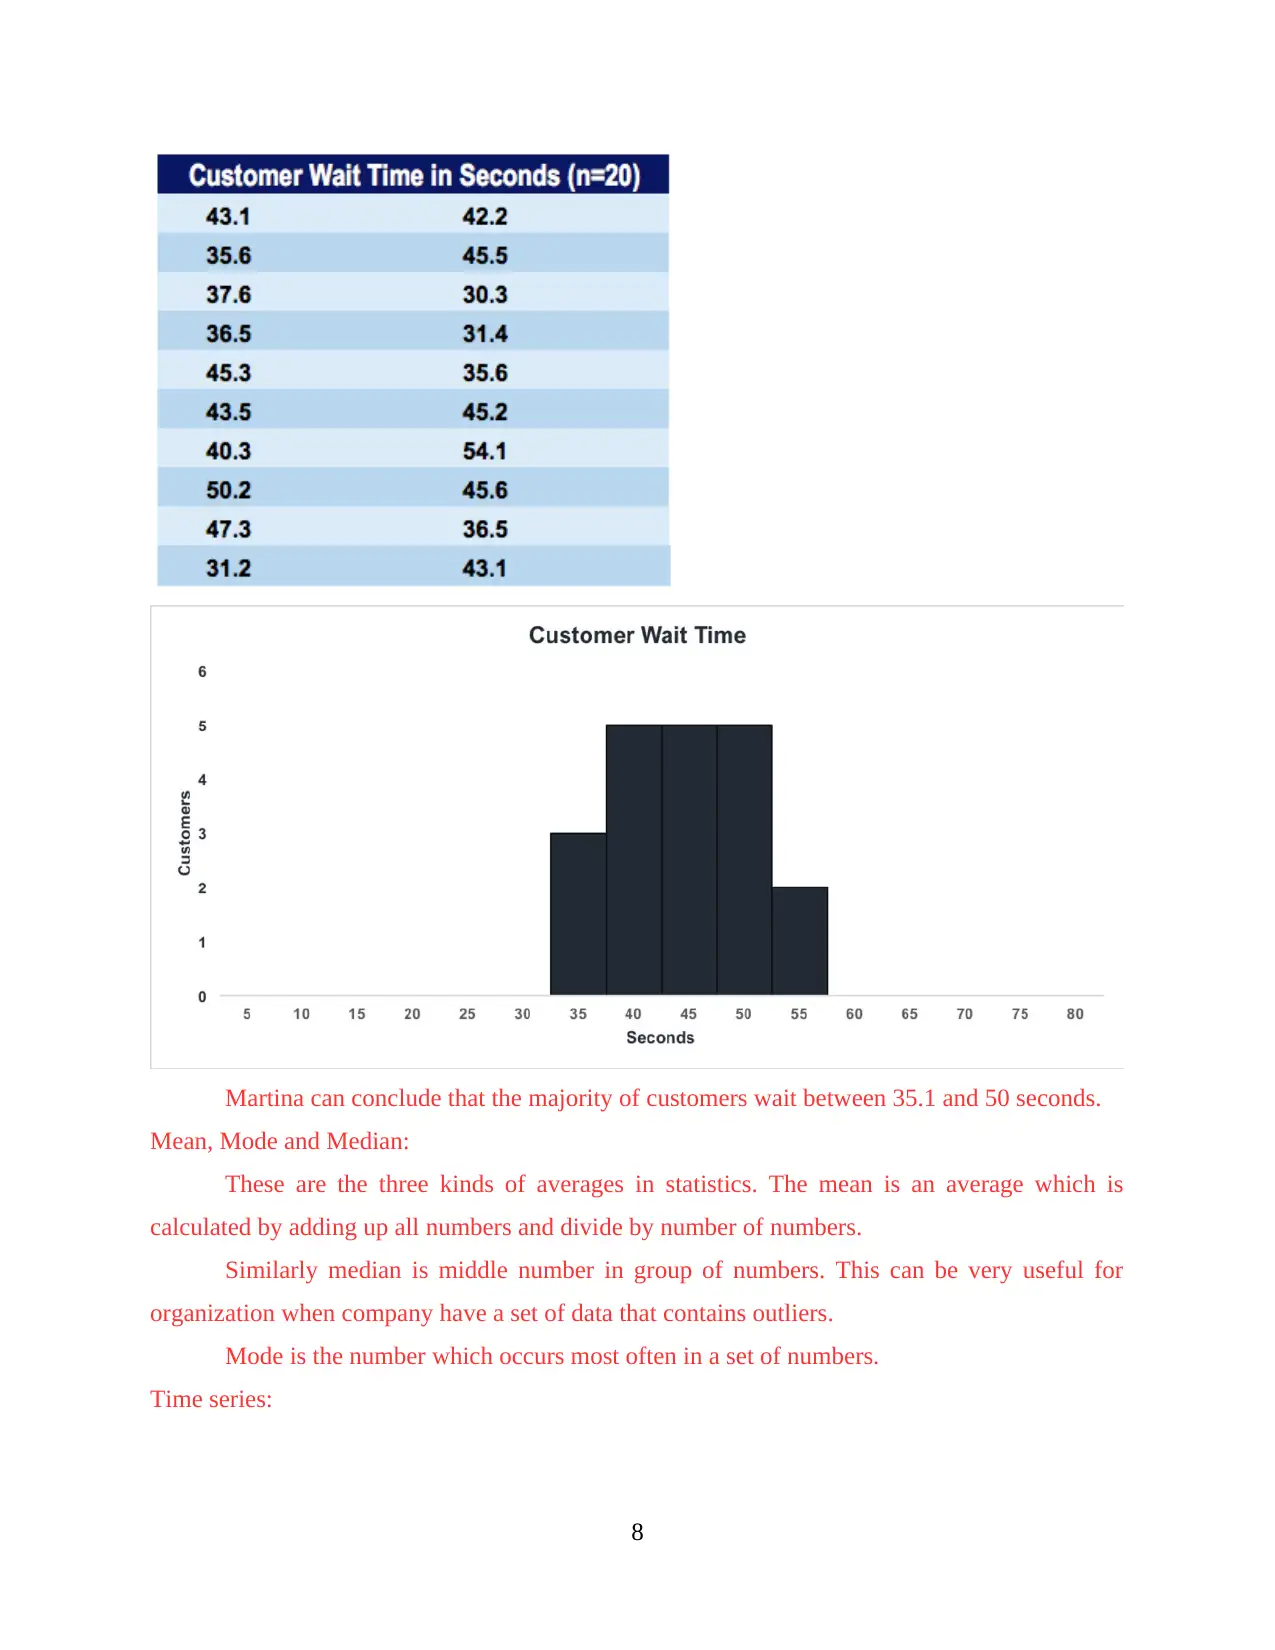
Martina can conclude that the majority of customers wait between 35.1 and 50 seconds.
Mean, Mode and Median:
These are the three kinds of averages in statistics. The mean is an average which is
calculated by adding up all numbers and divide by number of numbers.
Similarly median is middle number in group of numbers. This can be very useful for
organization when company have a set of data that contains outliers.
Mode is the number which occurs most often in a set of numbers.
Time series:
8
A time series is a sequence of numerical data points in successive orders. It is a statistical
method for analyzing time series data and extract meaningful statistics and characteristics about
data.
Correlation:
It is the linear relationship between continuous variables such as height and weight. It
measures the strength and direction of linear relationship between two or more variables. This
value always lies between +1 to -1.
Probability distribution:
The probability distribution is a statistical function which describes all the realizable
value and a random variables within a given range. As business can take these risk into account
when making investment decisions with help of probability.
CONCLUSION
In the conclusion it can be said that statistical data are crucial part for business and its
manager in order to take valuable decisions. There are different kinds of economical data and
information which is used by organization. These statistical methods helps to accomplish
business objective and take competitive advantage. There are different approaches such as
deductive and inductive approach.
9
⊘ This is a preview!⊘
Do you want full access?
Subscribe today to unlock all pages.
Trusted by 1+ million students worldwide
1 out of 13
Related Documents


Your All-in-One AI-Powered Toolkit for Academic Success.
+13062052269
info@desklib.com
Available 24*7 on WhatsApp / Email
![[object Object]](/_next/static/media/star-bottom.7253800d.svg)
Unlock your academic potential
Copyright © 2020–2026 A2Z Services. All Rights Reserved. Developed and managed by ZUCOL.