Comprehensive Study: Nano Silica's Effects on Concrete Performance
VerifiedAdded on 2020/03/23
|36
|7193
|60
Report
AI Summary
This report investigates the effects of nano silica inclusion in concrete, exploring its impact on mechanical properties and durability. The study details the materials used, including CEM I 42.5R cement, limestone aggregate, and nano silica suspension. Experimental methods encompass compressive strength tests, water absorption and sorptivity measurements, chloride penetration resistance assessments, and electrical resistivity evaluations. The analysis reveals how nano silica affects slump values, compressive strength at different curing periods, and water sorptivity. The study also examines the influence of nano silica on chloride penetration and electrical resistivity. Furthermore, the report discusses methods for dispersing nano silica into cement, determination of the optimum amount of nano silica required, and the environmental and human impacts of nano silica. The report concludes with an overview of the findings and a list of references.
NANO SILICA INCLUSION INTO CONCRETE
Student’s Name
Class
Tutor’s Name
Student’s Name
Class
Tutor’s Name
Paraphrase This Document
Need a fresh take? Get an instant paraphrase of this document with our AI Paraphraser
Nano silica
Contents
Introduction.................................................................................................................................................3
Methodology in experimentation and materials.........................................................................................4
Materials.................................................................................................................................................4
Experimenting methods..........................................................................................................................5
Reinforcement.........................................................................................................................................7
Resistivity to chloride penetration.........................................................................................................13
Electrical resistance...............................................................................................................................15
Improvements on mechanical properties..............................................................................................19
Porosity observation..........................................................................................................................19
Thermal analysis................................................................................................................................21
Morphological observation................................................................................................................22
General Observation of inclusion of nano silica.....................................................................................23
Dispersing nano silica into cement............................................................................................................24
Physical dispersion method...................................................................................................................24
Chemical dispersion method.................................................................................................................26
The best method...................................................................................................................................28
Improvements of the best method are mentioned...............................................................................28
Determination of optimum amount of nano silica required......................................................................28
Setting time experiment........................................................................................................................28
Fluidity experiment................................................................................................................................29
Nano silica Environmental and human impacts.........................................................................................29
Cost...........................................................................................................................................................30
Conclusion.................................................................................................................................................31
References.................................................................................................................................................33
2
Nano silica
Nano silica affecting mechanical properties of concrete
Introduction
Lately, cement has been modified by the use of nanoparticles. The concrete being used as a
major cement composite has its major binder portion replaced by nanoparticles that include TiO2,
Fe2O, Al2O3 SiO2. In these nanoparticles, Nano silica comes out as the most researched on with
the chemical composition of C-S-H. Another reason for the popularity of Nano silica was due to
the improvement of the properties of composites of cement, Samali et al., (2012, p. 40). Both
Nano silica and the silica fume are very reactive pozzolan that can consume existing calcium
hydroxide and form a secondary C-S-H. However, a group of researchers explained that adding
Nano silica affected the existing silicate polymerization and not the formed amount of C-S-H.
The same Nano silica composition can also affect compound of concrete by the seeding effect.
An accelerated hydration in the early stages is due to the present greater number of precipitation
of the hydration products (Samali, et al., 2012). The microscopic properties of cement have been
influenced by Nano silica and studied to produce controversial data. For example, the
compressive strength of cement was affected differently with certain amounts of Nano silica
content in it, Barre, et al. (2016, p. 32). Superplasticizer addition timing affected the Nano silica
use in concrete properties. Other than compressive strength, durability is one more property
important in concrete construction in reinforced concrete. Studies relating to the durability of
concrete have been conducted in that investigation was made on the resistance to penetration by
chloride, water sorptivity, carbonation resistance and electrical resistivity, Tokyay (2016, p. 60).
It was discovered that the absorption property of water in concrete decreased with the increase of
Nano silica content. Another study led to the discovery that the water sorptivity did not get
affected by the inclusion of the nanoparticles. In a compressive analysis of strength, when Nano
silica was added to mortars there were varying results from different ratios of water-cement.
3
⊘ This is a preview!⊘
Do you want full access?
Subscribe today to unlock all pages.
Trusted by 1+ million students worldwide
Nano silica
Researching on chloride diffusion led to the discovery that it reduced with the addition of Nano
silica. In carbonation, some researchers produced no change in resistance to carbonation while
others produced a reduced chloride diffusion coefficient, Andrade et al., (2014, p. 48).
Methodology in experimentation and materials
Materials
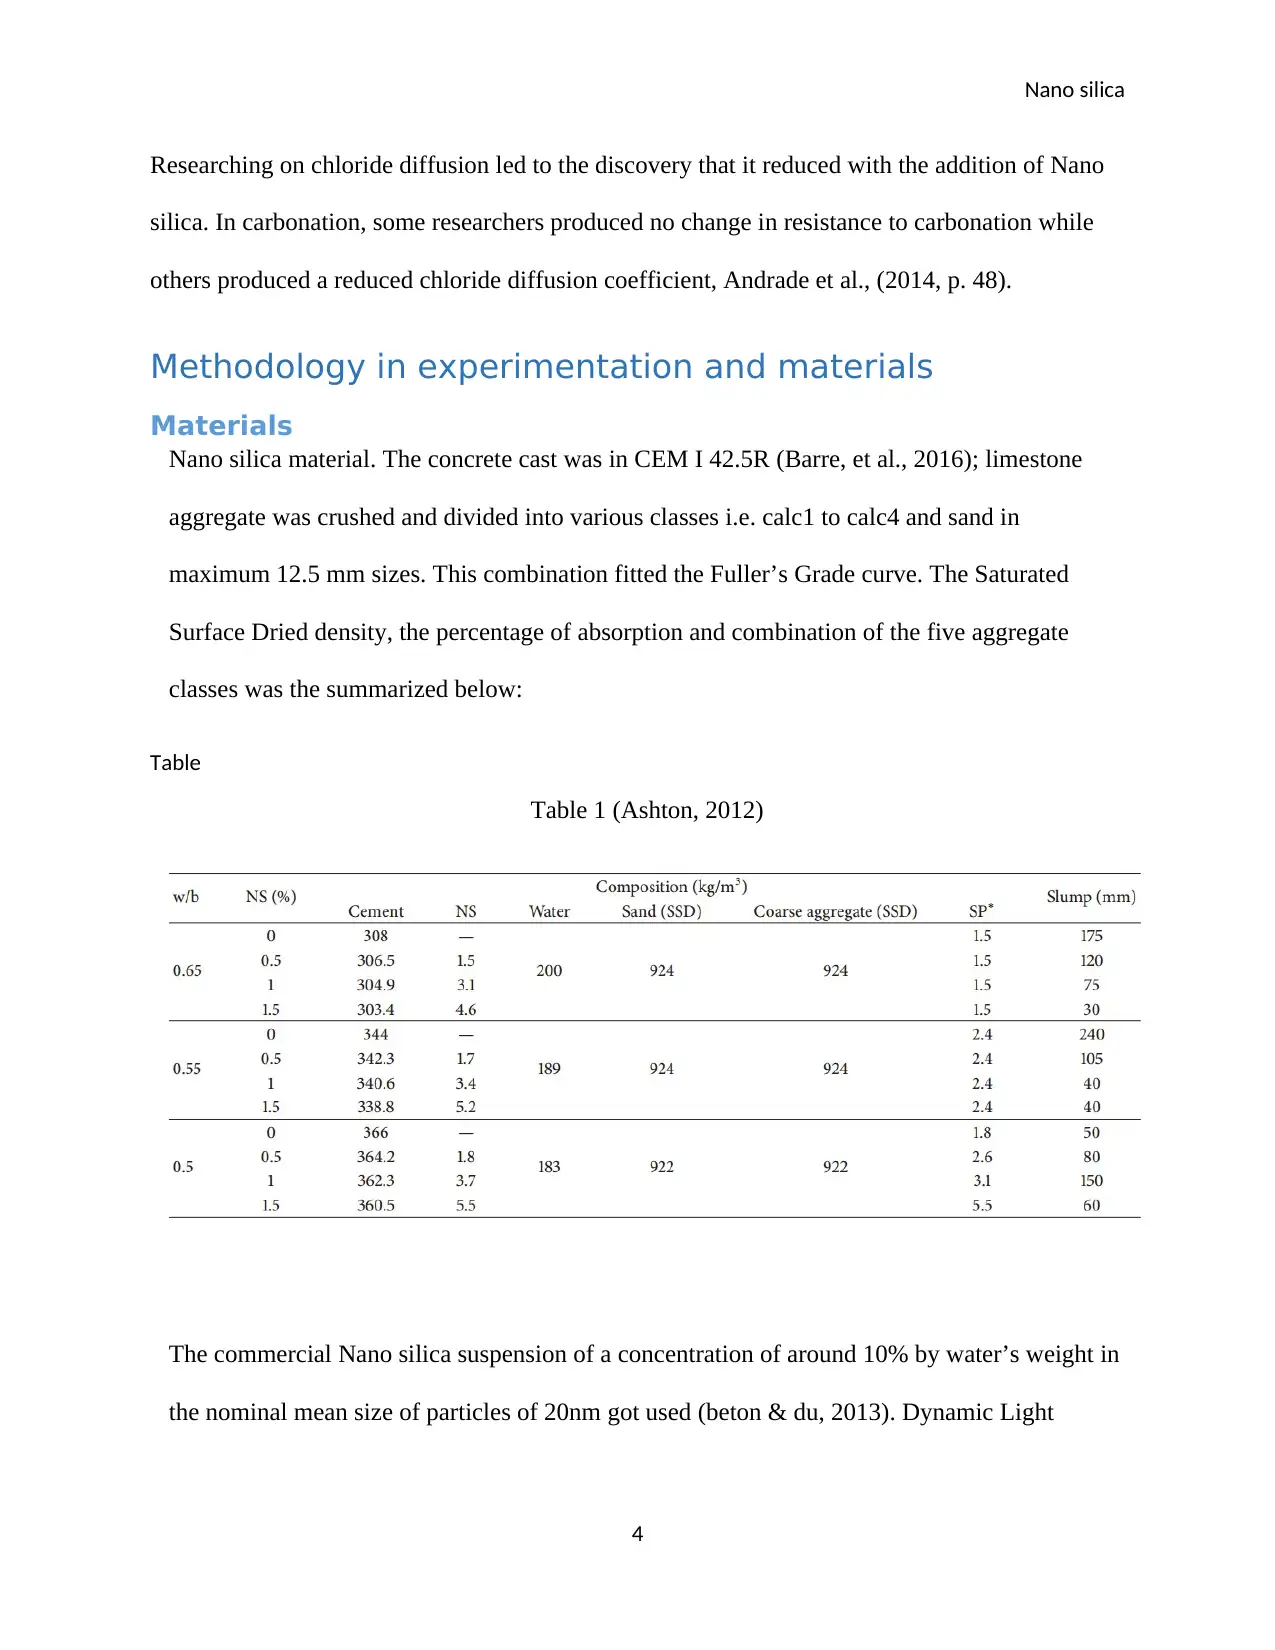
Nano silica material. The concrete cast was in CEM I 42.5R (Barre, et al., 2016); limestone
aggregate was crushed and divided into various classes i.e. calc1 to calc4 and sand in
maximum 12.5 mm sizes. This combination fitted the Fuller’s Grade curve. The Saturated
Surface Dried density, the percentage of absorption and combination of the five aggregate
classes was the summarized below:
Table
Table 1 (Ashton, 2012)
The commercial Nano silica suspension of a concentration of around 10% by water’s weight in
the nominal mean size of particles of 20nm got used (beton & du, 2013). Dynamic Light
4
Researching on chloride diffusion led to the discovery that it reduced with the addition of Nano
silica. In carbonation, some researchers produced no change in resistance to carbonation while
others produced a reduced chloride diffusion coefficient, Andrade et al., (2014, p. 48).
Methodology in experimentation and materials
Materials
Nano silica material. The concrete cast was in CEM I 42.5R (Barre, et al., 2016); limestone
aggregate was crushed and divided into various classes i.e. calc1 to calc4 and sand in
maximum 12.5 mm sizes. This combination fitted the Fuller’s Grade curve. The Saturated
Surface Dried density, the percentage of absorption and combination of the five aggregate
classes was the summarized below:
Table
Table 1 (Ashton, 2012)
The commercial Nano silica suspension of a concentration of around 10% by water’s weight in
the nominal mean size of particles of 20nm got used (beton & du, 2013). Dynamic Light
4
Paraphrase This Document
Need a fresh take? Get an instant paraphrase of this document with our AI Paraphraser
Nano silica
Scattering technique showed the suspended dispersed Nano silica content in the water, Schutter
(2012, p. 20).
Experimenting methods
Compressive strength – this test was done in accordance to the EN-12390-3 on the moisture
cubes that were cured in curing chambers for about 7 to 28 days.
Water absorption and sorptivity – the capillary absorption of water was taken as the mass of
absorbed liquid per surface unit in cylindrical samples for a duration of t. these samples got over-
dried for a week in 40 degree Celsius so as to get the dry mass and later there surfaces were
exposed to demineralized water. The water sorptivity could then be calculated using the 24h
values, Grantham et al., (2011, p. 52);
Equation
i=S √ t Ultra-High Performance Concrete and Nanotechnology in Construction Schmidt, et al.,
(2012, p. 82)
These samples got dipped in demineralized water to get the overall water absorption Win
percentage as subtracting dry mass and saturated water with respect to the dry mass.
Resistance to chloride penetration – this test was d CEN/TS 12390-11. Samples were put in
vacuum containers of absolute pressure about 1-5 kPa for a duration of 3h. The container got
filled with a volume of demineralized water for an hour as the pump continued running then put
in a lab for about 2 to 4h for their surfaces to become dry (Grantham, et al., 2011). All these
surfaces got covered in epoxy resin except one and dipped in concentrated calcium hydroxide for
about 18h then dipped in a solution of sodium chloride of 3% mass concentration for 90 days. In
the end, these samples were crushed and the powder obtained from different levels for analysis
of sodium chloride acid in accordance with EN 14629. The percentage content of each sample
5
Nano silica
was extracted, the diffusion coefficient of chloride Dapp and the surface content of chloride Cs
obtained by use of interpolation of the profile of chloride in accordance with EN 14629, beton &
du (2013, p. 70).
Electrical resistivity – this test was performed by measuring conductance across the cylindrical
samples. The surface of the mould was not ground in this test. After coring the specimen were
dipped in demineralized water immediately then maintained at 20-25 degree Celsius (Schutter,
2012). The conductance was them measured periodically for about 4 months and recorded. This
conductance was changed to electrical resistivity taking use of the geometry of the specimens.
Equation
ρ= A
lG CITATION All 16 ¿1033 (Allen∧Mayes, 2016)
With the respective meanings of A and l being the surface area and sample heights.
Resistance to carbonation – the cylindrical samples were conditioned in a lab for a duration of 14
days at 18 – 25 degree Celsius and a relative humidity of 50 – 65% the sides of the sample
surfaces covered in epoxy resin. Later, the samples were put in the accelerated chamber for
carbonation at 4% carbon dioxide concentration, about 50% relative humidity and 20 degree
Celsius. The carbonation depth was measured after the 45 and 135 days by a phenolphthalein
indicator. Each sample’s surface produced averagely 10 points of carbonation depth. This
information was interpolated with (Schmidt, et al., 2012)
Equation
x=K √ tUltra-High Performance Concrete and Nanotechnology in Construction Schmidt, et al.,
(2012, p. 82)
6
⊘ This is a preview!⊘
Do you want full access?
Subscribe today to unlock all pages.
Trusted by 1+ million students worldwide
Nano silica
x being the carbonation depth and t being the duration in years and the coefficient of carbon
determined.
Microstructural characterization – the calcium hydroxide content in the samples of concrete were
gotten by using X-ray diffraction, thermal analysis by differential and the analysis by the thermal
gravimetric method. The patterns of diffracted X-ray were in a range of 15 – 60 degrees with
copper radiation rube and λ = 1.5418 A with a 0.02-degree step size and 0.2deg/s scan rate.
These experiments were done with the use of isothermal analyzer o the ground concrete
aggregates with an approximate 100 mg (Shivani, 2014). Also, the experiments were done under
a flow of nitrogen, 50 mL/min. The temperature was made to rise from 25 to 900 degree Celsius
at a rate of 10 degree Celsius per min and got held constant at 105 degree Celsius for around
hours so as to evaporate water. The calcium hydroxide amount was estimated as below;
Equation
CH ( % )=WLCH (%) × MW CH
MW H CITATION And14 \l 1033 (Andrade, et al., 2014)
In that CH means the percentage of calcium hydroxide, WLCH being the percentage weight loss
due to CH decomposition and MWH and MW H is molecular weights of water and calcium
hydroxide respectively (Malhotra, 2011).
The analysis of porosity was done using the Mercury Intrusion Porosimetry and the morphology
noted using the Environmental Scanning Electron Microscope in the fragments of concrete
obtained from the broken specimens during compressive strength experiment. The specimens
from these tests were chosen in accordance to the best performing Nano silica incorporated
concrete compressive strength (Sheng & Wang, 2014).
Discussion
7
Paraphrase This Document
Need a fresh take? Get an instant paraphrase of this document with our AI Paraphraser
Nano silica
Reinforcement
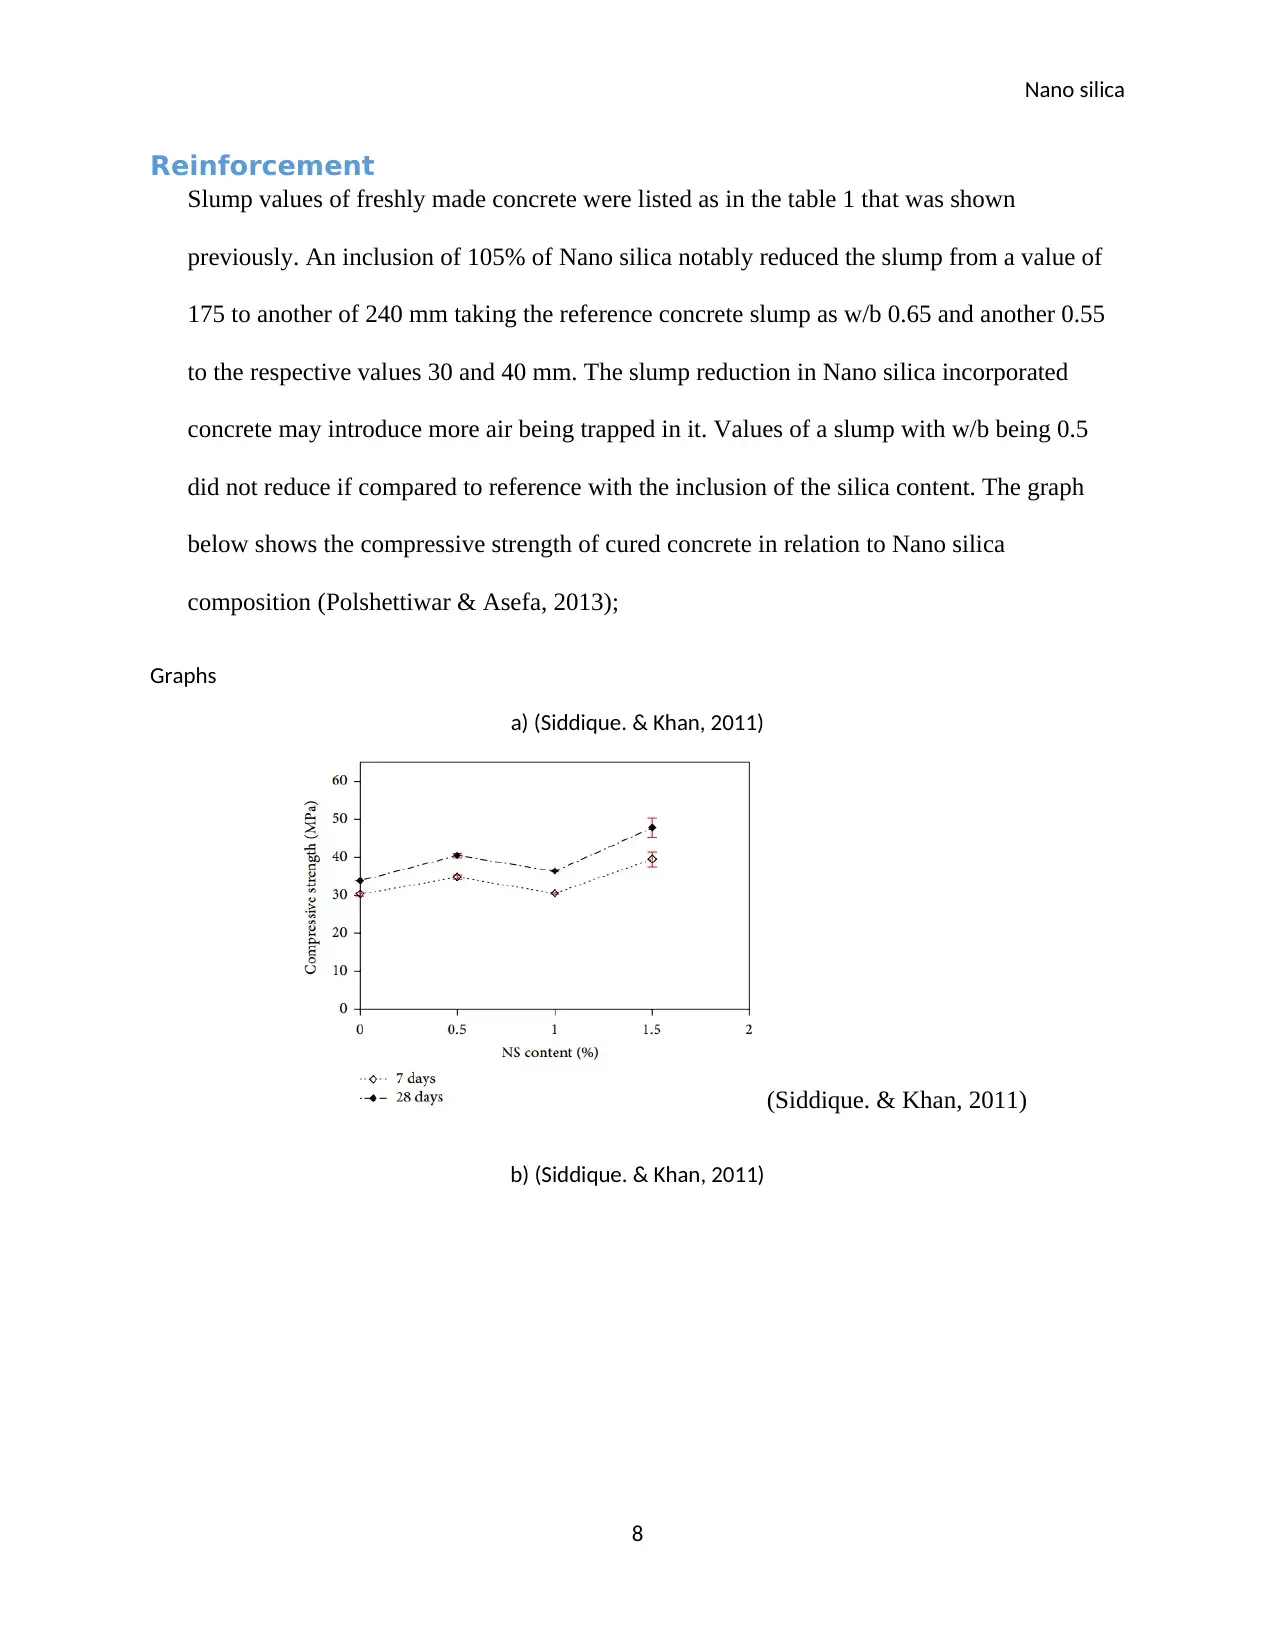
Slump values of freshly made concrete were listed as in the table 1 that was shown
previously. An inclusion of 105% of Nano silica notably reduced the slump from a value of
175 to another of 240 mm taking the reference concrete slump as w/b 0.65 and another 0.55
to the respective values 30 and 40 mm. The slump reduction in Nano silica incorporated
concrete may introduce more air being trapped in it. Values of a slump with w/b being 0.5
did not reduce if compared to reference with the inclusion of the silica content. The graph
below shows the compressive strength of cured concrete in relation to Nano silica
composition (Polshettiwar & Asefa, 2013);
Graphs
a) (Siddique. & Khan, 2011)
(Siddique. & Khan, 2011)
b) (Siddique. & Khan, 2011)
8
Reinforcement
Slump values of freshly made concrete were listed as in the table 1 that was shown
previously. An inclusion of 105% of Nano silica notably reduced the slump from a value of
175 to another of 240 mm taking the reference concrete slump as w/b 0.65 and another 0.55
to the respective values 30 and 40 mm. The slump reduction in Nano silica incorporated
concrete may introduce more air being trapped in it. Values of a slump with w/b being 0.5
did not reduce if compared to reference with the inclusion of the silica content. The graph
below shows the compressive strength of cured concrete in relation to Nano silica
composition (Polshettiwar & Asefa, 2013);
Graphs
a) (Siddique. & Khan, 2011)
(Siddique. & Khan, 2011)
b) (Siddique. & Khan, 2011)
8
Nano silica
(Siddique. & Khan, 2011)
c) (Siddique. & Khan, 2011)
(Siddique. & Khan, 2011)
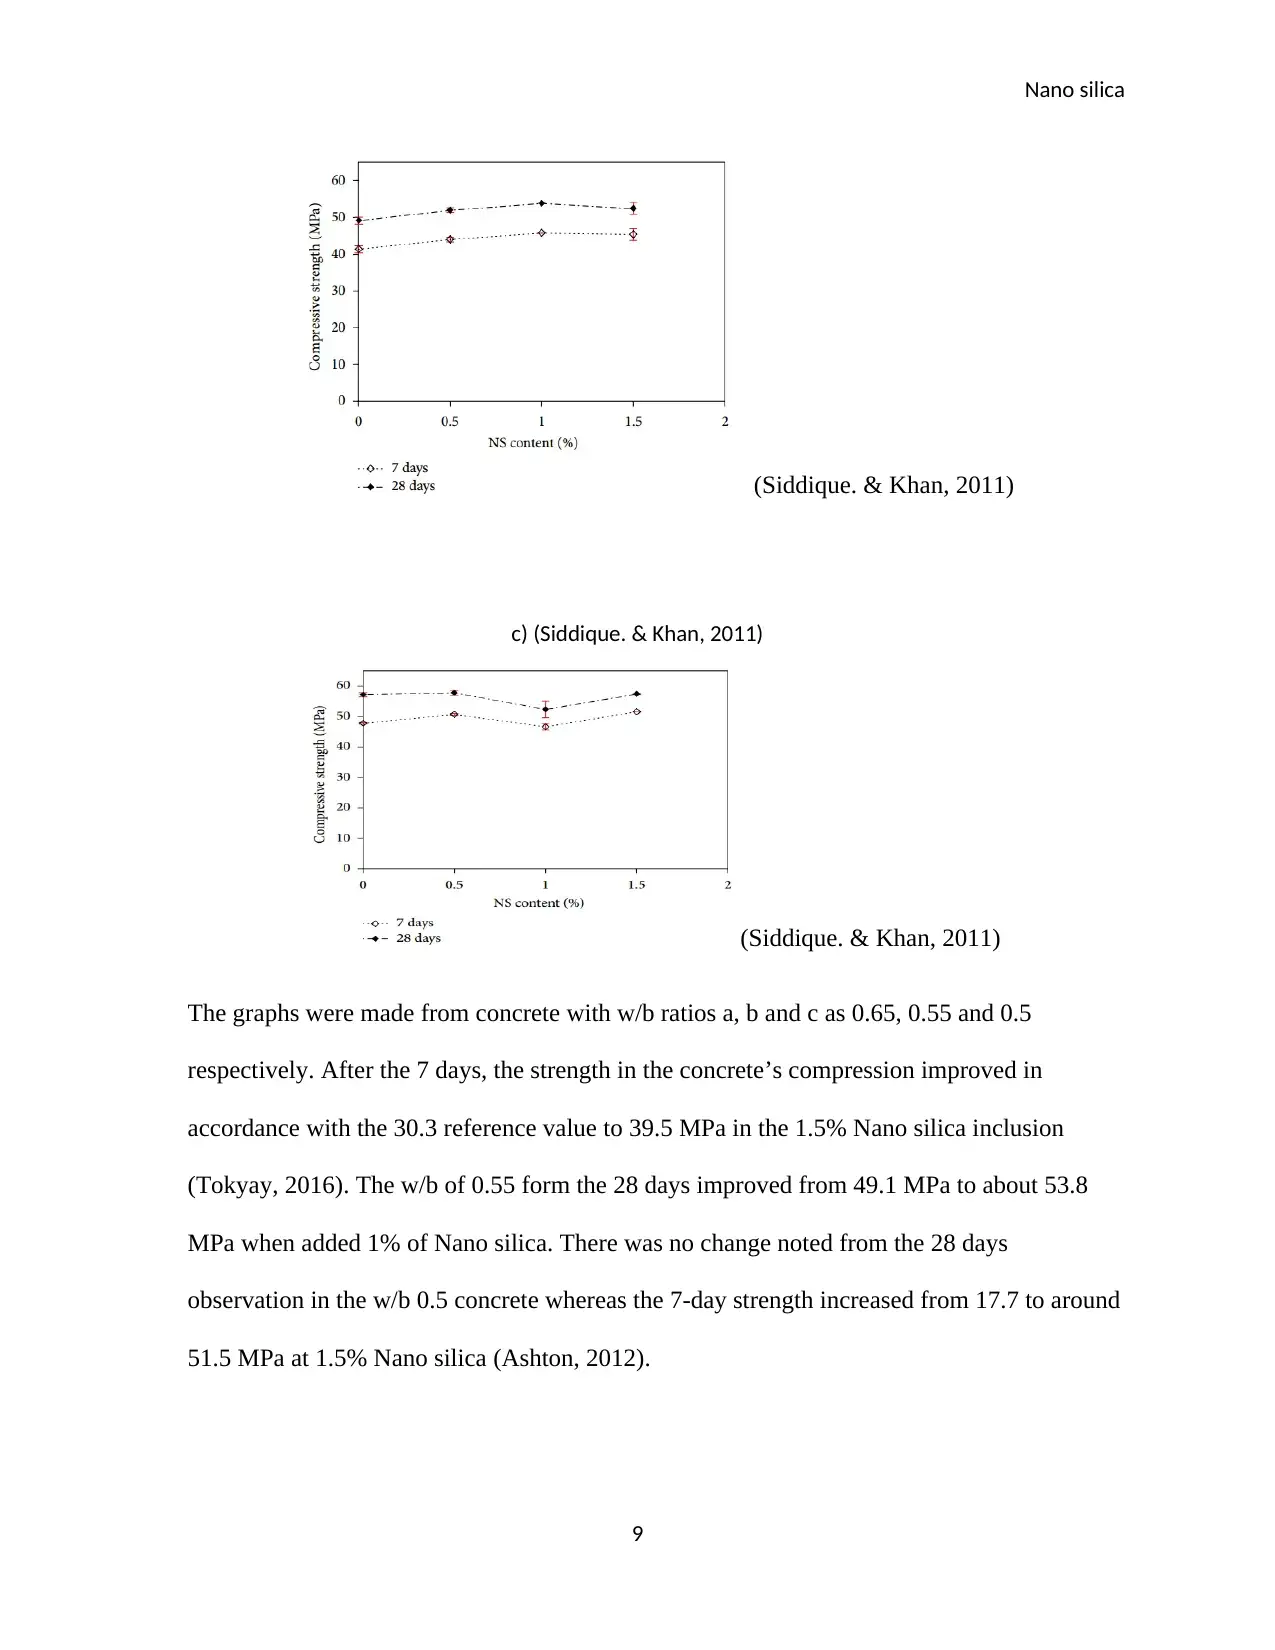
The graphs were made from concrete with w/b ratios a, b and c as 0.65, 0.55 and 0.5
respectively. After the 7 days, the strength in the concrete’s compression improved in
accordance with the 30.3 reference value to 39.5 MPa in the 1.5% Nano silica inclusion
(Tokyay, 2016). The w/b of 0.55 form the 28 days improved from 49.1 MPa to about 53.8
MPa when added 1% of Nano silica. There was no change noted from the 28 days
observation in the w/b 0.5 concrete whereas the 7-day strength increased from 17.7 to around
51.5 MPa at 1.5% Nano silica (Ashton, 2012).
9
(Siddique. & Khan, 2011)
c) (Siddique. & Khan, 2011)
(Siddique. & Khan, 2011)
The graphs were made from concrete with w/b ratios a, b and c as 0.65, 0.55 and 0.5
respectively. After the 7 days, the strength in the concrete’s compression improved in
accordance with the 30.3 reference value to 39.5 MPa in the 1.5% Nano silica inclusion
(Tokyay, 2016). The w/b of 0.55 form the 28 days improved from 49.1 MPa to about 53.8
MPa when added 1% of Nano silica. There was no change noted from the 28 days
observation in the w/b 0.5 concrete whereas the 7-day strength increased from 17.7 to around
51.5 MPa at 1.5% Nano silica (Ashton, 2012).
9
⊘ This is a preview!⊘
Do you want full access?
Subscribe today to unlock all pages.
Trusted by 1+ million students worldwide
Nano silica
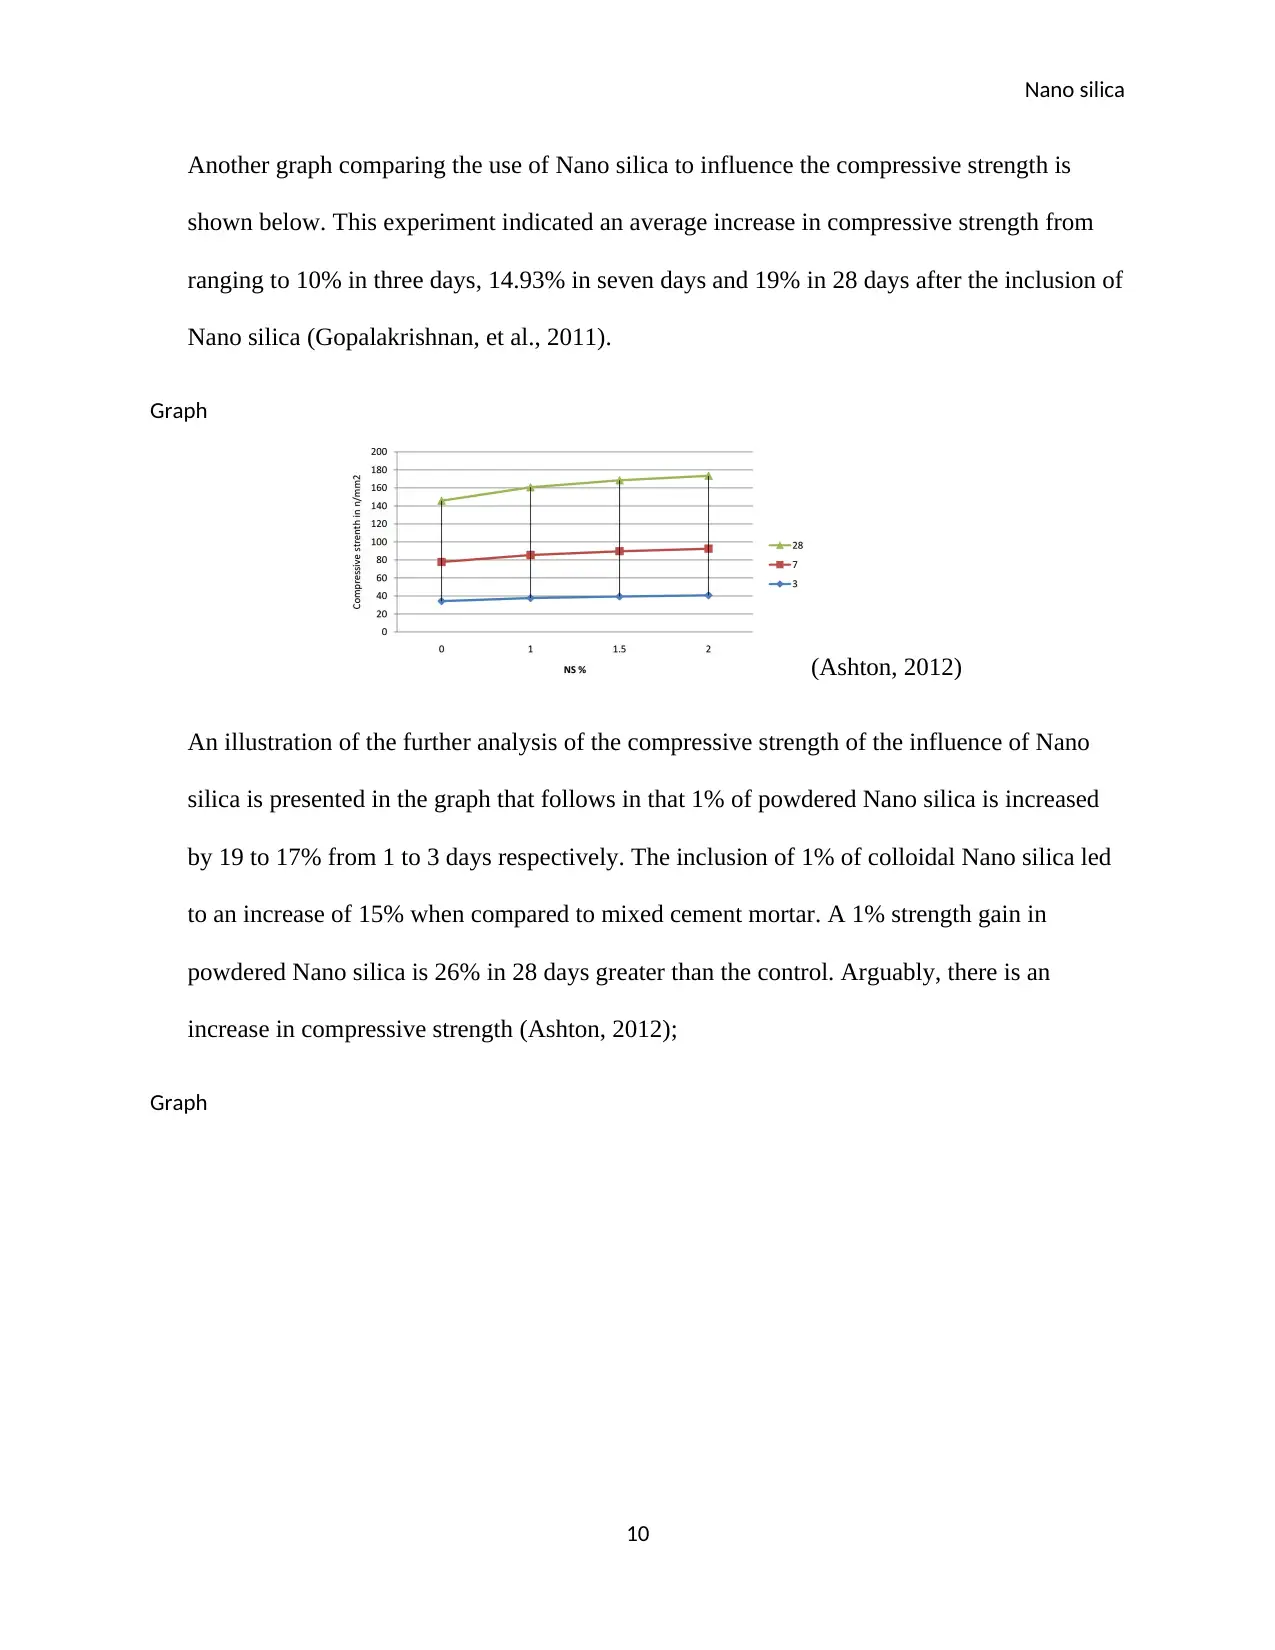
Another graph comparing the use of Nano silica to influence the compressive strength is
shown below. This experiment indicated an average increase in compressive strength from
ranging to 10% in three days, 14.93% in seven days and 19% in 28 days after the inclusion of
Nano silica (Gopalakrishnan, et al., 2011).
Graph
(Ashton, 2012)
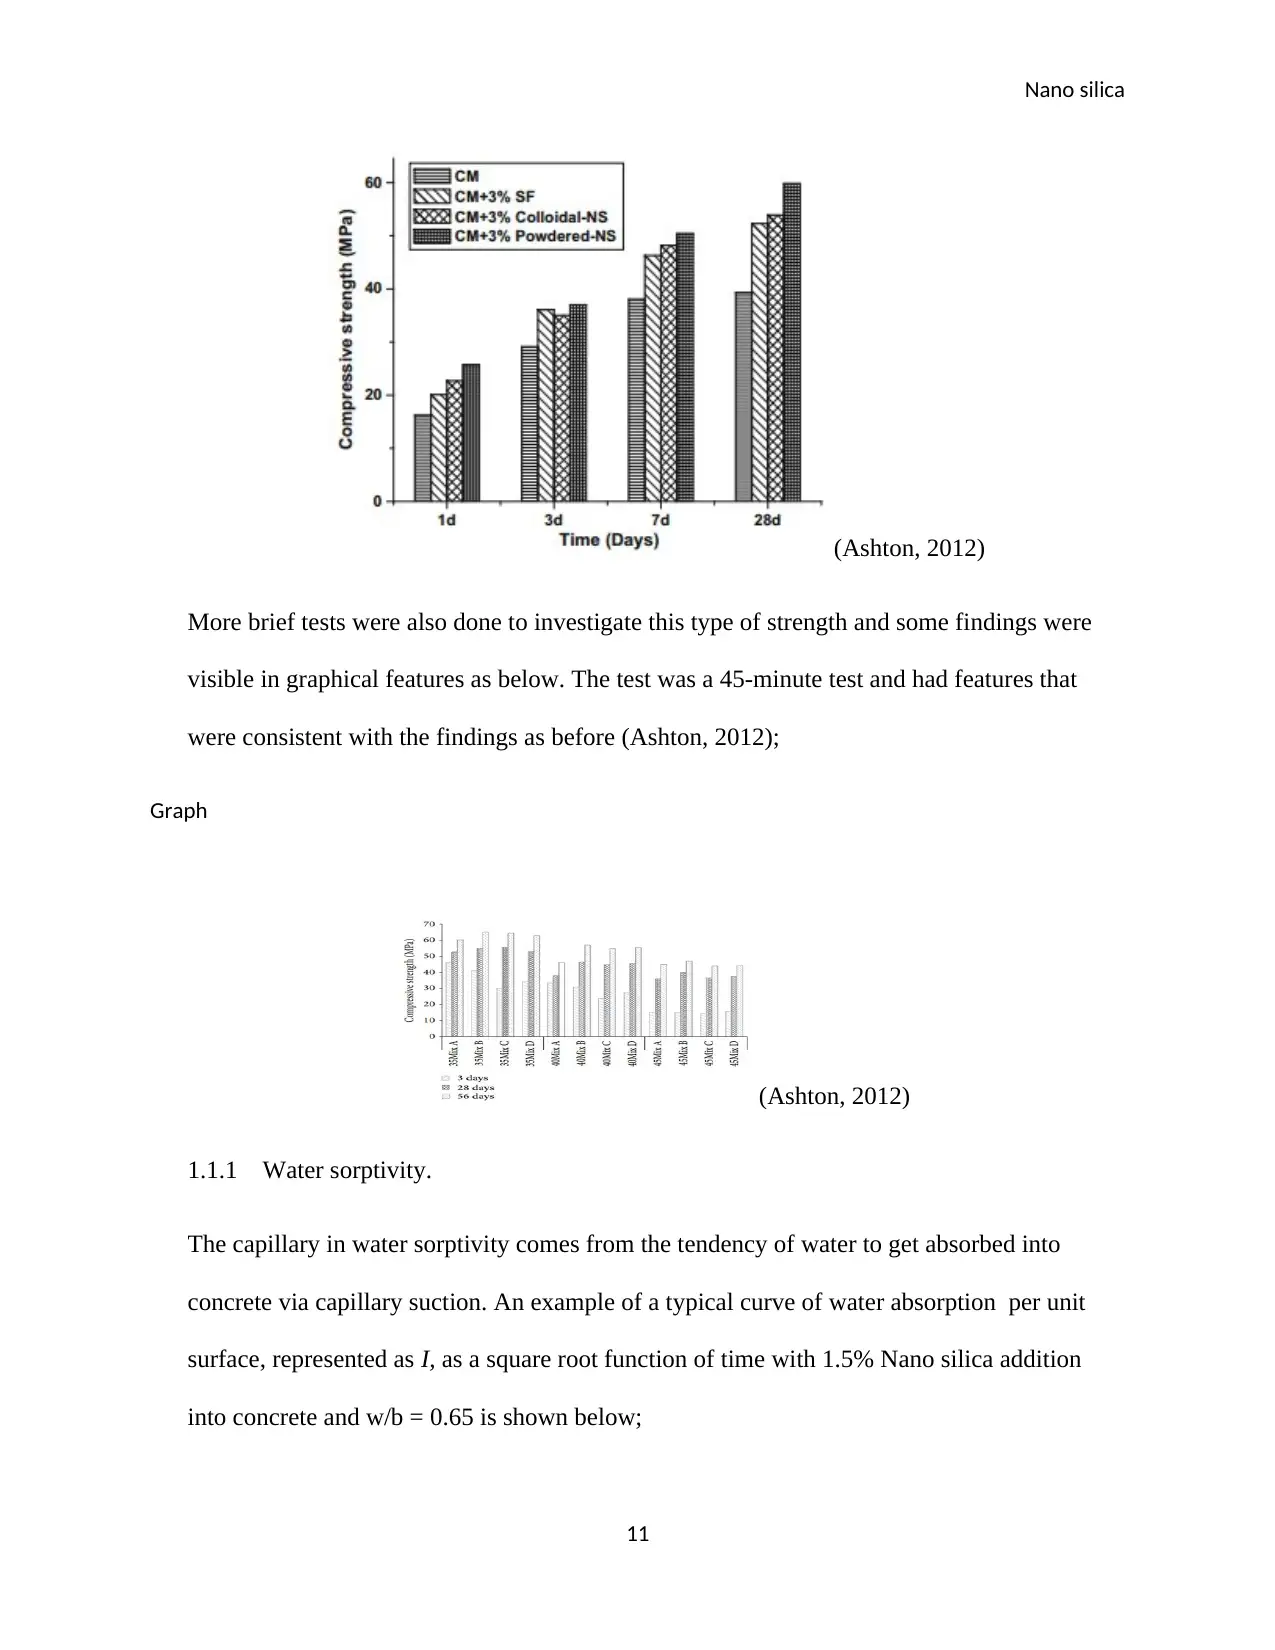
An illustration of the further analysis of the compressive strength of the influence of Nano
silica is presented in the graph that follows in that 1% of powdered Nano silica is increased
by 19 to 17% from 1 to 3 days respectively. The inclusion of 1% of colloidal Nano silica led
to an increase of 15% when compared to mixed cement mortar. A 1% strength gain in
powdered Nano silica is 26% in 28 days greater than the control. Arguably, there is an
increase in compressive strength (Ashton, 2012);
Graph
10
Another graph comparing the use of Nano silica to influence the compressive strength is
shown below. This experiment indicated an average increase in compressive strength from
ranging to 10% in three days, 14.93% in seven days and 19% in 28 days after the inclusion of
Nano silica (Gopalakrishnan, et al., 2011).
Graph
(Ashton, 2012)
An illustration of the further analysis of the compressive strength of the influence of Nano
silica is presented in the graph that follows in that 1% of powdered Nano silica is increased
by 19 to 17% from 1 to 3 days respectively. The inclusion of 1% of colloidal Nano silica led
to an increase of 15% when compared to mixed cement mortar. A 1% strength gain in
powdered Nano silica is 26% in 28 days greater than the control. Arguably, there is an
increase in compressive strength (Ashton, 2012);
Graph
10
Paraphrase This Document
Need a fresh take? Get an instant paraphrase of this document with our AI Paraphraser
Nano silica
(Ashton, 2012)
More brief tests were also done to investigate this type of strength and some findings were
visible in graphical features as below. The test was a 45-minute test and had features that
were consistent with the findings as before (Ashton, 2012);
Graph
(Ashton, 2012)
1.1.1 Water sorptivity.
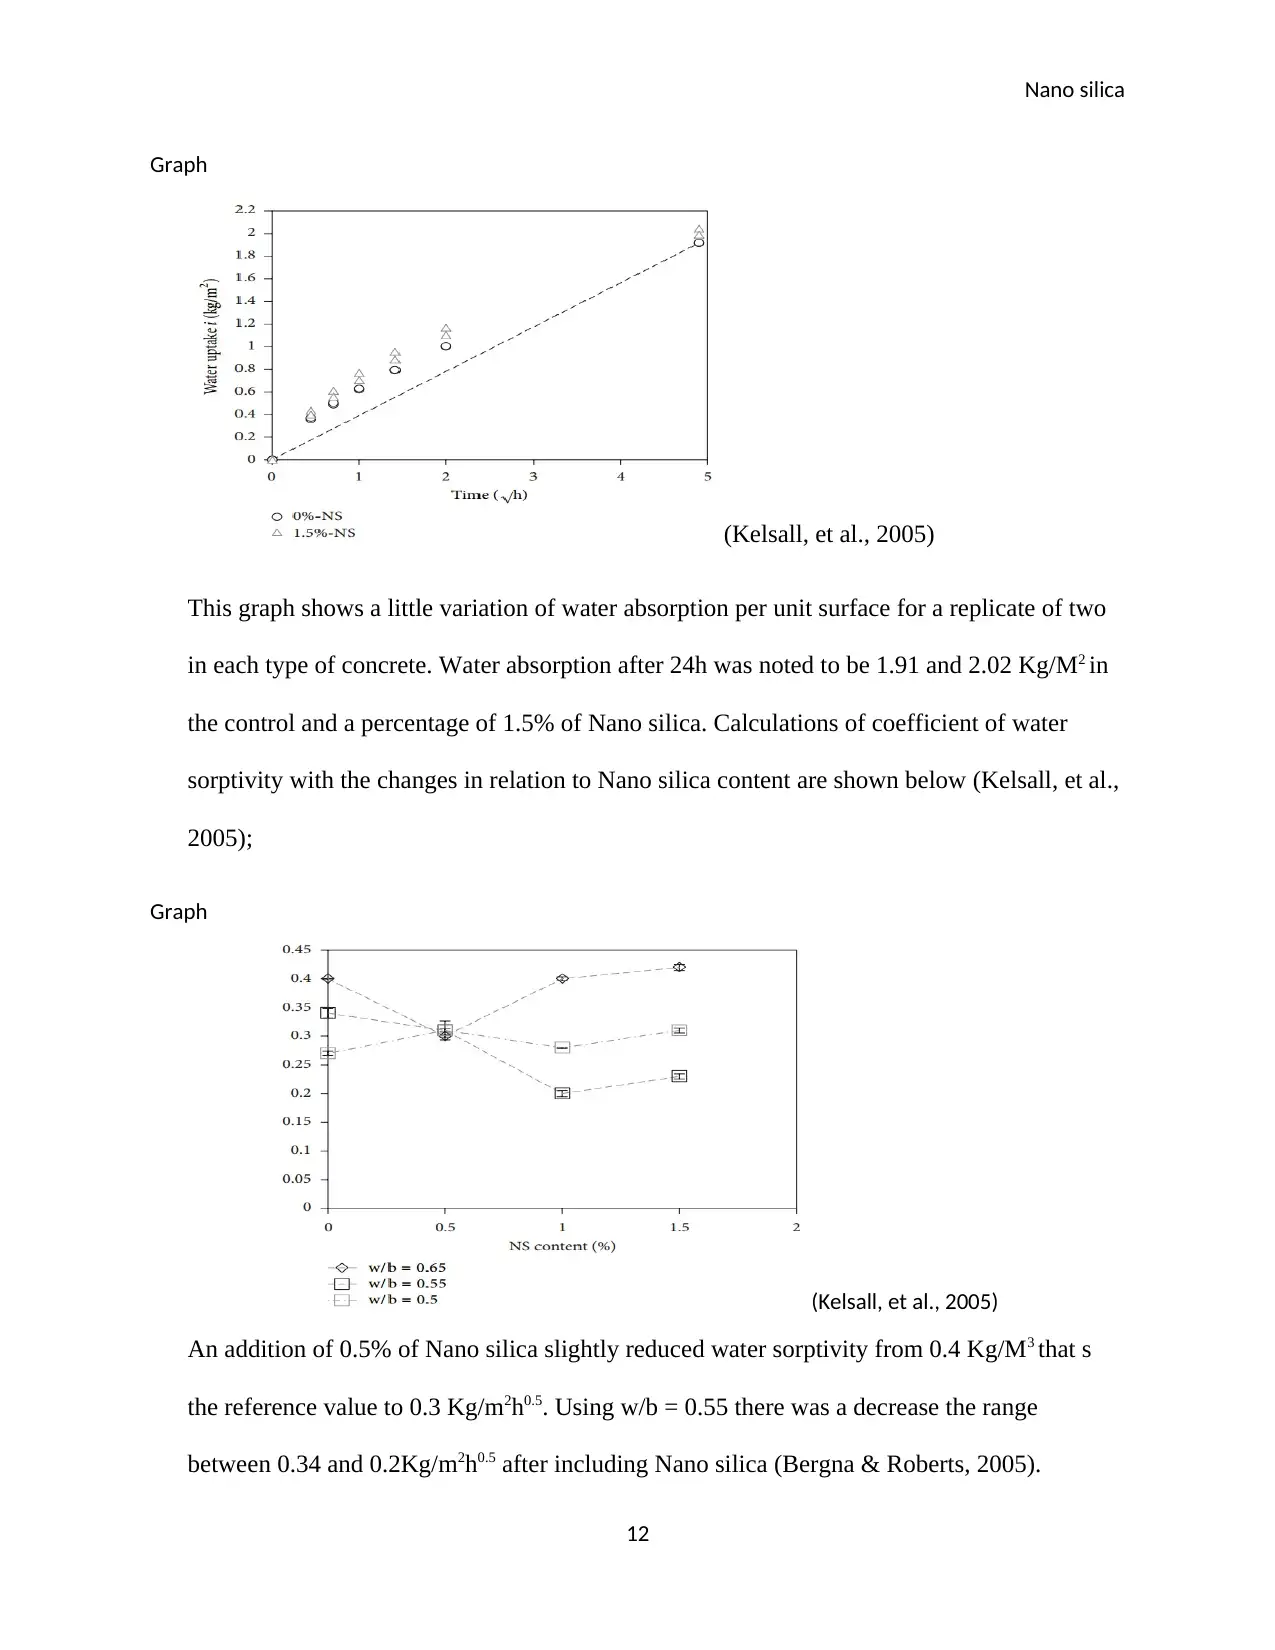
The capillary in water sorptivity comes from the tendency of water to get absorbed into
concrete via capillary suction. An example of a typical curve of water absorption per unit
surface, represented as I, as a square root function of time with 1.5% Nano silica addition
into concrete and w/b = 0.65 is shown below;
11
(Ashton, 2012)
More brief tests were also done to investigate this type of strength and some findings were
visible in graphical features as below. The test was a 45-minute test and had features that
were consistent with the findings as before (Ashton, 2012);
Graph
(Ashton, 2012)
1.1.1 Water sorptivity.
The capillary in water sorptivity comes from the tendency of water to get absorbed into
concrete via capillary suction. An example of a typical curve of water absorption per unit
surface, represented as I, as a square root function of time with 1.5% Nano silica addition
into concrete and w/b = 0.65 is shown below;
11
Nano silica
Graph
(Kelsall, et al., 2005)
This graph shows a little variation of water absorption per unit surface for a replicate of two
in each type of concrete. Water absorption after 24h was noted to be 1.91 and 2.02 Kg/M2 in
the control and a percentage of 1.5% of Nano silica. Calculations of coefficient of water
sorptivity with the changes in relation to Nano silica content are shown below (Kelsall, et al.,
2005);
Graph
(Kelsall, et al., 2005)
An addition of 0.5% of Nano silica slightly reduced water sorptivity from 0.4 Kg/M3 that s
the reference value to 0.3 Kg/m2h0.5. Using w/b = 0.55 there was a decrease the range
between 0.34 and 0.2Kg/m2h0.5 after including Nano silica (Bergna & Roberts, 2005).
12
Graph
(Kelsall, et al., 2005)
This graph shows a little variation of water absorption per unit surface for a replicate of two
in each type of concrete. Water absorption after 24h was noted to be 1.91 and 2.02 Kg/M2 in
the control and a percentage of 1.5% of Nano silica. Calculations of coefficient of water
sorptivity with the changes in relation to Nano silica content are shown below (Kelsall, et al.,
2005);
Graph
(Kelsall, et al., 2005)
An addition of 0.5% of Nano silica slightly reduced water sorptivity from 0.4 Kg/M3 that s
the reference value to 0.3 Kg/m2h0.5. Using w/b = 0.55 there was a decrease the range
between 0.34 and 0.2Kg/m2h0.5 after including Nano silica (Bergna & Roberts, 2005).
12
⊘ This is a preview!⊘
Do you want full access?
Subscribe today to unlock all pages.
Trusted by 1+ million students worldwide
1 out of 36

Your All-in-One AI-Powered Toolkit for Academic Success.
+13062052269
info@desklib.com
Available 24*7 on WhatsApp / Email
![[object Object]](/_next/static/media/star-bottom.7253800d.svg)
Unlock your academic potential
Copyright © 2020–2026 A2Z Services. All Rights Reserved. Developed and managed by ZUCOL.