Comprehensive Risk Analysis of National Australia Bank (NAB) - MPA108
VerifiedAdded on 2023/01/11
|22
|4691
|57
Report
AI Summary
This report presents a risk analysis of National Australia Bank (NAB), examining its stock performance and market volatility. The study uses secondary data from 2005 to 2018, including monthly closing share prices of NAB and S&P.AX, to calculate average returns and risk premiums. The analysis includes two time periods for comparison, with the first period from 2005 to 2012 and the second from 2012 to 2019. The report calculates and discusses average monthly returns, market capitalization, and P/E ratios. Line graphs and histograms are used to analyze share price history and monthly returns. The study also explores the standard deviation, variance, and beta as risk predictors and discusses the impact of capital structure, legislative changes, competitive pressures, and international events on NAB's risk profile. The report concludes with recommendations based on the findings.
Running head: RISK ANALYSIS OF NATIONAL AUSTRALIA BANK
Risk Analysis of National Australia Bank
Name of the Student:
Name of the University:
Author Note:
Risk Analysis of National Australia Bank
Name of the Student:
Name of the University:
Author Note:
Paraphrase This Document
Need a fresh take? Get an instant paraphrase of this document with our AI Paraphraser
1
RISK ANALYSIS OF NATIONAL AUSTRALIA BANK
Table of Contents
Chapter 1: Introduction..............................................................................................................3
Chapter 2: Literature Review.....................................................................................................6
Chapter 2: Research Question....................................................................................................6
Chapter 3: Methodology............................................................................................................7
Chapter 4: Empirical Analysis...................................................................................................7
1. Monthly Return of NAB and S&P for the First Time.............................................8
2. Monthly Return of NAB and S&P for the Second Time.........................................8
3. Average monthly return, market capitalisation and P/E ratios of NAB for both period8
4. Line graphs plotting the share price history of NAB.AX and the S&P for both period
..........................................................................................................................................10
5. Histograms of monthly returns of the National Australia Bank for both period.........12
Standard deviation as a predictor of risk..............................................................................12
Estimated Variance and standard deviations of NAB.AX and S&P for both the period.....13
β as a better measure of risk.................................................................................................13
Chapter 6: Findings..................................................................................................................13
Discussion of estimated SD and Variance...........................................................................13
The risk measured by the SD...............................................................................................14
Explanation of Risk Premium through covariance of return from NAB and S&P..............14
Chapter 6: Discussion..............................................................................................................15
Capital structure...................................................................................................................15
Legislative changes impacting the financial company.........................................................15

2
RISK ANALYSIS OF NATIONAL AUSTRALIA BANK
Competitive pressures..........................................................................................................16
International events..............................................................................................................17
Major suppliers and customers.............................................................................................17
Chapter 6: Conclusion..............................................................................................................17
Reference..................................................................................................................................19
⊘ This is a preview!⊘
Do you want full access?
Subscribe today to unlock all pages.
Trusted by 1+ million students worldwide
3
RISK ANALYSIS OF NATIONAL AUSTRALIA BANK
Chapter 1: Introduction
The stock return of a company depends on the market structure and the performance
of the market from where the company belongs. The market behaviour decides the risk of the
return from the stock of the company. Here, the stock of National Australia Bank is chosen
for the study.
The formation of National Australia Bank took place as National Commercial
Banking Corporation of Australia Limited in 1982 by combining the National Bank of
Australasia and the Commercial Banking Company of Sydney. The new company was named
as the National Australia Bank Limited (NAB). The representative offices of National
Australia Bank was set up in Athens (1984), Atlanta (1986), Beijing (1982), Chicago (1982),
Dallas (1983), Frankfurt (1985), Houston (1989), Kuala Lumpur (1984), New Delhi (1989),
San Francisco (1984), Seoul (1983), Shanghai (1988) and Taipei (1986). The NAB acquired
Clydesdale Bank of Scotland and Northern Bank from the Midland Bank in 1987. The Nab
also acquired Yorkshire Bank of England and Wales in 1990. It also acquired Bank of New
Zealand in 1992and Michigan National Bank in 1995. In 1991, NAB rationally closed its
offices in Atlanta, Chicago, Dallas, Houston and San Francisco (NATIONAL AUSTRALIA
BANK, 2018). The products and services of the NAB is business banking, consumer
banking, whose sale banking and wealth management and Insurance. In the recent years, the
major activities of the NAB were banking services, credit and access card facilities, housing
and general finance, leasing and wealth management services. Moreover, significant
activities were investment banking, funds management and custodian, trustee and nominee
services and international banking. The market price of a single share of NAB was $18.68
and the number of share was 2734 million on 31st January, 2019. So, the market capitalization
is $51073 million on 31st January, 2019.
Paraphrase This Document
Need a fresh take? Get an instant paraphrase of this document with our AI Paraphraser
4
RISK ANALYSIS OF NATIONAL AUSTRALIA BANK
The details of the directors of the NAB directors in office in 2018 is listed below:
Dr Kenneth R Henry AC, BCom (Hons), PhD, DB h.c, FASSA, FAIIA, is
independent Director since November 2011. Chairman since December 2015. Chairman of
the Board's Nomination & Governance Committee.
Mr Andrew G Thorburn BCom, MBA, is non-independent Director since August
2014.
Mr David H Armstrong BBus, FCA, MAICD, is independent director since August
2014, Chairman of the Board's Audit Committee and a Member of the Risk Committee.
Mr Philip W Chronican BCom (Hons), MBA (Dist), GAICD, SF Fin is independent
Director since May 2016, Chairman of the Board's Risk Committee and a Member of the
Remuneration Committee. Director of BNZ (a subsidiary of NAB).
Mr Peeyush K Gupta BA, MBA, AMP (Harvard), FAICD, is independent Director
since November 2014, Member of the Board's Risk, Remuneration and Nomination &
REPORT OF THE DIRECTORS DIRECTORS’ INFORMATION 24 National Australia
Bank Governance Committees, Director of certain NAB Wealth and BNZ subsidiaries.
Ms Anne J Loveridge BA (Hons), FCA, GAICD, is independent Director since
December 2015, Chairman of the Board's Remuneration Committee and a Member of the
Nomination & Governance Committee.
Ms Geraldine C McBride BSc, is independent Director since March 2014, Member of
the Board's Audit Committee.
Mr Douglas A McKay ONZM, BA, AMP (Harvard), CMInstD (NZ), is independent
Director since February 2016, Member of the Board's Audit and Nomination & Governance
Committees and Chairman of BNZ (a subsidiary of NAB).
5
RISK ANALYSIS OF NATIONAL AUSTRALIA BANK
Ms Ann C Sherry AO, BA, Grad Dip IR, FAICD, FIPAA, is independent Director
since November 2017 and Member of the Board's Remuneration Committee.
Mr Anthony K T Yuen B.Soc.Scs, is independennt Director since March 2010,
Member of the Board's Audit and Risk Committees.
The performance of the bank can be indicated by the P/E ratio which is nothing but
the expected price of a share measured on the basis of its earnings i.e. as the earning per share
rises the market value will rise. Here, the latest P/E ratio of the NAB was 8.664 on 31st
January in 2019. This indicates that the stock of NBA is trading at multiple of 8.664. The P/E
ratio of the competitor of NAB is ANZ (Australia and New Zealand Banking Group Limited)
on 31st January, 2019 was 11.25. This shows that the profitability of the investment in ANZ
is more than the NAB. Except the P/E ratio the dividend policy is important as it consists in
undertaking a specific financial decisions by the company on sharing its earnings with the
shareholders.
The directors of NAB had announced the final average dividend of 99% for the fully
paid ordinary shares, 100% paid. The payment that was proposed by the financial company,
was equal to approximately $2,707 million. The Group timely adjusts the Dividend
Reinvestment Plan (DRP) to represent the capital position and outlook. The dividends were
paid in the last financial year:
The final average dividend of 99% of the fully paid ordinary share for the year 2017
ended on 30th September, 100% paid on 13 December 2017. The meantime average dividend
of 99% for fully paid ordinary share for the year 2018 ended on 30th September, 100% paid
on 5 July 2018. The payment was $2659 million and $2696 million in December, 2017 and
July, 2018 respectively.
⊘ This is a preview!⊘
Do you want full access?
Subscribe today to unlock all pages.
Trusted by 1+ million students worldwide
6
RISK ANALYSIS OF NATIONAL AUSTRALIA BANK
The Australian franking credits at a tax rate of 30% is carried by the franked
proportion of the dividends which depicts the latest Australian Company tax rate which is
30%. The rate at which the imputation credits of New Zealand has been attached to the
dividend is NZ$0.15 per share. The proportion of the profit of the group with respect to the
Australian income tax and the future changes to Australia’s business tax system are the main
factors that decides the extent to which the future dividends will be franked.
Chapter 2: Literature Review
The research of mutual funds and stock investments always discuss about the risk and
return from the stocks and mutual funds. The volatility of the market is estimated arbitrarily
accurately over a time period by the researchers (Wang & Xu, 2015). The empirical analysis
uses the secondary data and finds that the market volatility and the proportional ownership
are correlated (Adam, Marcet & Nicolini, 2016). The industry portfolios can also forecast the
market volatility formed from S&P stocks. There are papers that discusses about the stock
return volatility without calculating covariance (Conrad & Loch, 2015). These papers discuss
about the recent development and growth and major internal and external changes. These
includes the dividend, changes in managing board of director, legislative changes and the
international events. Apart from the market volatility and return volatility of the stock, there
are few factors that have impact on the risk of the return. These discussed for the NAB.
The average dividend of 99% for fully paid ordinary share for the year 2018 ended on
30th September, 100% paid on 5 July 2018. The payment was $2659 million and $2696
million in December, 2017 and July, 2018 respectively (ANNUAL FINANCIAL REPORT,
2018). Antony Cahill left NAB in August 2018. The recent changes in managing board of
director is mentioned as follows: Rachel Slade left NAB who was acting in the Group
Executive Customer Products and Services role from August 2018. This are the major
changes in NAB (ANNUAL FINANCIAL REPORT, 2018).
Paraphrase This Document
Need a fresh take? Get an instant paraphrase of this document with our AI Paraphraser
7
RISK ANALYSIS OF NATIONAL AUSTRALIA BANK
Chapter 2: Research Question
The study chooses the bank NAB which is listed in S&P.AX. This is a descriptive
study which analyses the banks current financial status to recommend whether to invest or
not in the stocks of NAB. Hence, the aim of the study is to find the risk and return of the
NAB to recommend investment.
Chapter 3: Methodology
The study collects secondary data of S&P.AX and NAB monthly closing share prices
from 2005 to 2018 and collected from the Yahoo finance (Yahoo is now a part of Oath,
2019). The data is used to calculate the average return and risk premium of NAB stocks in the
Australian stock market. To compare the growth of the financial stock of the company, two
time periods are considered. First time period starts from 2 February, 2005 to 1 February,
2012 and second time period starts from 2 February, 20012 to 1 February, 2019.
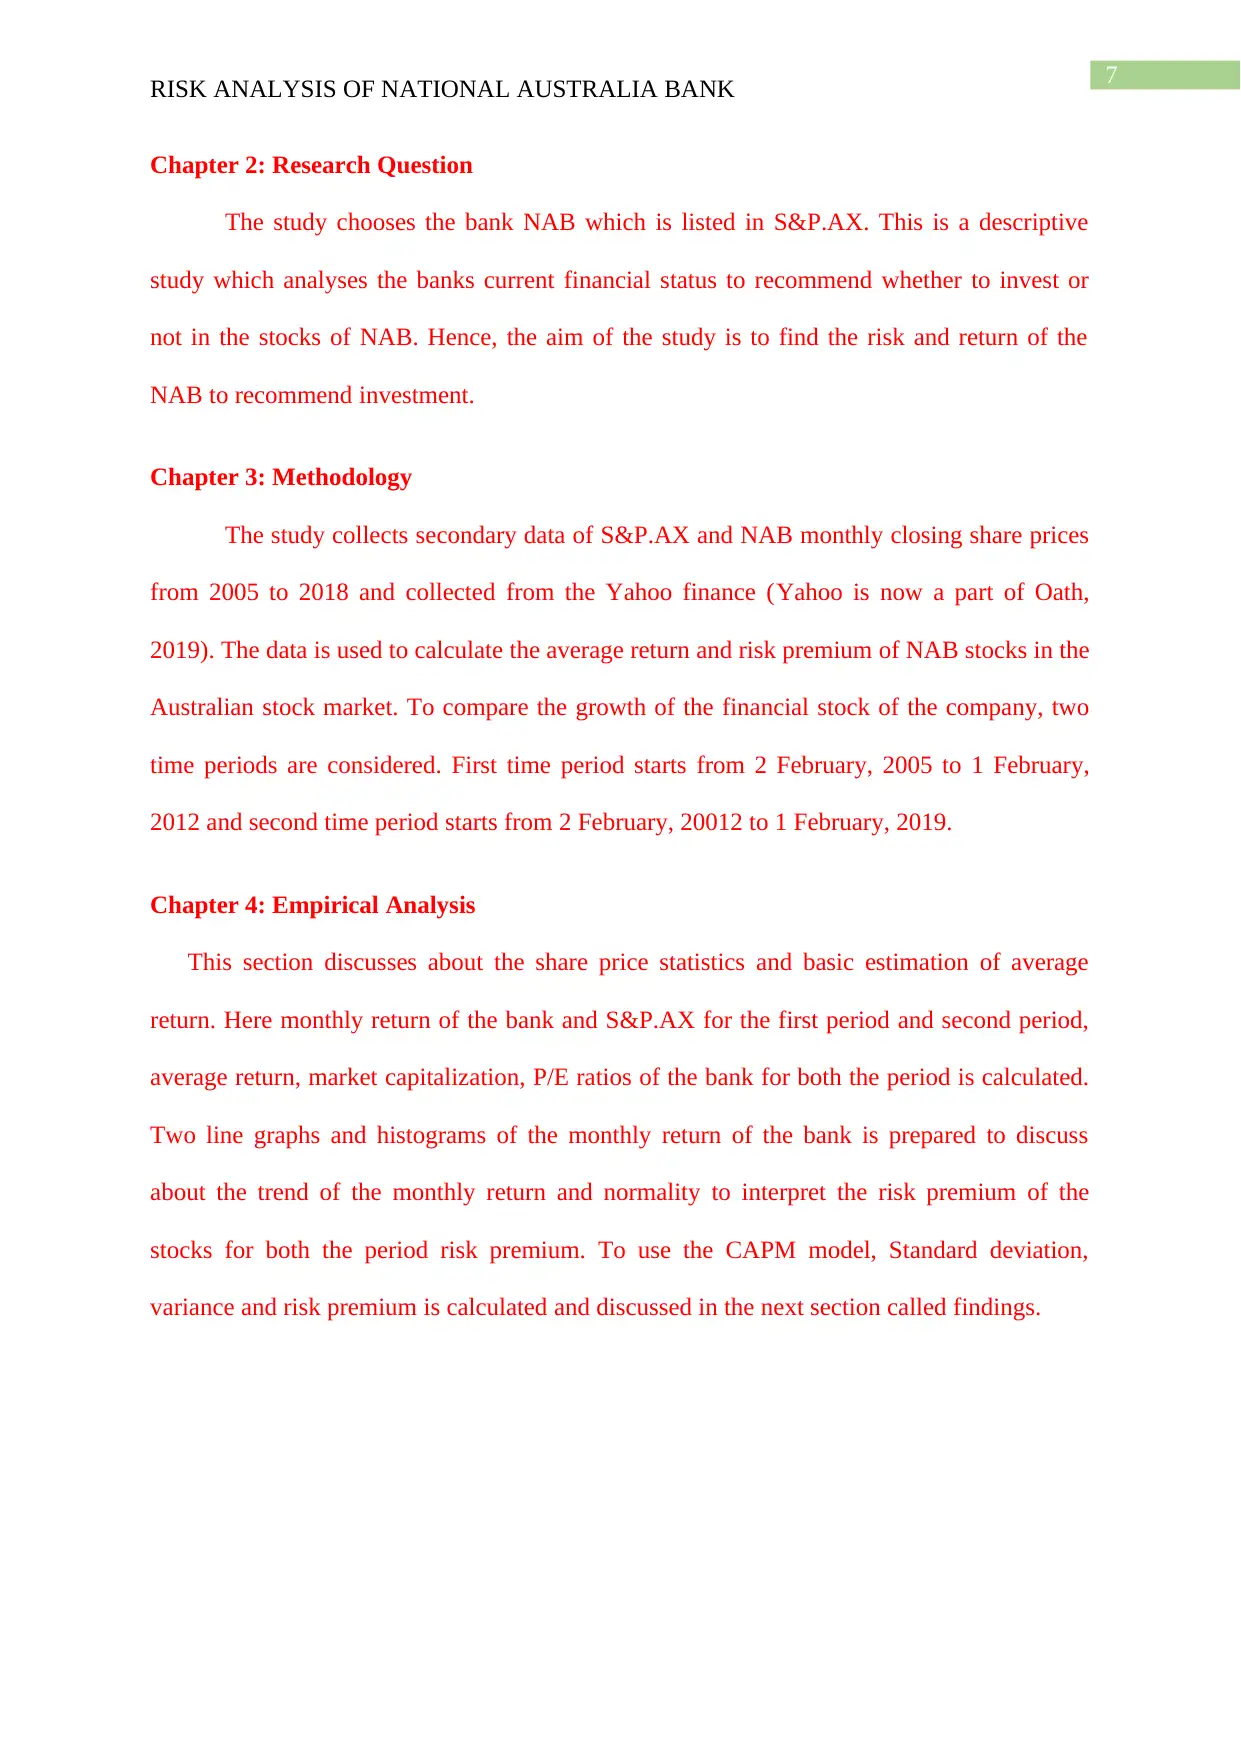
Chapter 4: Empirical Analysis
This section discusses about the share price statistics and basic estimation of average
return. Here monthly return of the bank and S&P.AX for the first period and second period,
average return, market capitalization, P/E ratios of the bank for both the period is calculated.
Two line graphs and histograms of the monthly return of the bank is prepared to discuss
about the trend of the monthly return and normality to interpret the risk premium of the
stocks for both the period risk premium. To use the CAPM model, Standard deviation,
variance and risk premium is calculated and discussed in the next section called findings.
RISK ANALYSIS OF NATIONAL AUSTRALIA BANK
Chapter 2: Research Question
The study chooses the bank NAB which is listed in S&P.AX. This is a descriptive
study which analyses the banks current financial status to recommend whether to invest or
not in the stocks of NAB. Hence, the aim of the study is to find the risk and return of the
NAB to recommend investment.
Chapter 3: Methodology
The study collects secondary data of S&P.AX and NAB monthly closing share prices
from 2005 to 2018 and collected from the Yahoo finance (Yahoo is now a part of Oath,
2019). The data is used to calculate the average return and risk premium of NAB stocks in the
Australian stock market. To compare the growth of the financial stock of the company, two
time periods are considered. First time period starts from 2 February, 2005 to 1 February,
2012 and second time period starts from 2 February, 20012 to 1 February, 2019.
Chapter 4: Empirical Analysis
This section discusses about the share price statistics and basic estimation of average
return. Here monthly return of the bank and S&P.AX for the first period and second period,
average return, market capitalization, P/E ratios of the bank for both the period is calculated.
Two line graphs and histograms of the monthly return of the bank is prepared to discuss
about the trend of the monthly return and normality to interpret the risk premium of the
stocks for both the period risk premium. To use the CAPM model, Standard deviation,
variance and risk premium is calculated and discussed in the next section called findings.
8
RISK ANALYSIS OF NATIONAL AUSTRALIA BANK
1. Monthly Return of NAB and S&P for the First Time
Date Monthly Retrun of S&P Monthly Retrun of NAB.AX Date Monthly Retrun of S&P Monthly Retrun of NAB.AX Date Monthly Retrun of S&P Monthly Retrun of NAB.AX
28-02-2005 30-06-2007 -0.021 -0.029 31-10-2009 0.013 -0.055
31-03-2005 -0.031 -0.006 31-07-2007 0.017 -0.076 30-11-2009 0.036 -0.014
30-04-2005 0.031 0.027 31-08-2007 0.051 0.054 31-12-2009 -0.062 -0.042
31-05-2005 0.042 0.078 30-09-2007 0.028 -0.012 31-01-2010 0.015 -0.038
30-06-2005 0.026 -0.028 31-10-2007 -0.033 0.098 28-02-2010 0.051 -0.029
31-07-2005 0.013 0.025 30-11-2007 -0.030 -0.115 31-03-2010 -0.014 0.075
31-08-2005 0.044 -0.003 31-12-2007 -0.109 -0.018 30-04-2010 -0.079 0.023
30-09-2005 -0.039 0.051 31-01-2008 -0.014 -0.070 31-05-2010 -0.029 -0.126
31-10-2005 0.039 0.006 29-02-2008 -0.039 -0.203 30-06-2010 0.045 -0.060
30-11-2005 0.028 -0.026 31-03-2008 0.045 0.077 31-07-2010 -0.020 0.101
31-12-2005 0.035 0.002 30-04-2008 0.011 0.007 31-08-2010 0.041 -0.073
31-01-2006 -0.002 0.049 31-05-2008 -0.078 0.030 30-09-2010 0.017 0.086
28-02-2006 0.042 0.075 30-06-2008 -0.046 -0.154 31-10-2010 -0.017 0.002
31-03-2006 0.025 0.031 31-07-2008 0.032 -0.081 30-11-2010 0.035 -0.097
30-04-2006 -0.049 0.001 31-08-2008 -0.104 -0.008 31-12-2010 0.002 0.025
31-05-2006 0.014 -0.059 30-09-2008 -0.127 0.029 31-01-2011 0.016 0.031
30-06-2006 -0.017 -0.014 31-10-2008 -0.069 -0.024 28-02-2011 0.001 0.060
31-07-2006 0.026 0.021 30-11-2008 -0.005 -0.174 31-03-2011 -0.003 -0.003
31-08-2006 0.008 0.014 31-12-2008 -0.049 0.043 30-04-2011 -0.024 0.050
30-09-2006 0.045 0.014 31-01-2009 -0.055 -0.095 31-05-2011 -0.021 -0.027
31-10-2006 0.018 0.040 28-02-2009 0.071 -0.073 30-06-2011 -0.040 -0.032
30-11-2006 0.034 0.022 31-03-2009 0.055 0.149 31-07-2011 -0.029 -0.047
31-12-2006 0.018 0.035 30-04-2009 0.010 0.022 31-08-2011 -0.067 -0.021
31-01-2007 0.010 0.002 31-05-2009 0.036 0.073 30-09-2011 0.072 -0.083
28-02-2007 0.028 -0.002 30-06-2009 0.073 0.002 31-10-2011 -0.041 0.164
31-03-2007 0.029 0.000 31-07-2009 0.055 0.124 30-11-2011 -0.015 -0.046
30-04-2007 0.024 0.061 31-08-2009 0.059 0.152 31-12-2011 0.051 -0.037
31-05-2007 -0.006 -0.011 30-09-2009 -0.021 0.069 31-01-2012 0.008 0.011
2. Monthly Return of NAB and S&P for the Second Time
Date Monthly Retrun of S&P Monthly Retrun of NAB.AX Date Monthly Retrun of S&P Monthly Retrun of NAb.AX Date Monthly Retrun of S&P Monthly Retrun of NAB.AX
29-02-2012 30-06-2014 0.044 -0.021 31-10-2016 0.023 0.000
31-03-2012 0.014 0.053 31-07-2014 -0.001 0.067 30-11-2016 0.041 0.037
30-04-2012 -0.073 0.024 31-08-2014 -0.059 0.009 31-12-2016 -0.008 0.056
31-05-2012 0.004 -0.123 30-09-2014 0.044 -0.090 31-01-2017 0.016 -0.014
30-06-2012 0.043 0.067 31-10-2014 -0.039 0.089 28-02-2017 0.027 0.055
31-07-2012 0.011 0.054 30-11-2014 0.018 -0.068 31-03-2017 0.010 0.040
31-08-2012 0.016 0.008 31-12-2014 0.033 0.030 30-04-2017 -0.034 0.025
30-09-2012 0.030 0.012 31-01-2015 0.061 0.060 31-05-2017 -0.001 -0.108
31-10-2012 -0.002 0.001 28-02-2015 -0.006 0.065 30-06-2017 0.000 -0.023
30-11-2012 0.032 -0.050 31-03-2015 -0.017 0.013 31-07-2017 -0.001 0.011
31-12-2012 0.049 0.031 30-04-2015 -0.002 -0.043 31-08-2017 -0.006 0.015
31-01-2013 0.046 0.098 31-05-2015 -0.055 -0.057 30-09-2017 0.040 0.038
28-02-2013 -0.027 0.095 30-06-2015 0.044 -0.021 31-10-2017 0.010 0.040
31-03-2013 0.045 0.026 31-07-2015 -0.086 0.035 30-11-2017 0.016 -0.097
30-04-2013 -0.051 0.102 31-08-2015 -0.036 -0.109 31-12-2017 -0.005 -0.002
31-05-2013 -0.025 -0.144 30-09-2015 0.043 -0.027 31-01-2018 -0.004 -0.011
30-06-2013 0.052 0.010 31-10-2015 -0.014 0.002 28-02-2018 -0.043 0.028
31-07-2013 0.016 0.063 30-11-2015 0.025 -0.023 31-03-2018 0.039 -0.052
31-08-2013 0.016 0.047 31-12-2015 -0.055 0.027 30-04-2018 0.005 0.016
30-09-2013 0.040 0.052 31-01-2016 -0.025 -0.075 31-05-2018 0.030 -0.079
31-10-2013 -0.019 0.029 29-02-2016 0.041 -0.102 30-06-2018 0.014 0.032
30-11-2013 0.006 -0.018 31-03-2016 0.033 0.070 31-07-2018 0.006 0.029
31-12-2013 -0.030 0.002 30-04-2016 0.024 0.032 31-08-2018 -0.018 0.007
31-01-2014 0.041 -0.047 31-05-2016 -0.027 0.003 30-09-2018 -0.061 -0.028
28-02-2014 -0.002 0.046 30-06-2016 0.063 -0.044 31-10-2018 -0.028 -0.080
31-03-2014 0.017 0.022 31-07-2016 -0.023 0.036 30-11-2018 -0.004 -0.021
30-04-2014 0.001 -0.004 31-08-2016 0.001 0.030 31-12-2018 0.039 -0.036
31-05-2014 -0.018 -0.051 30-09-2016 -0.022 0.024 31-01-2019 0.052 -0.224
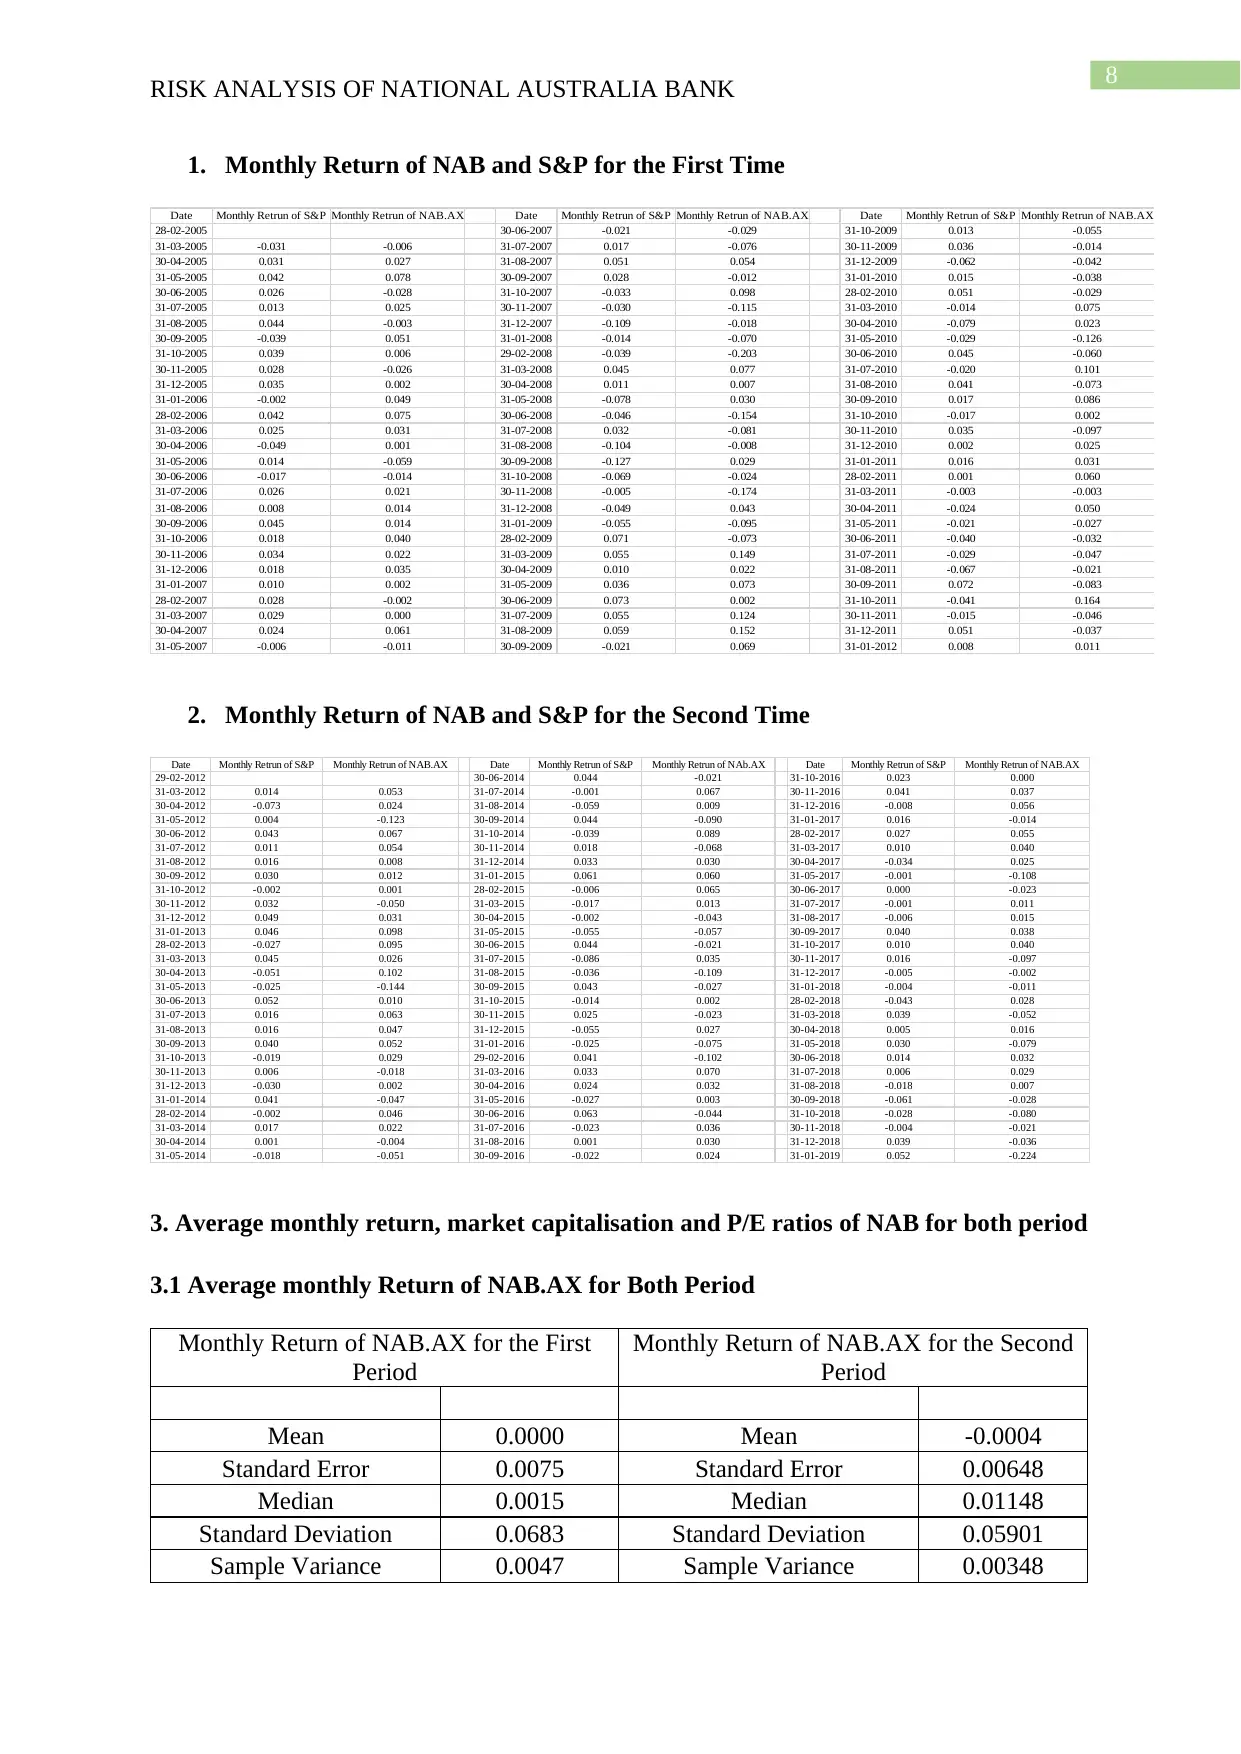
3. Average monthly return, market capitalisation and P/E ratios of NAB for both period
3.1 Average monthly Return of NAB.AX for Both Period
Monthly Return of NAB.AX for the First
Period
Monthly Return of NAB.AX for the Second
Period
Mean 0.0000 Mean -0.0004
Standard Error 0.0075 Standard Error 0.00648
Median 0.0015 Median 0.01148
Standard Deviation 0.0683 Standard Deviation 0.05901
Sample Variance 0.0047 Sample Variance 0.00348
RISK ANALYSIS OF NATIONAL AUSTRALIA BANK
1. Monthly Return of NAB and S&P for the First Time
Date Monthly Retrun of S&P Monthly Retrun of NAB.AX Date Monthly Retrun of S&P Monthly Retrun of NAB.AX Date Monthly Retrun of S&P Monthly Retrun of NAB.AX
28-02-2005 30-06-2007 -0.021 -0.029 31-10-2009 0.013 -0.055
31-03-2005 -0.031 -0.006 31-07-2007 0.017 -0.076 30-11-2009 0.036 -0.014
30-04-2005 0.031 0.027 31-08-2007 0.051 0.054 31-12-2009 -0.062 -0.042
31-05-2005 0.042 0.078 30-09-2007 0.028 -0.012 31-01-2010 0.015 -0.038
30-06-2005 0.026 -0.028 31-10-2007 -0.033 0.098 28-02-2010 0.051 -0.029
31-07-2005 0.013 0.025 30-11-2007 -0.030 -0.115 31-03-2010 -0.014 0.075
31-08-2005 0.044 -0.003 31-12-2007 -0.109 -0.018 30-04-2010 -0.079 0.023
30-09-2005 -0.039 0.051 31-01-2008 -0.014 -0.070 31-05-2010 -0.029 -0.126
31-10-2005 0.039 0.006 29-02-2008 -0.039 -0.203 30-06-2010 0.045 -0.060
30-11-2005 0.028 -0.026 31-03-2008 0.045 0.077 31-07-2010 -0.020 0.101
31-12-2005 0.035 0.002 30-04-2008 0.011 0.007 31-08-2010 0.041 -0.073
31-01-2006 -0.002 0.049 31-05-2008 -0.078 0.030 30-09-2010 0.017 0.086
28-02-2006 0.042 0.075 30-06-2008 -0.046 -0.154 31-10-2010 -0.017 0.002
31-03-2006 0.025 0.031 31-07-2008 0.032 -0.081 30-11-2010 0.035 -0.097
30-04-2006 -0.049 0.001 31-08-2008 -0.104 -0.008 31-12-2010 0.002 0.025
31-05-2006 0.014 -0.059 30-09-2008 -0.127 0.029 31-01-2011 0.016 0.031
30-06-2006 -0.017 -0.014 31-10-2008 -0.069 -0.024 28-02-2011 0.001 0.060
31-07-2006 0.026 0.021 30-11-2008 -0.005 -0.174 31-03-2011 -0.003 -0.003
31-08-2006 0.008 0.014 31-12-2008 -0.049 0.043 30-04-2011 -0.024 0.050
30-09-2006 0.045 0.014 31-01-2009 -0.055 -0.095 31-05-2011 -0.021 -0.027
31-10-2006 0.018 0.040 28-02-2009 0.071 -0.073 30-06-2011 -0.040 -0.032
30-11-2006 0.034 0.022 31-03-2009 0.055 0.149 31-07-2011 -0.029 -0.047
31-12-2006 0.018 0.035 30-04-2009 0.010 0.022 31-08-2011 -0.067 -0.021
31-01-2007 0.010 0.002 31-05-2009 0.036 0.073 30-09-2011 0.072 -0.083
28-02-2007 0.028 -0.002 30-06-2009 0.073 0.002 31-10-2011 -0.041 0.164
31-03-2007 0.029 0.000 31-07-2009 0.055 0.124 30-11-2011 -0.015 -0.046
30-04-2007 0.024 0.061 31-08-2009 0.059 0.152 31-12-2011 0.051 -0.037
31-05-2007 -0.006 -0.011 30-09-2009 -0.021 0.069 31-01-2012 0.008 0.011
2. Monthly Return of NAB and S&P for the Second Time
Date Monthly Retrun of S&P Monthly Retrun of NAB.AX Date Monthly Retrun of S&P Monthly Retrun of NAb.AX Date Monthly Retrun of S&P Monthly Retrun of NAB.AX
29-02-2012 30-06-2014 0.044 -0.021 31-10-2016 0.023 0.000
31-03-2012 0.014 0.053 31-07-2014 -0.001 0.067 30-11-2016 0.041 0.037
30-04-2012 -0.073 0.024 31-08-2014 -0.059 0.009 31-12-2016 -0.008 0.056
31-05-2012 0.004 -0.123 30-09-2014 0.044 -0.090 31-01-2017 0.016 -0.014
30-06-2012 0.043 0.067 31-10-2014 -0.039 0.089 28-02-2017 0.027 0.055
31-07-2012 0.011 0.054 30-11-2014 0.018 -0.068 31-03-2017 0.010 0.040
31-08-2012 0.016 0.008 31-12-2014 0.033 0.030 30-04-2017 -0.034 0.025
30-09-2012 0.030 0.012 31-01-2015 0.061 0.060 31-05-2017 -0.001 -0.108
31-10-2012 -0.002 0.001 28-02-2015 -0.006 0.065 30-06-2017 0.000 -0.023
30-11-2012 0.032 -0.050 31-03-2015 -0.017 0.013 31-07-2017 -0.001 0.011
31-12-2012 0.049 0.031 30-04-2015 -0.002 -0.043 31-08-2017 -0.006 0.015
31-01-2013 0.046 0.098 31-05-2015 -0.055 -0.057 30-09-2017 0.040 0.038
28-02-2013 -0.027 0.095 30-06-2015 0.044 -0.021 31-10-2017 0.010 0.040
31-03-2013 0.045 0.026 31-07-2015 -0.086 0.035 30-11-2017 0.016 -0.097
30-04-2013 -0.051 0.102 31-08-2015 -0.036 -0.109 31-12-2017 -0.005 -0.002
31-05-2013 -0.025 -0.144 30-09-2015 0.043 -0.027 31-01-2018 -0.004 -0.011
30-06-2013 0.052 0.010 31-10-2015 -0.014 0.002 28-02-2018 -0.043 0.028
31-07-2013 0.016 0.063 30-11-2015 0.025 -0.023 31-03-2018 0.039 -0.052
31-08-2013 0.016 0.047 31-12-2015 -0.055 0.027 30-04-2018 0.005 0.016
30-09-2013 0.040 0.052 31-01-2016 -0.025 -0.075 31-05-2018 0.030 -0.079
31-10-2013 -0.019 0.029 29-02-2016 0.041 -0.102 30-06-2018 0.014 0.032
30-11-2013 0.006 -0.018 31-03-2016 0.033 0.070 31-07-2018 0.006 0.029
31-12-2013 -0.030 0.002 30-04-2016 0.024 0.032 31-08-2018 -0.018 0.007
31-01-2014 0.041 -0.047 31-05-2016 -0.027 0.003 30-09-2018 -0.061 -0.028
28-02-2014 -0.002 0.046 30-06-2016 0.063 -0.044 31-10-2018 -0.028 -0.080
31-03-2014 0.017 0.022 31-07-2016 -0.023 0.036 30-11-2018 -0.004 -0.021
30-04-2014 0.001 -0.004 31-08-2016 0.001 0.030 31-12-2018 0.039 -0.036
31-05-2014 -0.018 -0.051 30-09-2016 -0.022 0.024 31-01-2019 0.052 -0.224
3. Average monthly return, market capitalisation and P/E ratios of NAB for both period
3.1 Average monthly Return of NAB.AX for Both Period
Monthly Return of NAB.AX for the First
Period
Monthly Return of NAB.AX for the Second
Period
Mean 0.0000 Mean -0.0004
Standard Error 0.0075 Standard Error 0.00648
Median 0.0015 Median 0.01148
Standard Deviation 0.0683 Standard Deviation 0.05901
Sample Variance 0.0047 Sample Variance 0.00348
⊘ This is a preview!⊘
Do you want full access?
Subscribe today to unlock all pages.
Trusted by 1+ million students worldwide
9
RISK ANALYSIS OF NATIONAL AUSTRALIA BANK
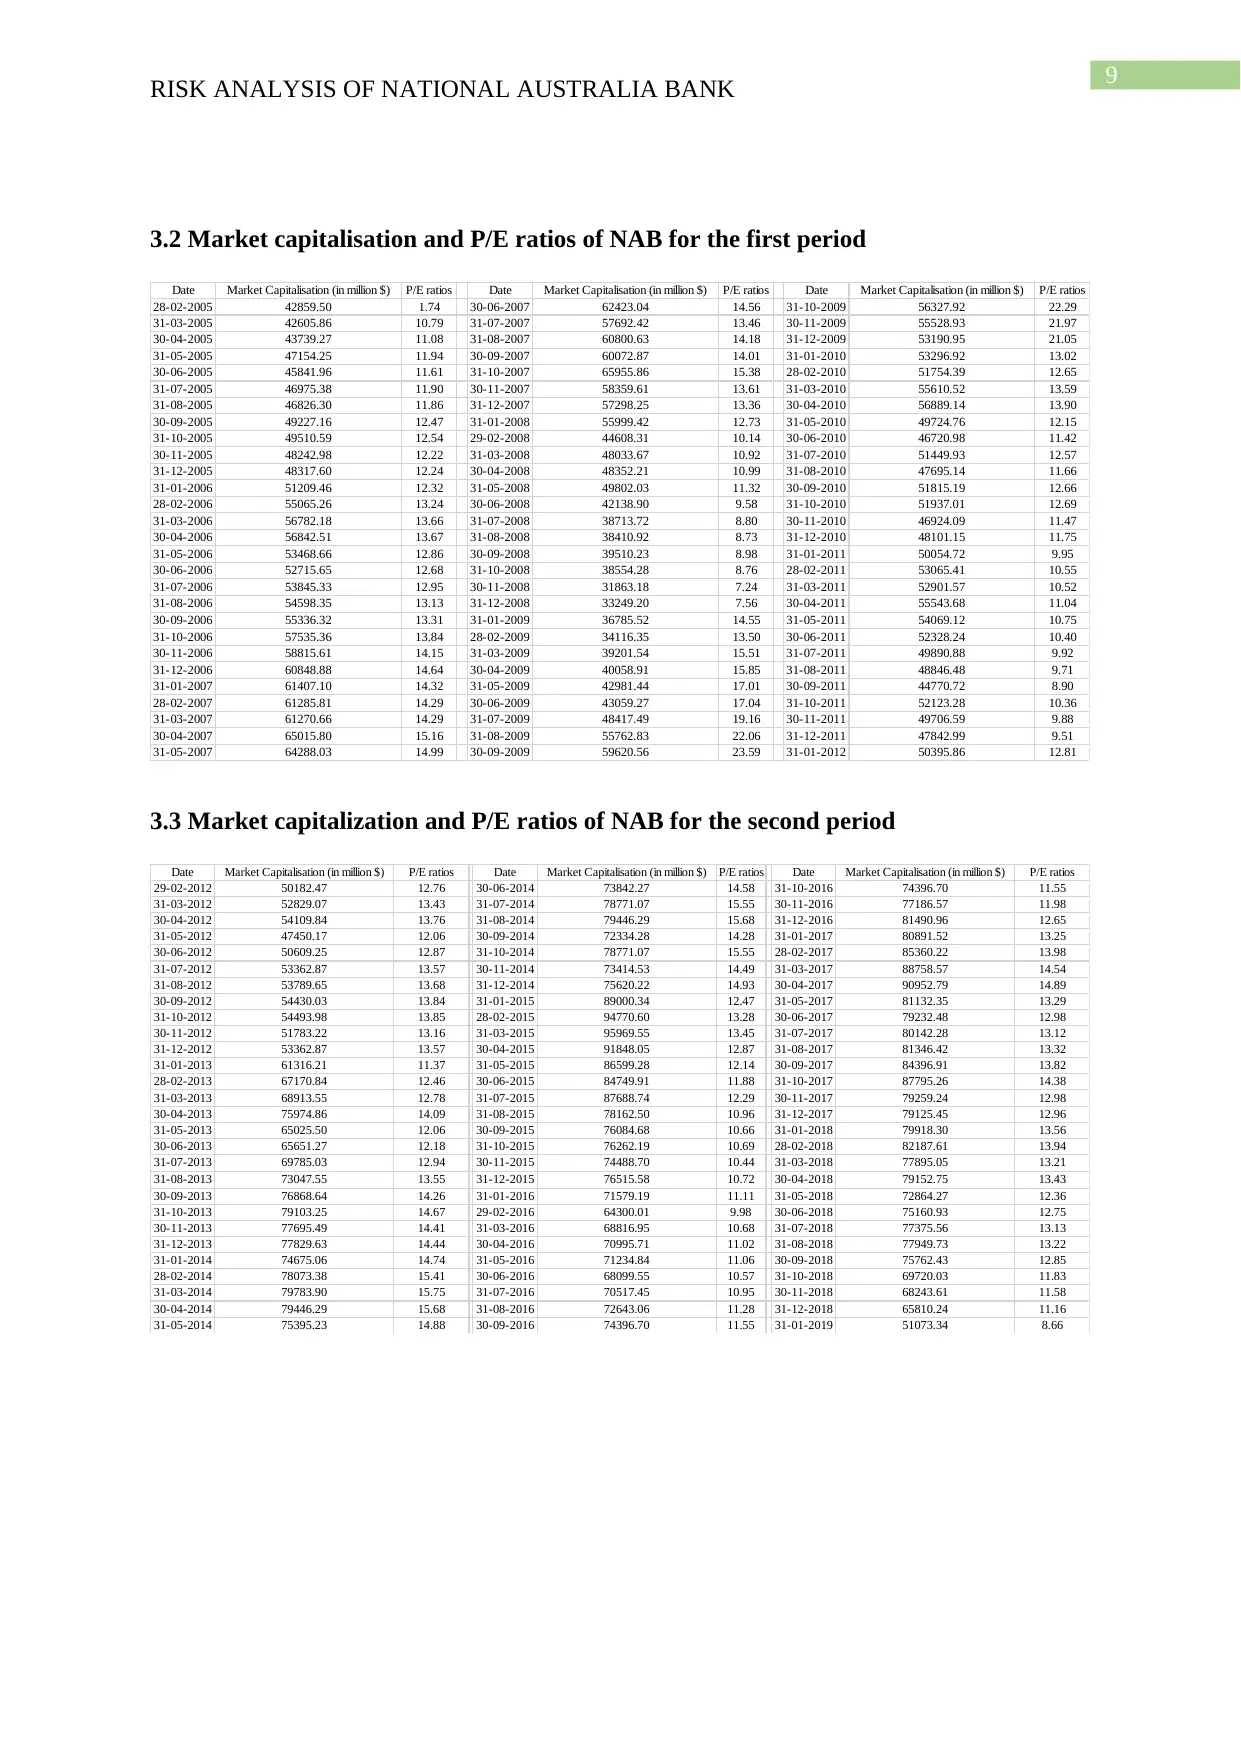
3.2 Market capitalisation and P/E ratios of NAB for the first period
Date Market Capitalisation (in million $) P/E ratios Date Market Capitalisation (in million $) P/E ratios Date Market Capitalisation (in million $) P/E ratios
28-02-2005 42859.50 1.74 30-06-2007 62423.04 14.56 31-10-2009 56327.92 22.29
31-03-2005 42605.86 10.79 31-07-2007 57692.42 13.46 30-11-2009 55528.93 21.97
30-04-2005 43739.27 11.08 31-08-2007 60800.63 14.18 31-12-2009 53190.95 21.05
31-05-2005 47154.25 11.94 30-09-2007 60072.87 14.01 31-01-2010 53296.92 13.02
30-06-2005 45841.96 11.61 31-10-2007 65955.86 15.38 28-02-2010 51754.39 12.65
31-07-2005 46975.38 11.90 30-11-2007 58359.61 13.61 31-03-2010 55610.52 13.59
31-08-2005 46826.30 11.86 31-12-2007 57298.25 13.36 30-04-2010 56889.14 13.90
30-09-2005 49227.16 12.47 31-01-2008 55999.42 12.73 31-05-2010 49724.76 12.15
31-10-2005 49510.59 12.54 29-02-2008 44608.31 10.14 30-06-2010 46720.98 11.42
30-11-2005 48242.98 12.22 31-03-2008 48033.67 10.92 31-07-2010 51449.93 12.57
31-12-2005 48317.60 12.24 30-04-2008 48352.21 10.99 31-08-2010 47695.14 11.66
31-01-2006 51209.46 12.32 31-05-2008 49802.03 11.32 30-09-2010 51815.19 12.66
28-02-2006 55065.26 13.24 30-06-2008 42138.90 9.58 31-10-2010 51937.01 12.69
31-03-2006 56782.18 13.66 31-07-2008 38713.72 8.80 30-11-2010 46924.09 11.47
30-04-2006 56842.51 13.67 31-08-2008 38410.92 8.73 31-12-2010 48101.15 11.75
31-05-2006 53468.66 12.86 30-09-2008 39510.23 8.98 31-01-2011 50054.72 9.95
30-06-2006 52715.65 12.68 31-10-2008 38554.28 8.76 28-02-2011 53065.41 10.55
31-07-2006 53845.33 12.95 30-11-2008 31863.18 7.24 31-03-2011 52901.57 10.52
31-08-2006 54598.35 13.13 31-12-2008 33249.20 7.56 30-04-2011 55543.68 11.04
30-09-2006 55336.32 13.31 31-01-2009 36785.52 14.55 31-05-2011 54069.12 10.75
31-10-2006 57535.36 13.84 28-02-2009 34116.35 13.50 30-06-2011 52328.24 10.40
30-11-2006 58815.61 14.15 31-03-2009 39201.54 15.51 31-07-2011 49890.88 9.92
31-12-2006 60848.88 14.64 30-04-2009 40058.91 15.85 31-08-2011 48846.48 9.71
31-01-2007 61407.10 14.32 31-05-2009 42981.44 17.01 30-09-2011 44770.72 8.90
28-02-2007 61285.81 14.29 30-06-2009 43059.27 17.04 31-10-2011 52123.28 10.36
31-03-2007 61270.66 14.29 31-07-2009 48417.49 19.16 30-11-2011 49706.59 9.88
30-04-2007 65015.80 15.16 31-08-2009 55762.83 22.06 31-12-2011 47842.99 9.51
31-05-2007 64288.03 14.99 30-09-2009 59620.56 23.59 31-01-2012 50395.86 12.81
3.3 Market capitalization and P/E ratios of NAB for the second period
Date Market Capitalisation (in million $) P/E ratios Date Market Capitalisation (in million $) P/E ratios Date Market Capitalisation (in million $) P/E ratios
29-02-2012 50182.47 12.76 30-06-2014 73842.27 14.58 31-10-2016 74396.70 11.55
31-03-2012 52829.07 13.43 31-07-2014 78771.07 15.55 30-11-2016 77186.57 11.98
30-04-2012 54109.84 13.76 31-08-2014 79446.29 15.68 31-12-2016 81490.96 12.65
31-05-2012 47450.17 12.06 30-09-2014 72334.28 14.28 31-01-2017 80891.52 13.25
30-06-2012 50609.25 12.87 31-10-2014 78771.07 15.55 28-02-2017 85360.22 13.98
31-07-2012 53362.87 13.57 30-11-2014 73414.53 14.49 31-03-2017 88758.57 14.54
31-08-2012 53789.65 13.68 31-12-2014 75620.22 14.93 30-04-2017 90952.79 14.89
30-09-2012 54430.03 13.84 31-01-2015 89000.34 12.47 31-05-2017 81132.35 13.29
31-10-2012 54493.98 13.85 28-02-2015 94770.60 13.28 30-06-2017 79232.48 12.98
30-11-2012 51783.22 13.16 31-03-2015 95969.55 13.45 31-07-2017 80142.28 13.12
31-12-2012 53362.87 13.57 30-04-2015 91848.05 12.87 31-08-2017 81346.42 13.32
31-01-2013 61316.21 11.37 31-05-2015 86599.28 12.14 30-09-2017 84396.91 13.82
28-02-2013 67170.84 12.46 30-06-2015 84749.91 11.88 31-10-2017 87795.26 14.38
31-03-2013 68913.55 12.78 31-07-2015 87688.74 12.29 30-11-2017 79259.24 12.98
30-04-2013 75974.86 14.09 31-08-2015 78162.50 10.96 31-12-2017 79125.45 12.96
31-05-2013 65025.50 12.06 30-09-2015 76084.68 10.66 31-01-2018 79918.30 13.56
30-06-2013 65651.27 12.18 31-10-2015 76262.19 10.69 28-02-2018 82187.61 13.94
31-07-2013 69785.03 12.94 30-11-2015 74488.70 10.44 31-03-2018 77895.05 13.21
31-08-2013 73047.55 13.55 31-12-2015 76515.58 10.72 30-04-2018 79152.75 13.43
30-09-2013 76868.64 14.26 31-01-2016 71579.19 11.11 31-05-2018 72864.27 12.36
31-10-2013 79103.25 14.67 29-02-2016 64300.01 9.98 30-06-2018 75160.93 12.75
30-11-2013 77695.49 14.41 31-03-2016 68816.95 10.68 31-07-2018 77375.56 13.13
31-12-2013 77829.63 14.44 30-04-2016 70995.71 11.02 31-08-2018 77949.73 13.22
31-01-2014 74675.06 14.74 31-05-2016 71234.84 11.06 30-09-2018 75762.43 12.85
28-02-2014 78073.38 15.41 30-06-2016 68099.55 10.57 31-10-2018 69720.03 11.83
31-03-2014 79783.90 15.75 31-07-2016 70517.45 10.95 30-11-2018 68243.61 11.58
30-04-2014 79446.29 15.68 31-08-2016 72643.06 11.28 31-12-2018 65810.24 11.16
31-05-2014 75395.23 14.88 30-09-2016 74396.70 11.55 31-01-2019 51073.34 8.66
RISK ANALYSIS OF NATIONAL AUSTRALIA BANK
3.2 Market capitalisation and P/E ratios of NAB for the first period
Date Market Capitalisation (in million $) P/E ratios Date Market Capitalisation (in million $) P/E ratios Date Market Capitalisation (in million $) P/E ratios
28-02-2005 42859.50 1.74 30-06-2007 62423.04 14.56 31-10-2009 56327.92 22.29
31-03-2005 42605.86 10.79 31-07-2007 57692.42 13.46 30-11-2009 55528.93 21.97
30-04-2005 43739.27 11.08 31-08-2007 60800.63 14.18 31-12-2009 53190.95 21.05
31-05-2005 47154.25 11.94 30-09-2007 60072.87 14.01 31-01-2010 53296.92 13.02
30-06-2005 45841.96 11.61 31-10-2007 65955.86 15.38 28-02-2010 51754.39 12.65
31-07-2005 46975.38 11.90 30-11-2007 58359.61 13.61 31-03-2010 55610.52 13.59
31-08-2005 46826.30 11.86 31-12-2007 57298.25 13.36 30-04-2010 56889.14 13.90
30-09-2005 49227.16 12.47 31-01-2008 55999.42 12.73 31-05-2010 49724.76 12.15
31-10-2005 49510.59 12.54 29-02-2008 44608.31 10.14 30-06-2010 46720.98 11.42
30-11-2005 48242.98 12.22 31-03-2008 48033.67 10.92 31-07-2010 51449.93 12.57
31-12-2005 48317.60 12.24 30-04-2008 48352.21 10.99 31-08-2010 47695.14 11.66
31-01-2006 51209.46 12.32 31-05-2008 49802.03 11.32 30-09-2010 51815.19 12.66
28-02-2006 55065.26 13.24 30-06-2008 42138.90 9.58 31-10-2010 51937.01 12.69
31-03-2006 56782.18 13.66 31-07-2008 38713.72 8.80 30-11-2010 46924.09 11.47
30-04-2006 56842.51 13.67 31-08-2008 38410.92 8.73 31-12-2010 48101.15 11.75
31-05-2006 53468.66 12.86 30-09-2008 39510.23 8.98 31-01-2011 50054.72 9.95
30-06-2006 52715.65 12.68 31-10-2008 38554.28 8.76 28-02-2011 53065.41 10.55
31-07-2006 53845.33 12.95 30-11-2008 31863.18 7.24 31-03-2011 52901.57 10.52
31-08-2006 54598.35 13.13 31-12-2008 33249.20 7.56 30-04-2011 55543.68 11.04
30-09-2006 55336.32 13.31 31-01-2009 36785.52 14.55 31-05-2011 54069.12 10.75
31-10-2006 57535.36 13.84 28-02-2009 34116.35 13.50 30-06-2011 52328.24 10.40
30-11-2006 58815.61 14.15 31-03-2009 39201.54 15.51 31-07-2011 49890.88 9.92
31-12-2006 60848.88 14.64 30-04-2009 40058.91 15.85 31-08-2011 48846.48 9.71
31-01-2007 61407.10 14.32 31-05-2009 42981.44 17.01 30-09-2011 44770.72 8.90
28-02-2007 61285.81 14.29 30-06-2009 43059.27 17.04 31-10-2011 52123.28 10.36
31-03-2007 61270.66 14.29 31-07-2009 48417.49 19.16 30-11-2011 49706.59 9.88
30-04-2007 65015.80 15.16 31-08-2009 55762.83 22.06 31-12-2011 47842.99 9.51
31-05-2007 64288.03 14.99 30-09-2009 59620.56 23.59 31-01-2012 50395.86 12.81
3.3 Market capitalization and P/E ratios of NAB for the second period
Date Market Capitalisation (in million $) P/E ratios Date Market Capitalisation (in million $) P/E ratios Date Market Capitalisation (in million $) P/E ratios
29-02-2012 50182.47 12.76 30-06-2014 73842.27 14.58 31-10-2016 74396.70 11.55
31-03-2012 52829.07 13.43 31-07-2014 78771.07 15.55 30-11-2016 77186.57 11.98
30-04-2012 54109.84 13.76 31-08-2014 79446.29 15.68 31-12-2016 81490.96 12.65
31-05-2012 47450.17 12.06 30-09-2014 72334.28 14.28 31-01-2017 80891.52 13.25
30-06-2012 50609.25 12.87 31-10-2014 78771.07 15.55 28-02-2017 85360.22 13.98
31-07-2012 53362.87 13.57 30-11-2014 73414.53 14.49 31-03-2017 88758.57 14.54
31-08-2012 53789.65 13.68 31-12-2014 75620.22 14.93 30-04-2017 90952.79 14.89
30-09-2012 54430.03 13.84 31-01-2015 89000.34 12.47 31-05-2017 81132.35 13.29
31-10-2012 54493.98 13.85 28-02-2015 94770.60 13.28 30-06-2017 79232.48 12.98
30-11-2012 51783.22 13.16 31-03-2015 95969.55 13.45 31-07-2017 80142.28 13.12
31-12-2012 53362.87 13.57 30-04-2015 91848.05 12.87 31-08-2017 81346.42 13.32
31-01-2013 61316.21 11.37 31-05-2015 86599.28 12.14 30-09-2017 84396.91 13.82
28-02-2013 67170.84 12.46 30-06-2015 84749.91 11.88 31-10-2017 87795.26 14.38
31-03-2013 68913.55 12.78 31-07-2015 87688.74 12.29 30-11-2017 79259.24 12.98
30-04-2013 75974.86 14.09 31-08-2015 78162.50 10.96 31-12-2017 79125.45 12.96
31-05-2013 65025.50 12.06 30-09-2015 76084.68 10.66 31-01-2018 79918.30 13.56
30-06-2013 65651.27 12.18 31-10-2015 76262.19 10.69 28-02-2018 82187.61 13.94
31-07-2013 69785.03 12.94 30-11-2015 74488.70 10.44 31-03-2018 77895.05 13.21
31-08-2013 73047.55 13.55 31-12-2015 76515.58 10.72 30-04-2018 79152.75 13.43
30-09-2013 76868.64 14.26 31-01-2016 71579.19 11.11 31-05-2018 72864.27 12.36
31-10-2013 79103.25 14.67 29-02-2016 64300.01 9.98 30-06-2018 75160.93 12.75
30-11-2013 77695.49 14.41 31-03-2016 68816.95 10.68 31-07-2018 77375.56 13.13
31-12-2013 77829.63 14.44 30-04-2016 70995.71 11.02 31-08-2018 77949.73 13.22
31-01-2014 74675.06 14.74 31-05-2016 71234.84 11.06 30-09-2018 75762.43 12.85
28-02-2014 78073.38 15.41 30-06-2016 68099.55 10.57 31-10-2018 69720.03 11.83
31-03-2014 79783.90 15.75 31-07-2016 70517.45 10.95 30-11-2018 68243.61 11.58
30-04-2014 79446.29 15.68 31-08-2016 72643.06 11.28 31-12-2018 65810.24 11.16
31-05-2014 75395.23 14.88 30-09-2016 74396.70 11.55 31-01-2019 51073.34 8.66
Paraphrase This Document
Need a fresh take? Get an instant paraphrase of this document with our AI Paraphraser
10
RISK ANALYSIS OF NATIONAL AUSTRALIA BANK
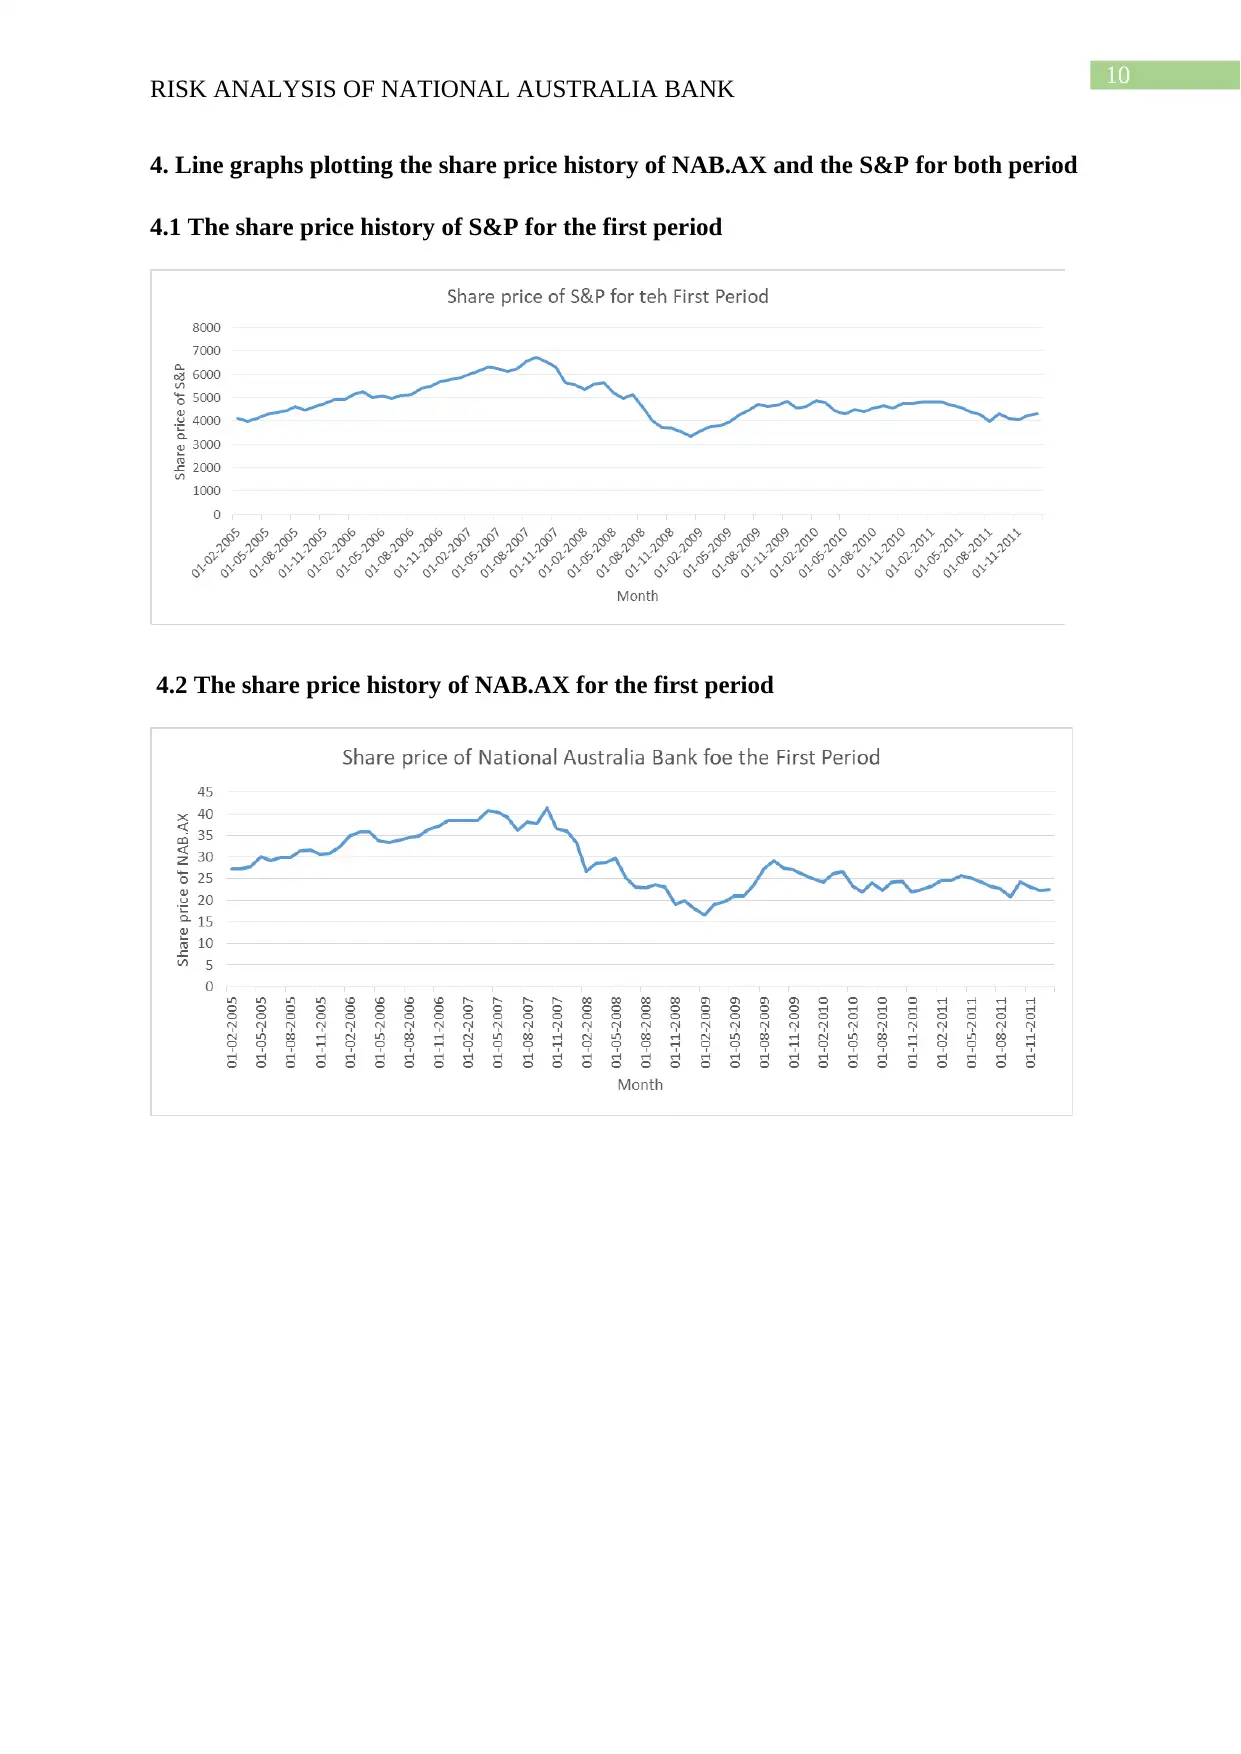
4. Line graphs plotting the share price history of NAB.AX and the S&P for both period
4.1 The share price history of S&P for the first period
4.2 The share price history of NAB.AX for the first period
RISK ANALYSIS OF NATIONAL AUSTRALIA BANK
4. Line graphs plotting the share price history of NAB.AX and the S&P for both period
4.1 The share price history of S&P for the first period
4.2 The share price history of NAB.AX for the first period
11
RISK ANALYSIS OF NATIONAL AUSTRALIA BANK
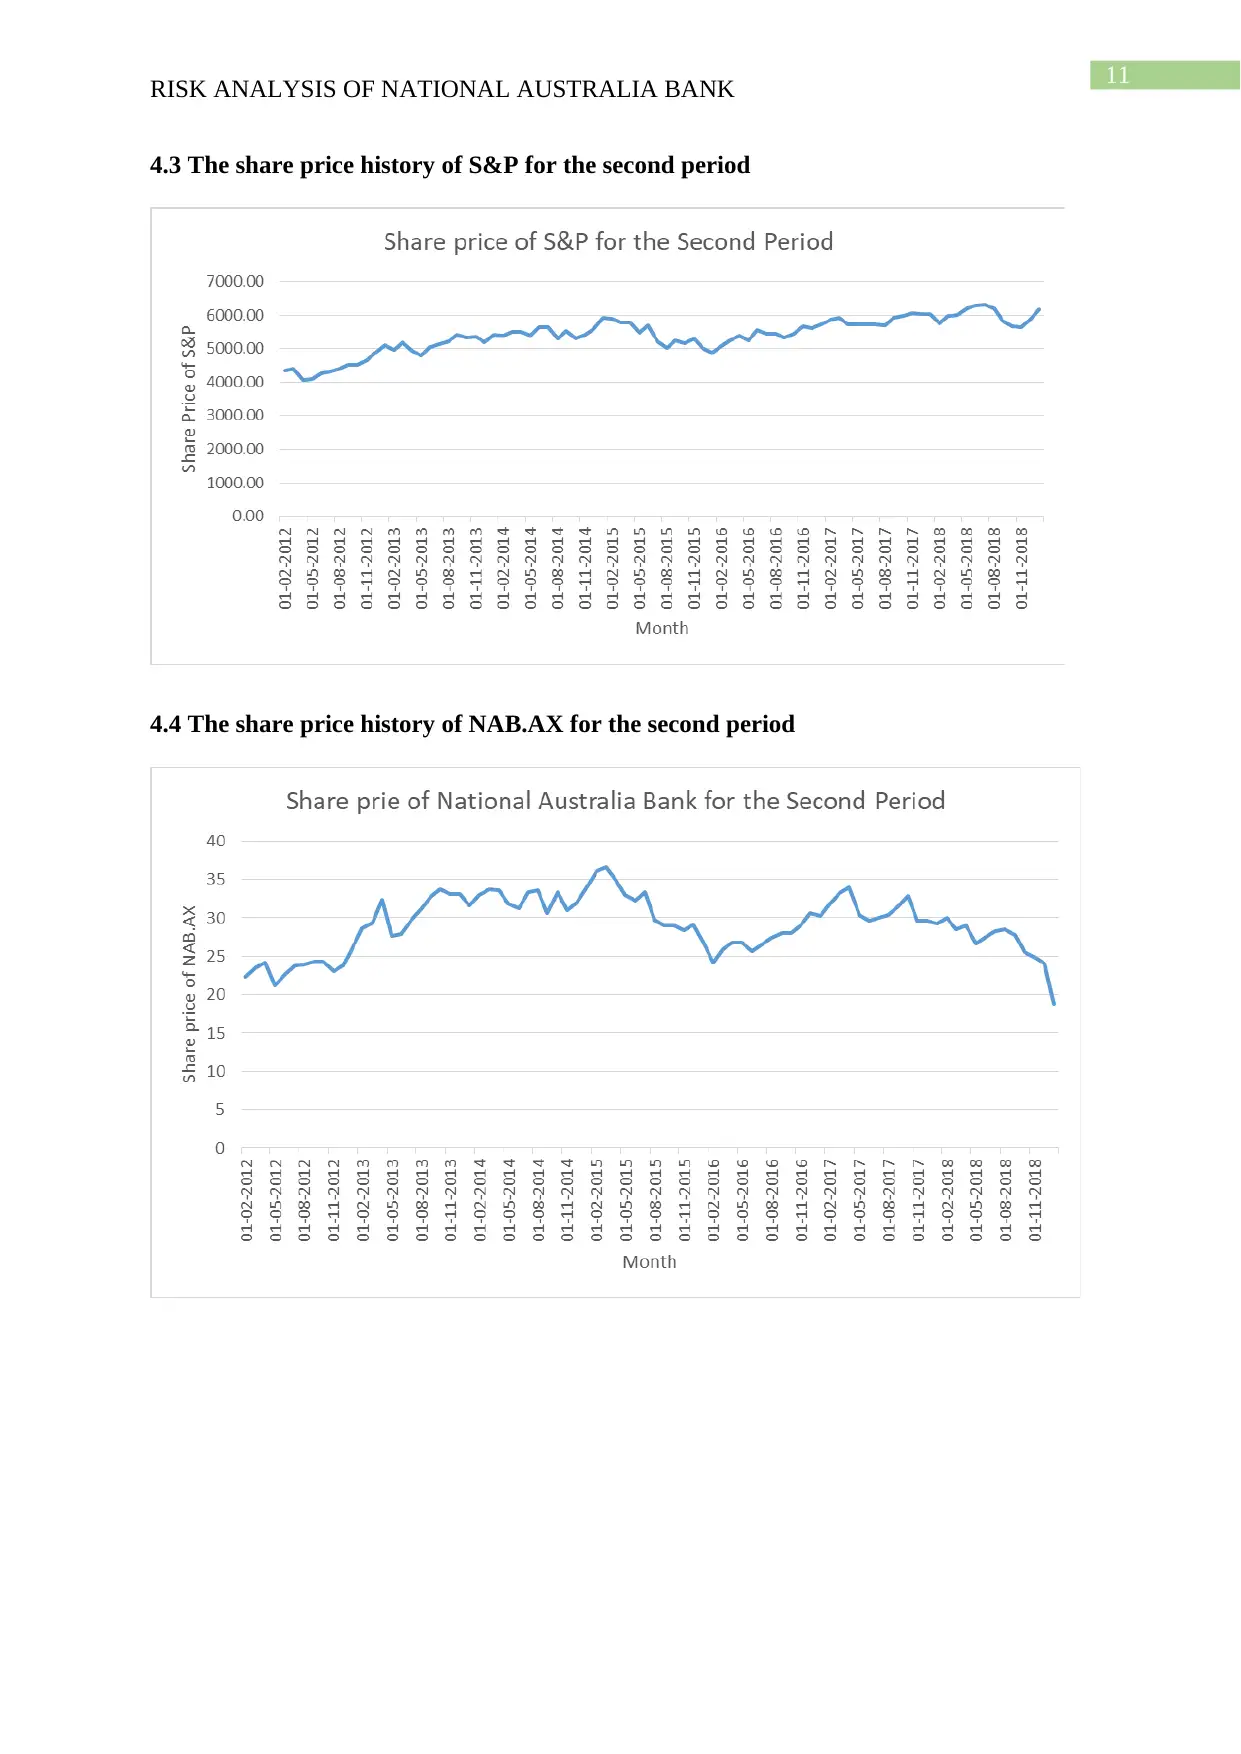
4.3 The share price history of S&P for the second period
4.4 The share price history of NAB.AX for the second period
RISK ANALYSIS OF NATIONAL AUSTRALIA BANK
4.3 The share price history of S&P for the second period
4.4 The share price history of NAB.AX for the second period
⊘ This is a preview!⊘
Do you want full access?
Subscribe today to unlock all pages.
Trusted by 1+ million students worldwide
1 out of 22
Your All-in-One AI-Powered Toolkit for Academic Success.
+13062052269
info@desklib.com
Available 24*7 on WhatsApp / Email
![[object Object]](/_next/static/media/star-bottom.7253800d.svg)
Unlock your academic potential
Copyright © 2020–2026 A2Z Services. All Rights Reserved. Developed and managed by ZUCOL.