Detailed Business Financial Analysis of National Australian Bank

Verified

Added on  2023/06/12

|29
|4833
|404
Report
AI Summary
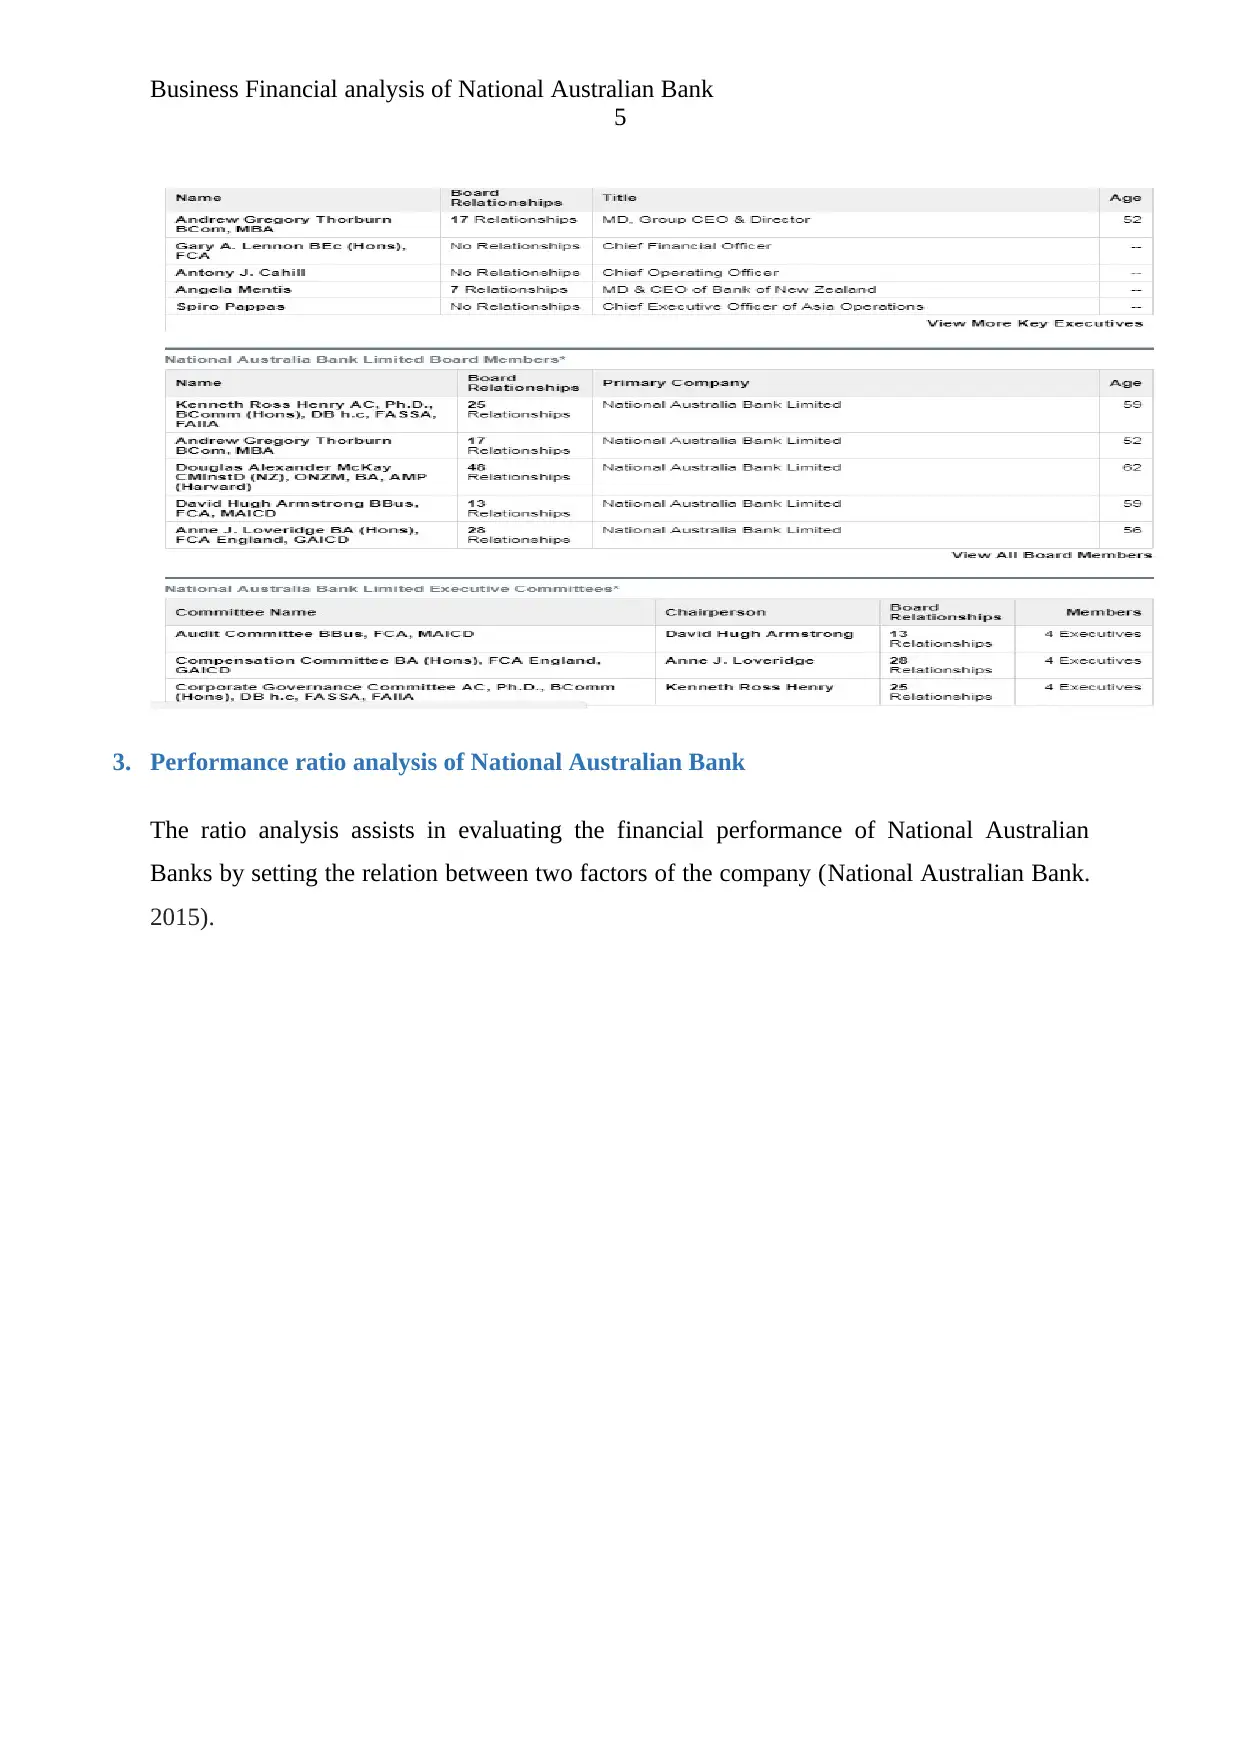
This report provides a comprehensive financial analysis of the National Australian Bank, evaluating its performance through various financial ratios, share price movements, weighted average cost of capital (WACC), and investment methods. It assesses the bank's short-term and long-term solvency, asset utilization, profitability, and market value ratios, comparing data from 2016 and 2017. The analysis includes a detailed examination of the bank's debt-to-equity ratio, gearing ratio, and dividend policies. Furthermore, the report incorporates internet research to calculate the bank's beta and required rate of return using the Capital Asset Pricing Model (CAPM). A letter of recommendation is included, offering suggestions to the directors and managers of the company. The report concludes by summarizing the key findings and providing an overall assessment of the National Australian Bank's financial health and strategies.
Document Page
RUNNING HEAD: Business Financial analysis of National Australian Bank
1
Name of the student
Topic- Business Financial analysis of National Australian Bank
University name
tabler-icon-diamond-filled.svg

Paraphrase This Document

Need a fresh take? Get an instant paraphrase of this document with our AI Paraphraser
Document Page
Table of Contents
Introduction...........................................................................................................................................3
1. Description of National Australian Bank...................................................................................3
2. Governance and Ownership structure............................................................................................4
3. Performance ratio analysis of National Australian Bank...............................................................5
Short term solvency ratio...................................................................................................................6
Long term Solvency ratios.................................................................................................................7
Asset utilization.................................................................................................................................8
Profitability ratios..............................................................................................................................9
Market value ratios..........................................................................................................................12
4. The share price graph and calculation for the movement of the share price.................................14
4.1 Graph reflecting the share price movement of the National Australian Bank............................14
4.2 The comparison between the Share price movement of National Australian Bank and share
price movement of all ordinary stock exchange...............................................................................14
5. Announcements...........................................................................................................................16
6. Research via internet....................................................................................................................16
6.1 Beta calculation...................................................................................................................17
6.2 Computation of required rate of return by using CAPM method...............................................18
6.3 Determining the investment method (Conservative investment)................................................19
7. Computation of the weighted average cost of capital...................................................................19
7.1 Computed Cost of Capital through Capital Assets Pricing model........................................19
7.2 Implications that a higher WACC on investment decision........................................................20
8. Debt ratio consideration of National Australian Bank.................................................................21
8.1 Stable Debt to equity ratio of the company....................................................................................21
8.2 Gearing ratio discussion.............................................................................................................22
9. Divided policies of the company.................................................................................................22
10. Letter of recommendation........................................................................................................23
11. Conclusion...............................................................................................................................25
12. References...............................................................................................................................26
13. Appendix.................................................................................................................................27
Document Page
Business Financial analysis of National Australian Bank
3
Introduction
With the changes in economic conditions and complex business structure, each and
every organization has implemented a proper strategic program to run the business
effectively. This report assist in evaluating whether National Australian Bank has positive
financial performance or not. In this report, financial performance of National Australian
Bank will be analyzed to determine whether bank has been running its busienss effectively or
not. The share price analysis of two years, weighted average cost of capital and investment
method of National Australian Bank has been analysed to identify where company needs to
make improvement in its business. In the end, letter of recommendation have been given to
directors and managers of Company.
1. Description of National Australian Bank
It is an Australian Bank which is one of the four biggest financial institutions in Australia in
context with the market capitalization, revenue and number of customers and earnings. This
company has gained momentum throughout the time and increased its number of clients. The
current CEO of the company is Andrew who takes all the necessary steps to run the business
effectively.
Document Page
2. Governance and Ownership structure
The present CEO of the company is Andrew
The below-given table reflects the key major stakeholders who are owning the highest shares
in Company (Laudon, and Traver, 2013).
tabler-icon-diamond-filled.svg

Paraphrase This Document

Need a fresh take? Get an instant paraphrase of this document with our AI Paraphraser
Document Page
Business Financial analysis of National Australian Bank
5
3. Performance ratio analysis of National Australian Bank
The ratio analysis assists in evaluating the financial performance of National Australian
Banks by setting the relation between two factors of the company (National Australian Bank.
2015).
Document Page
Short term solvency ratio
1. Current ratio
It is evaluated that Current ratio of National Australian Bank is moderate which reflects that
company has managed to operate its business (Vogel, 2014).
Liquidity ratio Years
2017 2016
Current ratio 1.2 .89
Quick ratio .92 .57
This table shows that company has increased its current ratio by .30 points and also
increased its quick ratio by .31 points in 2017 as compared to last year data.
Note- If we do not consider any of its assets current then the current and quick ratio
would be determined as zero.
(National Australian Bank. 2015).
Document Page
Business Financial analysis of National Australian Bank
7
Proving the equation
This equitation shows the left side of the company is equal to the right side of the
company.
Providing equation 2014 2015 2016 2017
Net profit After tax/OE 0.55154
0.47597938
5 0.42241 0.34557
EBIT/TA*NPAT/EBIT*TA/OE 0.55154
0.47597938
5 0.42241 0.34557
(The above-given table reflects the equation for the net profit and overall earning)
Both sides of the data are equivalent.
Long term Solvency ratios
Debt to equity
The financial leverage of National Australian Bank is high which shows that bank has
been enjoying the lower cost of capital.
The National Australian Bank has maintained 92% debt to equity ratio which reflects
that company has high financial leverage. (Cikaliuk, et al.).
National Australian Bank needs to lower down its finanical leverage by reducing the debt
portion.
Computation of debt to equity of Company
Debt Equity
tabler-icon-diamond-filled.svg

Paraphrase This Document

Need a fresh take? Get an instant paraphrase of this document with our AI Paraphraser
Document Page
2016 2017
A. Total Liabilities 7,26,307 737008
B. Total assets 7,77,622 7,88,325.00
(A/B) 93% 93%
Interpretation
It is analysed that the debt to equity of company has been showing the positive results
which reflects that company could undertake more projects with it lower cost of capital.
However, the debt to equity has gone down to 93% which is 2% lower as compared to last
four year data.
Gearing ratio discussion
The gearing ratio is the ratio which reflects the relation between the interest payment
and earnings before interest and tax. It is observed that company has increased its gearing
ratio to 52% in 2017 which is 1% lower as compared to 2016.
Gearing Ratio
2016 2017
Gearin
g Ratio 53% 52%
The Gearing ratio of National Australian Bank is not effective company needs to
lower down its debt portion.
Asset utilization
1. Inventory turnover ratio
Document Page
Business Financial analysis of National Australian Bank
9
This ratio shows company’s efficiency to deploy the funds in the books of account of
Company.
Efficiency ratio Years
2017 2016
Inventory turnover ratio 0 0
Asset turnover ratio .82 .86
Receivable turnover ratio 16.5 17.1
Days' sales in inventory 2.1 2.2
Days' sales in receivables 24 23
The National Australian Bank does not have inventory in its business due to its
financial activities. Therefore, inventory turnover of company is zero
2. Asset turnover ratio
It shows that revenue generated capacity of company from its assets. The assets turnover of
National Australian Bank has increased to .82 times which is .02 times higher as compared to
last year data.
3. Debtor turnover ratio
The debtor turnover of National Australian Bank is very high which shows that it has been
efficiently deploying its capital in the books of accounts..
Profitability ratios
Computation of the Return on Equity and Return on assets
Document Page
National Australian Bank
Particulars (Amount in Million 2016 2017
AUD$
EBIT 27,629 27,403
Interest 14,699 14,221
Net profit 21,666 17,730
Total Assets 7,77,622 7,88,325
Total Liabilities 7,26,307 7,37,008
Shareholders' Equity 51,292 51,306
tabler-icon-diamond-filled.svg

Paraphrase This Document

Need a fresh take? Get an instant paraphrase of this document with our AI Paraphraser
Document Page
Business Financial analysis of National Australian Bank
11
Computation of Return on Assets of Company
1. The rate of Return
on Assets
2016 2017
A.
Net
income
(AUD $
in
Million)
21,666 17,730
B.
Total
assets
(AUD $
in
Million)
7,77,6
22
7,88,3
25
(A
/B) 3% 2%
Interpretation of the data
National Bank Australia has kept its return on equity to 2% in 2017 which is 1 %
lower as compared to last year data. It reflects that company has decreased its overall net
income since last five years which is not a positive indicator for the business (Dahir, Mahat,
and Ali, 2018).
Document Page
Return on equity of the company
2. The rate of Return on
Equity
2016 2017
A. Net
income
available
to equity
shareholde
rs.
21,66
6 17,730
B.
Shareholde
r’s Equity
51,29
2
51,306.
00
(A/B) 42.24
% 34.56%
Interpretation
The return on equity of company has been reduced to 34.56% which is 10 % lower as
compared to last year data. The total revenue of the company has reduced the drastic rate
which shows negative indicator. It has been observed that if a company wants to increase its
overall return on equity then it must increase its overall revenue.
Market value ratios
1. Earnings per share
It is the portion of the profit allocated to each outstanding shares of company.
Market Value ratios Years
2017 2016
Earnings per share - 2.80 - 7.40
P/E ratio - -
Dividend pay-out
ratio - -
chevron_up_icon
1 out of 29
circle_padding
hide_on_mobile
zoom_out_icon
[object Object]