Financial Performance and Competitor Analysis of NCB Bank Report
VerifiedAdded on 2021/04/21
|14
|2572
|89
Report
AI Summary
This report provides a comprehensive overview of the National Commercial Bank (NCB), also known as AlAhli Bank, the second-largest bank in the Arab world and a pioneer in Islamic banking. It details the bank's products and services, categorized into Retail, Corporate, Treasury, Capital Market, and International segments, highlighting its commitment to Shariah-compliant banking. The report conducts a competitor analysis, comparing NCB's market share, profitability, and growth with other major banks in Saudi Arabia, including Al Rajhi Bank and Samba Financial Group, using financial ratios and growth rates. Furthermore, it examines NCB's significant contributions to Saudi Arabia's development, including job creation, support for SMEs, and investment in digital infrastructure. The report concludes by summarizing NCB's financial performance trends and its impact on the Saudi Arabian economy, based on the data presented in the appendix.
Financial iNSTITUTIONS National
Commercial Bank
Commercial Bank
Paraphrase This Document
Need a fresh take? Get an instant paraphrase of this document with our AI Paraphraser
FINANCIAL INSTITUTIONS 1
Table of Contents
Introduction................................................................................................................................2
Overview of National Commercial Bank...............................................................................2
Products and Services offered by National Commercial Bank..............................................2
Competitor Analysis...............................................................................................................4
Contribution of NCB in Saudi Arabia Development.............................................................5
Conclusion..................................................................................................................................6
References..................................................................................................................................7
Appendix....................................................................................................................................9
FINANCIAL INSTITUTIONS 2
Introduction
Financial institutes with a license to accept deposits and offer loans are known as Bank
(Wallach & Tattersall, 2011). It also offers financial services, like safe deposit boxes,
currency exchange, and wealth management. Investments banks and commercial/retail banks
are the two categories of banks (Betz, 2013). The purpose of this report is to provide an
overview of National Commercial bank of Saudi Arabia, its products and services and their
contribution towards the profitability of the bank. Along with this report will perform the
competitor analysis and its comparison with other banks. Further, it will provide a brief
discussion of its contribution towards the development of Saudi Arabia.
Overview of National Commercial Bank
The National Commercial Bank (NCB) is also called as AlAhli Bank. In terms of asset, it is
the second largest bank in the Arab world and the initiator of the Islamic banking. The NCB
is the Saudi’s first bank receives its license and the largest in the Kingdom and a principal
financial institution in the area established by Abdallah Mousa Kaki (National Commercial
Bank, 2018). The bank started its business in the name of “The National Commercial bank”
succeeding the Royal Decree on 20 Rabi Thani 1373H. With the help of (PIF) i.e. Ministry of
Finance’s Public Investment Fund in 1999 government acquired a maximum number of bank
holding. 90.7% of NCB Capital is owned by the National Commercial Bank, its investment
supports the Leading bank of investment in the Kingdom and possesses 67.03% of Türkiye
Finans Katılım Bankası (TFKB), Turkey’s top participation bank (Alshetwi, 2013).
⊘ This is a preview!⊘
Do you want full access?
Subscribe today to unlock all pages.
Trusted by 1+ million students worldwide
FINANCIAL INSTITUTIONS 3
Products and Services offered by National Commercial Bank
The National Commercial Bank (NCB) offers several banking services and products. It
provides banking products based on non-special commission in obedience to Shariah rules,
which are permitted and managed by a self-governing Shariah Board (Bloomberg, 2018).The
Bank activates through Capital Market, Retail, Treasury, International and Corporate
segments.
The Retail segment offers services of a bank, comprising current accounts and lending, as
well as products in obedience to Shariah rules to entities and customers of private banking.
The corporate segment provides several financing and conventional credit-related products to
companies, large, medium and small sized establishments.
Treasury segment offers a variety of corresponding and treasury banking services and
products including foreign exchange and money market; carries out trading and investment
activities; and handles credit risks, market, and liquidity associated with the investments.
The capital Market segment provides asset management, shares and brokerage, investment
banking and wealth management services.
International segment offers services of the bank outside the boundary of Saudi Arabia. It
also promotes and distributes products of Islamic insurance, offers recruitment services and
runs a private equity fund.
The existence of Bank- The National Commercial Bank exists because of its best services
offered to the customers. It maintains good relations with the customers and business
organizations operating in the country.
Liquidity of Bank- Liquidity of bank is the capability of a bank in retaining sufficient funds
in order to meet its maturing requirements. How effortlessly bank can convert its asset into
Paraphrase This Document
Need a fresh take? Get an instant paraphrase of this document with our AI Paraphraser
FINANCIAL INSTITUTIONS 4
cash describes the asset’s liquidity (Elliott, 2014). National Commercial Bank is profitable
because depositors lend money to the bank at a low rate of interest so that NCB can access
the funds and manage at frequency intervals. It is the reason bank is able to protect its
liquidity position and wealth. The deposit facility that the bank provides enables it to
maintain a sufficient cash balance to meet the unexpected and other short-term obligations so
that it can maintain sound liquidity position.
Profitability of Bank- Profitability reflects the capability of a firm in earning income on its
assets. The profitability of NCB is defined by the factors which are management decisions
and various policy measures established by the bank i.e. level of expenditure, amount of
capital and level of liquidity. The products that the bank generally provides to its customers
such as insurance and loan functions allow it to earn considerable interest and premium
amounts so as to enhance its overall profitability.
Competitor Analysis
Market Share
In the banking sector of Saudi Arabia, there are 12 listed banks and non-listed banks. As per
the size of balance sheet, the biggest bank of the Kingdom is National Commercial Bank with
assets of more than SAR 441.4bn, which is 19.9% of the whole market, followed by Al Rajhi
Bank with the SAR 339.7 bn asset base which is 15.3% part of the market. More than 9.5%
of the total banking sector is with Riyadh Bank and Samba each (Aljazira Capital, 2017).
Considering the analysis related to market share of the banks of Saudi Arabia it can be said
that National Commercial Bank have maximum market share as compared to its competitors.
Profitability
FINANCIAL INSTITUTIONS 5
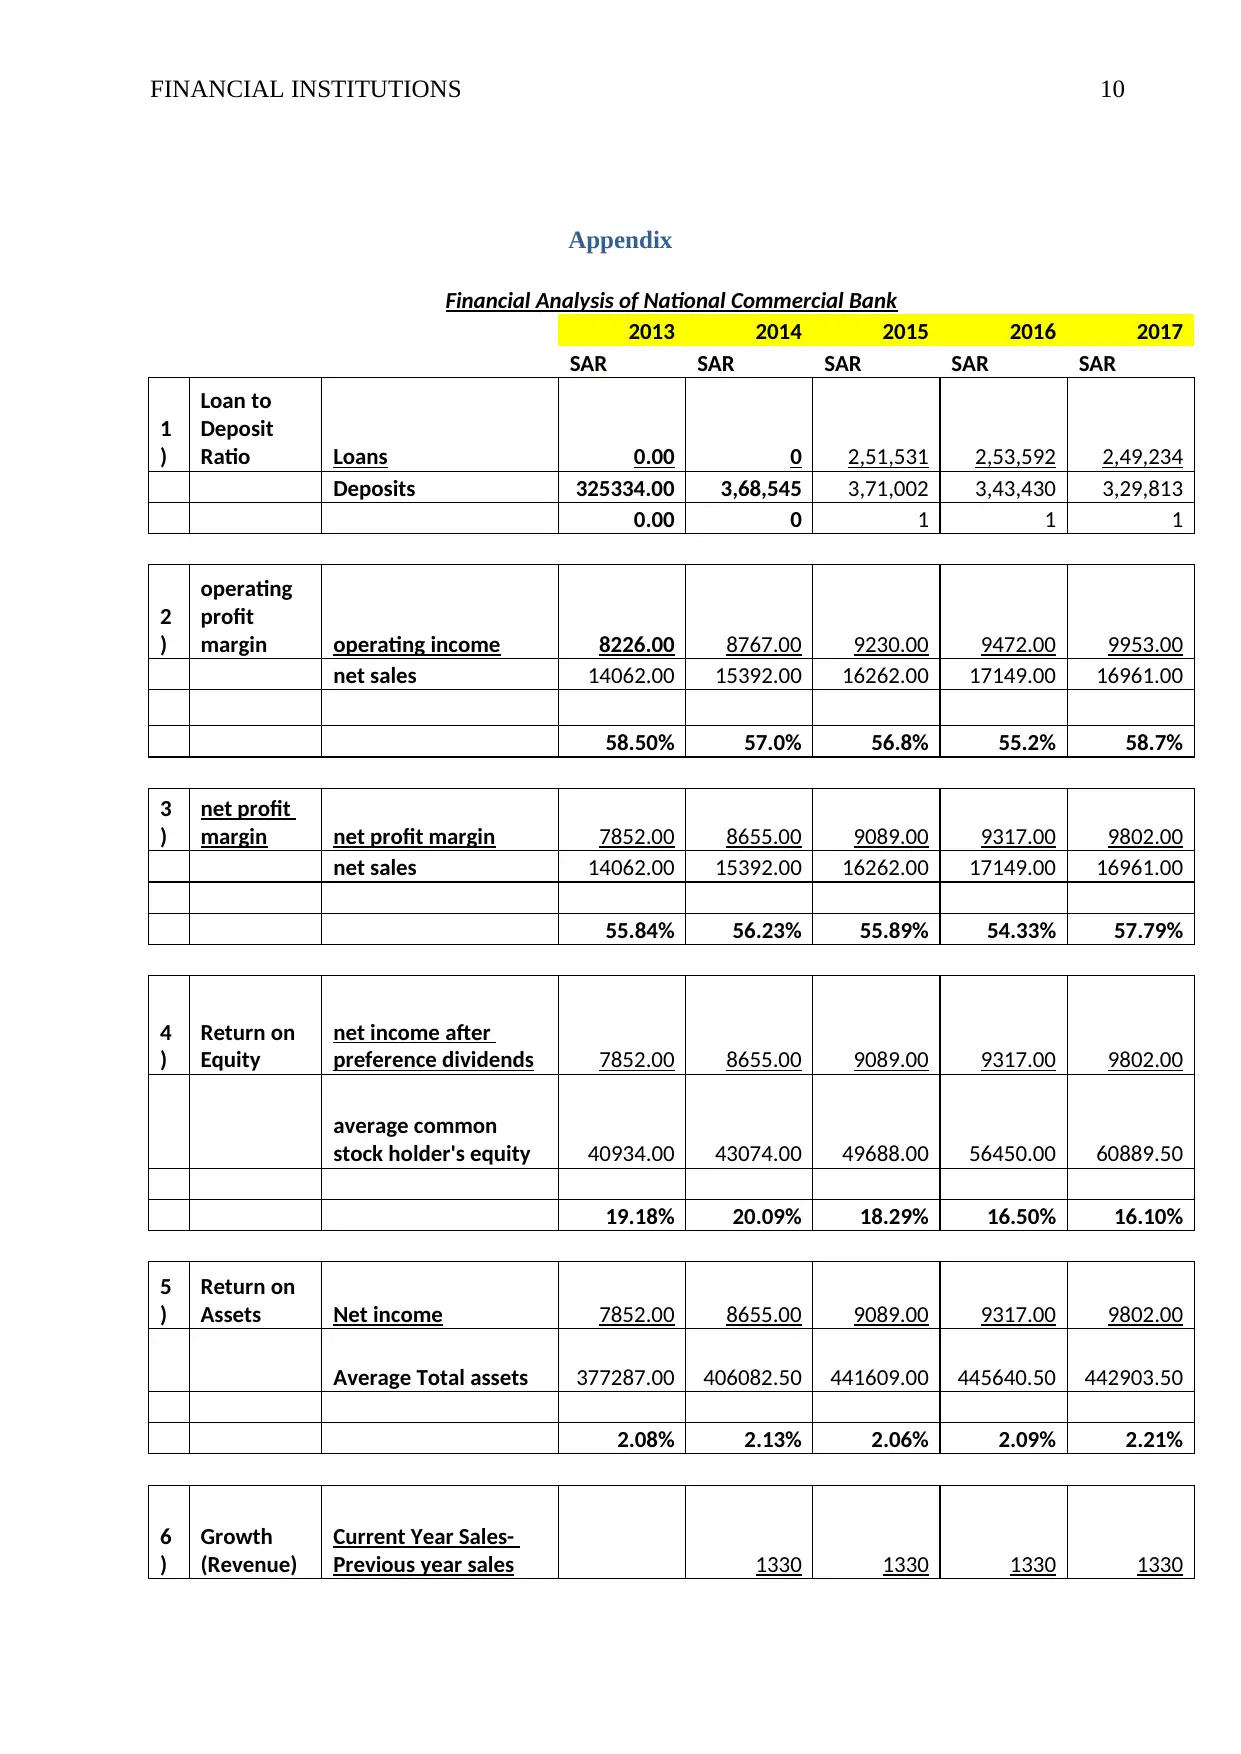
The profitability position of the bank can be determined using various ratios such as return on
equity, return on assets, net profit margin and operating income margin. In this report, a
comparative study of profitability and liquidity position of the national commercial bank and
its competitors is undertaken by the means of ratio analysis. From such analysis, it is
observed that the percentages operating margin and net margin ratio of NCB have been
declining since last 4 years but in 2017, it has increased considerably which indicates that the
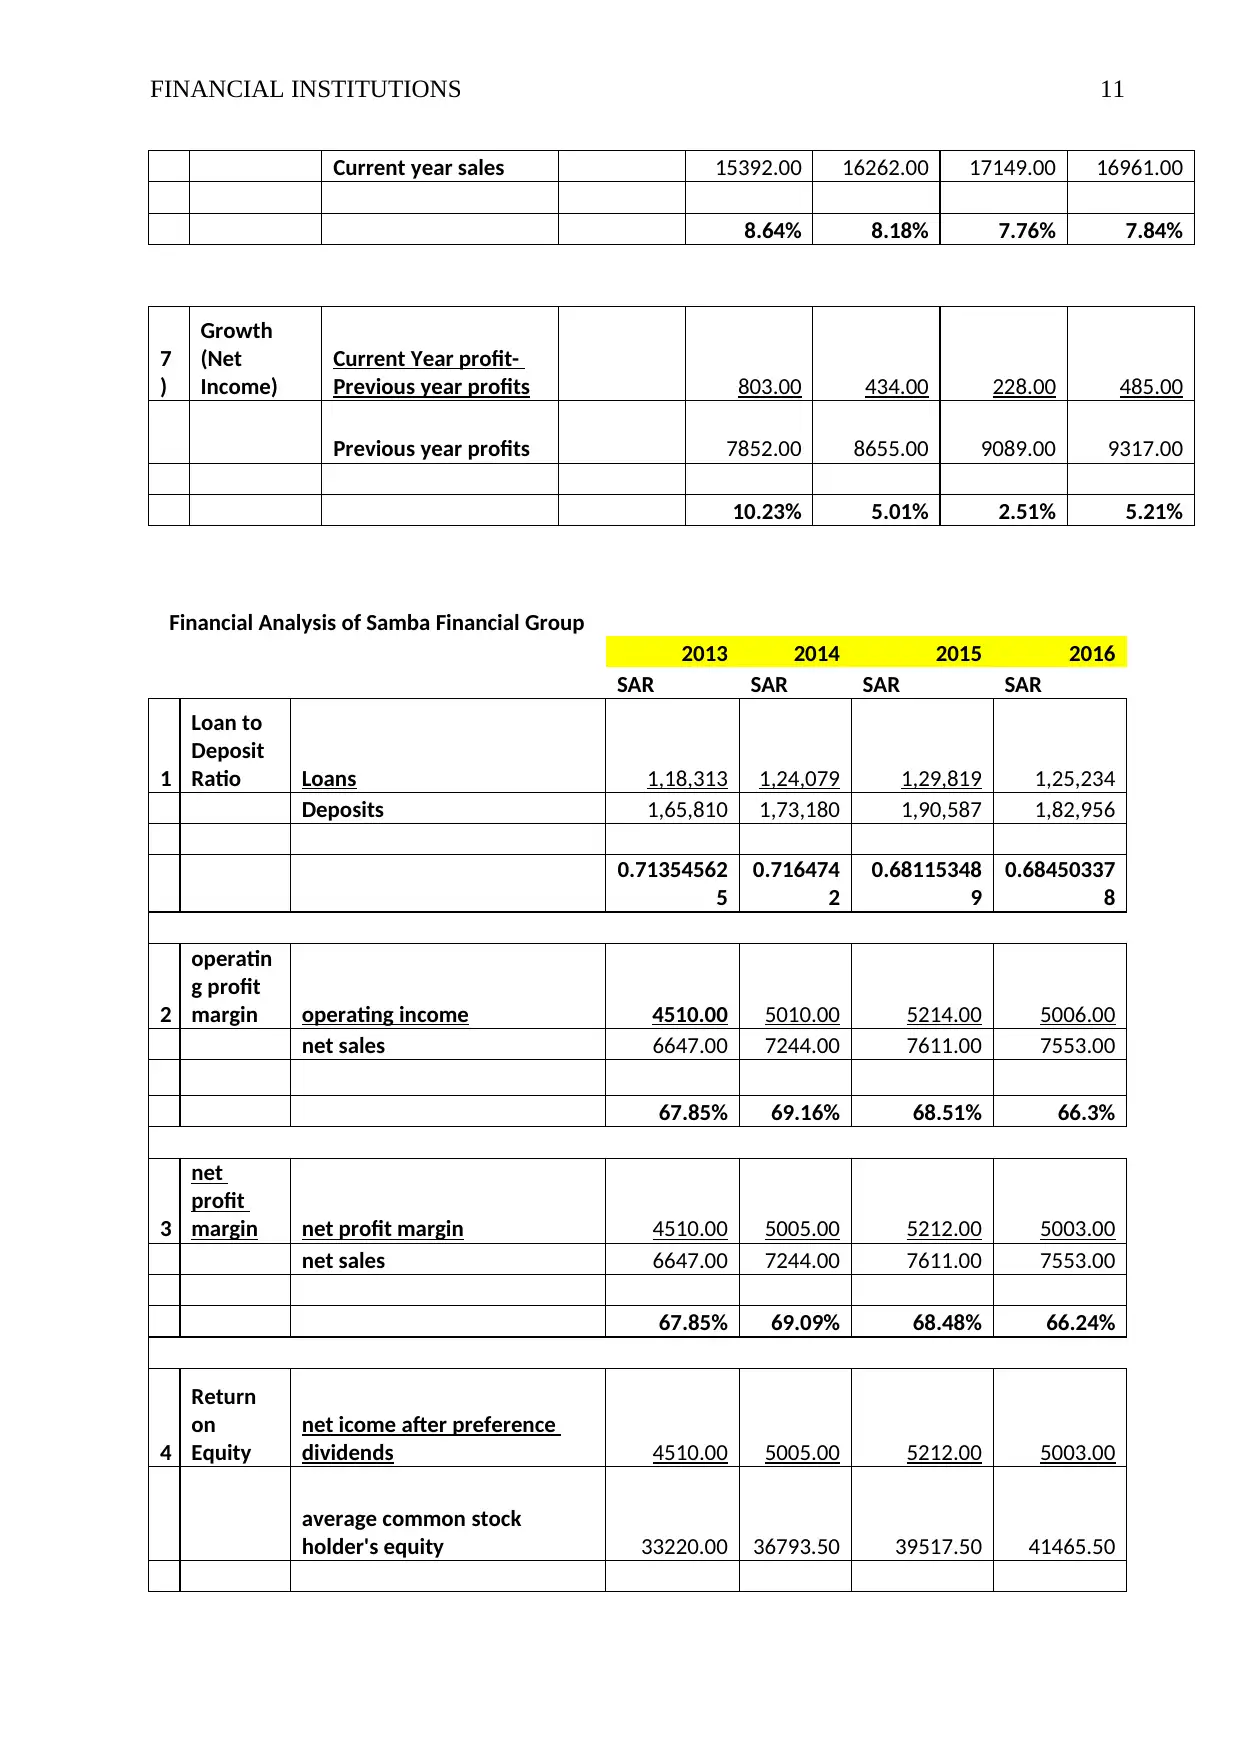
bank has made efforts to improve its profitability position. The profitability position of its
major competitors i.e. Samba financial group is allow following declining trend whereas the
other competitor i.e. Al Rajhi is successful to improve its profitability in 2016 only.
At the same, it is also observed that the percentage of return on equity is fluctuating since the
concerned last five years. However, there is no significant fluctuation in the ROE of its
above-discussed competitor banks. (Refer Appendix)
Growth
The growth rate in terms of sales revenue and net income has been analyzed by taking
previous year's figures as the base figures. The growth rate of all the banks in fluctuating and
there is no particular trend followed by the concerned bank and its competitors. However, in
terms of revenue from sales NCB is not very successful to enhance its growth rate which is
achieved by its prime competitor Al Rajhi. But, it can be said that NCB is quite successful in
improving its growth rate than the Samba financial groups.
Also in terms of net income, NCB has experienced higher positive growth rate since 2016
whereas prior to 2016, the growth rate was declining for NCB. Samba Groups, on the other
hand, is not very successful to attain a constant growth rate and also in 2016 it has faced a
significant decline in the net income. However, Al Rajhi Bank has tremendously improved its
profitability position by achieving a successful growth rate. (Refer Appendix)
The profitability position of the bank can be determined using various ratios such as return on
equity, return on assets, net profit margin and operating income margin. In this report, a
comparative study of profitability and liquidity position of the national commercial bank and
its competitors is undertaken by the means of ratio analysis. From such analysis, it is
observed that the percentages operating margin and net margin ratio of NCB have been
declining since last 4 years but in 2017, it has increased considerably which indicates that the
bank has made efforts to improve its profitability position. The profitability position of its
major competitors i.e. Samba financial group is allow following declining trend whereas the
other competitor i.e. Al Rajhi is successful to improve its profitability in 2016 only.
At the same, it is also observed that the percentage of return on equity is fluctuating since the
concerned last five years. However, there is no significant fluctuation in the ROE of its
above-discussed competitor banks. (Refer Appendix)
Growth
The growth rate in terms of sales revenue and net income has been analyzed by taking
previous year's figures as the base figures. The growth rate of all the banks in fluctuating and
there is no particular trend followed by the concerned bank and its competitors. However, in
terms of revenue from sales NCB is not very successful to enhance its growth rate which is
achieved by its prime competitor Al Rajhi. But, it can be said that NCB is quite successful in
improving its growth rate than the Samba financial groups.
Also in terms of net income, NCB has experienced higher positive growth rate since 2016
whereas prior to 2016, the growth rate was declining for NCB. Samba Groups, on the other
hand, is not very successful to attain a constant growth rate and also in 2016 it has faced a
significant decline in the net income. However, Al Rajhi Bank has tremendously improved its
profitability position by achieving a successful growth rate. (Refer Appendix)
⊘ This is a preview!⊘
Do you want full access?
Subscribe today to unlock all pages.
Trusted by 1+ million students worldwide
FINANCIAL INSTITUTIONS 6
Contribution of NCB in Saudi Arabia Development
National Commercial Bank (NCB) regularly offers job opportunities for youth by
investing in the career development plan of Government. A set of training programs
prepare young Saudi women and men with the knowledge and skills necessary for
becoming the leaders of future. The Bank also promotes and hires people to do the job
in their own area or region, by supporting the economic development (Alahli, 2016).
The Bank continued its success by fulfilling its corporate responsibility. It has
provided an investment of SAR 11.4 million in the ‘Ahalina’ programs which are
formed to empower children, youth, and women. The Bank also offers funds by
microfinance of SAR 6.85 million to the woman receivers and contributed SAR 11.4
million in numerous initiatives that have a direct influence on the society (Alahli,
2016).
NCB continuously developing the IT infrastructure, assembling high growth in the
direction of completing the project of NextGen Technology. In 2017, transactions
conducted by the digital channels will reach 96%, contributing to the leadership of
NCB in the region’s Digital Banking and accomplishment of its strategic goal of
becoming the Best Digital Bank (Alahli, 2016).
National Commercial Bank has always been the big lender for the SME sector and in
2012 bank was responsible for 31% of all Kafala loans. Since 2006, 1381 loans were
extended by the bank with the value of SR 921 million (Alahli, 2012).
Conclusion
In the conclusion, it can be said that National Commercial bank is working hard to improve
its profitability which is reflected by its five-year trend. On the other hand, Samba has
reflected some downturns in its performance whereas Al Rajhi has successfully improved its
Paraphrase This Document
Need a fresh take? Get an instant paraphrase of this document with our AI Paraphraser
FINANCIAL INSTITUTIONS 7
profitability in 2016. The above report has provided detail information of National
Commercial Bank and its services. The bank has also contributed a lot to the development of
Saudi Arabia.
profitability in 2016. The above report has provided detail information of National
Commercial Bank and its services. The bank has also contributed a lot to the development of
Saudi Arabia.
FINANCIAL INSTITUTIONS 8
References
Alahli. (2016). The National Commercial Bank Annual Report 2016. Retrieved from:
https://www.alahli.com/en-us/about-us/ncb_reports/Documents/Revised-Annual-
Report-01.06.17-B.PDF
Alahli.(2012). Sustainability Report 2012. Retrieved from:
https://www.alahli.com/en-us/about-us/Documents/NCB%20Sustainability%20Report
%20dor%20Business%20Excellence%202012%20(Full-Year).pdf
Aljazira Capital. (2017). Saudi Banking Sector. Retrieved from:
http://www.aljaziracapital.com.sa/report_file/ess/SEC-485.pdf
Alshetwi, A.S. (2013). Study on the Marketing Strategies of NCB in Saudi Arabia. Global
Journal of Management and Business Studies, 3(2), 75-80.
Bloomberg. (2018). Company Overview of The National Commercial Bank. Retrieved from:
https://www.bloomberg.com/research/stocks/private/snapshot.asp?
privcapId=9681732
Betz, F. (2013).Why Bank Panics Matter: Cross-Disciplinary Economic Theory. Germany:
Springer Science & Business Media.
Elliott, D.J. (2014). Bank Liquidity Requirements: An Introduction and Overview. Retrieved
from:
https://www.brookings.edu/wp-content/uploads/2016/06/23_bank_liquidity_requirem
ents_intro_overview_elliott.pdf
⊘ This is a preview!⊘
Do you want full access?
Subscribe today to unlock all pages.
Trusted by 1+ million students worldwide
FINANCIAL INSTITUTIONS 9
Martynova, N. (2015). Bank Profitability and Risk-Taking. U.S: International Monetary
Fund.
Morning Star. (2018). Al Rajhi Bank. Retrieved from:
http://financials.morningstar.com/balance-sheet/bs.html?
t=1120®ion=sau&culture=en-US
Morning Star. (2018). The National Commercial Bank. Retrieved from:
http://financials.morningstar.com/balance-sheet/bs.html?
t=1180®ion=sau&culture=en-US
National Commercial Bank. (2018).The First Saudi Bank. Retrieved from:
https://www.alahli.com/en-us/about-us/Pages/default.aspx
Wallach, J.M., & Tattersall, C. (2011).Money and Banking. U.S: The Rosen Publishing
Group.
Paraphrase This Document
Need a fresh take? Get an instant paraphrase of this document with our AI Paraphraser
FINANCIAL INSTITUTIONS 10
Appendix
Financial Analysis of National Commercial Bank
2013 2014 2015 2016 2017
SAR SAR SAR SAR SAR
1
)
Loan to
Deposit
Ratio Loans 0.00 0 2,51,531 2,53,592 2,49,234
Deposits 325334.00 3,68,545 3,71,002 3,43,430 3,29,813
0.00 0 1 1 1
2
)
operating
profit
margin operating income 8226.00 8767.00 9230.00 9472.00 9953.00
net sales 14062.00 15392.00 16262.00 17149.00 16961.00
58.50% 57.0% 56.8% 55.2% 58.7%
3
)
net profit
margin net profit margin 7852.00 8655.00 9089.00 9317.00 9802.00
net sales 14062.00 15392.00 16262.00 17149.00 16961.00
55.84% 56.23% 55.89% 54.33% 57.79%
4
)
Return on
Equity
net income after
preference dividends 7852.00 8655.00 9089.00 9317.00 9802.00
average common
stock holder's equity 40934.00 43074.00 49688.00 56450.00 60889.50
19.18% 20.09% 18.29% 16.50% 16.10%
5
)
Return on
Assets Net income 7852.00 8655.00 9089.00 9317.00 9802.00
Average Total assets 377287.00 406082.50 441609.00 445640.50 442903.50
2.08% 2.13% 2.06% 2.09% 2.21%
6
)
Growth
(Revenue)
Current Year Sales-
Previous year sales 1330 1330 1330 1330
FINANCIAL INSTITUTIONS 11
Current year sales 15392.00 16262.00 17149.00 16961.00
8.64% 8.18% 7.76% 7.84%
7
)
Growth
(Net
Income)
Current Year profit-
Previous year profits 803.00 434.00 228.00 485.00
Previous year profits 7852.00 8655.00 9089.00 9317.00
10.23% 5.01% 2.51% 5.21%
Financial Analysis of Samba Financial Group
2013 2014 2015 2016
SAR SAR SAR SAR
1
Loan to
Deposit
Ratio Loans 1,18,313 1,24,079 1,29,819 1,25,234
Deposits 1,65,810 1,73,180 1,90,587 1,82,956
0.71354562
5
0.716474
2
0.68115348
9
0.68450337
8
2
operatin
g profit
margin operating income 4510.00 5010.00 5214.00 5006.00
net sales 6647.00 7244.00 7611.00 7553.00
67.85% 69.16% 68.51% 66.3%
3
net
profit
margin net profit margin 4510.00 5005.00 5212.00 5003.00
net sales 6647.00 7244.00 7611.00 7553.00
67.85% 69.09% 68.48% 66.24%
4
Return
on
Equity
net icome after preference
dividends 4510.00 5005.00 5212.00 5003.00
average common stock
holder's equity 33220.00 36793.50 39517.50 41465.50
⊘ This is a preview!⊘
Do you want full access?
Subscribe today to unlock all pages.
Trusted by 1+ million students worldwide
1 out of 14
Related Documents


Your All-in-One AI-Powered Toolkit for Academic Success.
+13062052269
info@desklib.com
Available 24*7 on WhatsApp / Email
![[object Object]](/_next/static/media/star-bottom.7253800d.svg)
Unlock your academic potential
Copyright © 2020–2026 A2Z Services. All Rights Reserved. Developed and managed by ZUCOL.