National Income Analysis: GDP, GNP, and Economic Freedom Study

Verified

Added on  2023/01/10

|18
|2803
|32
Homework Assignment
AI Summary
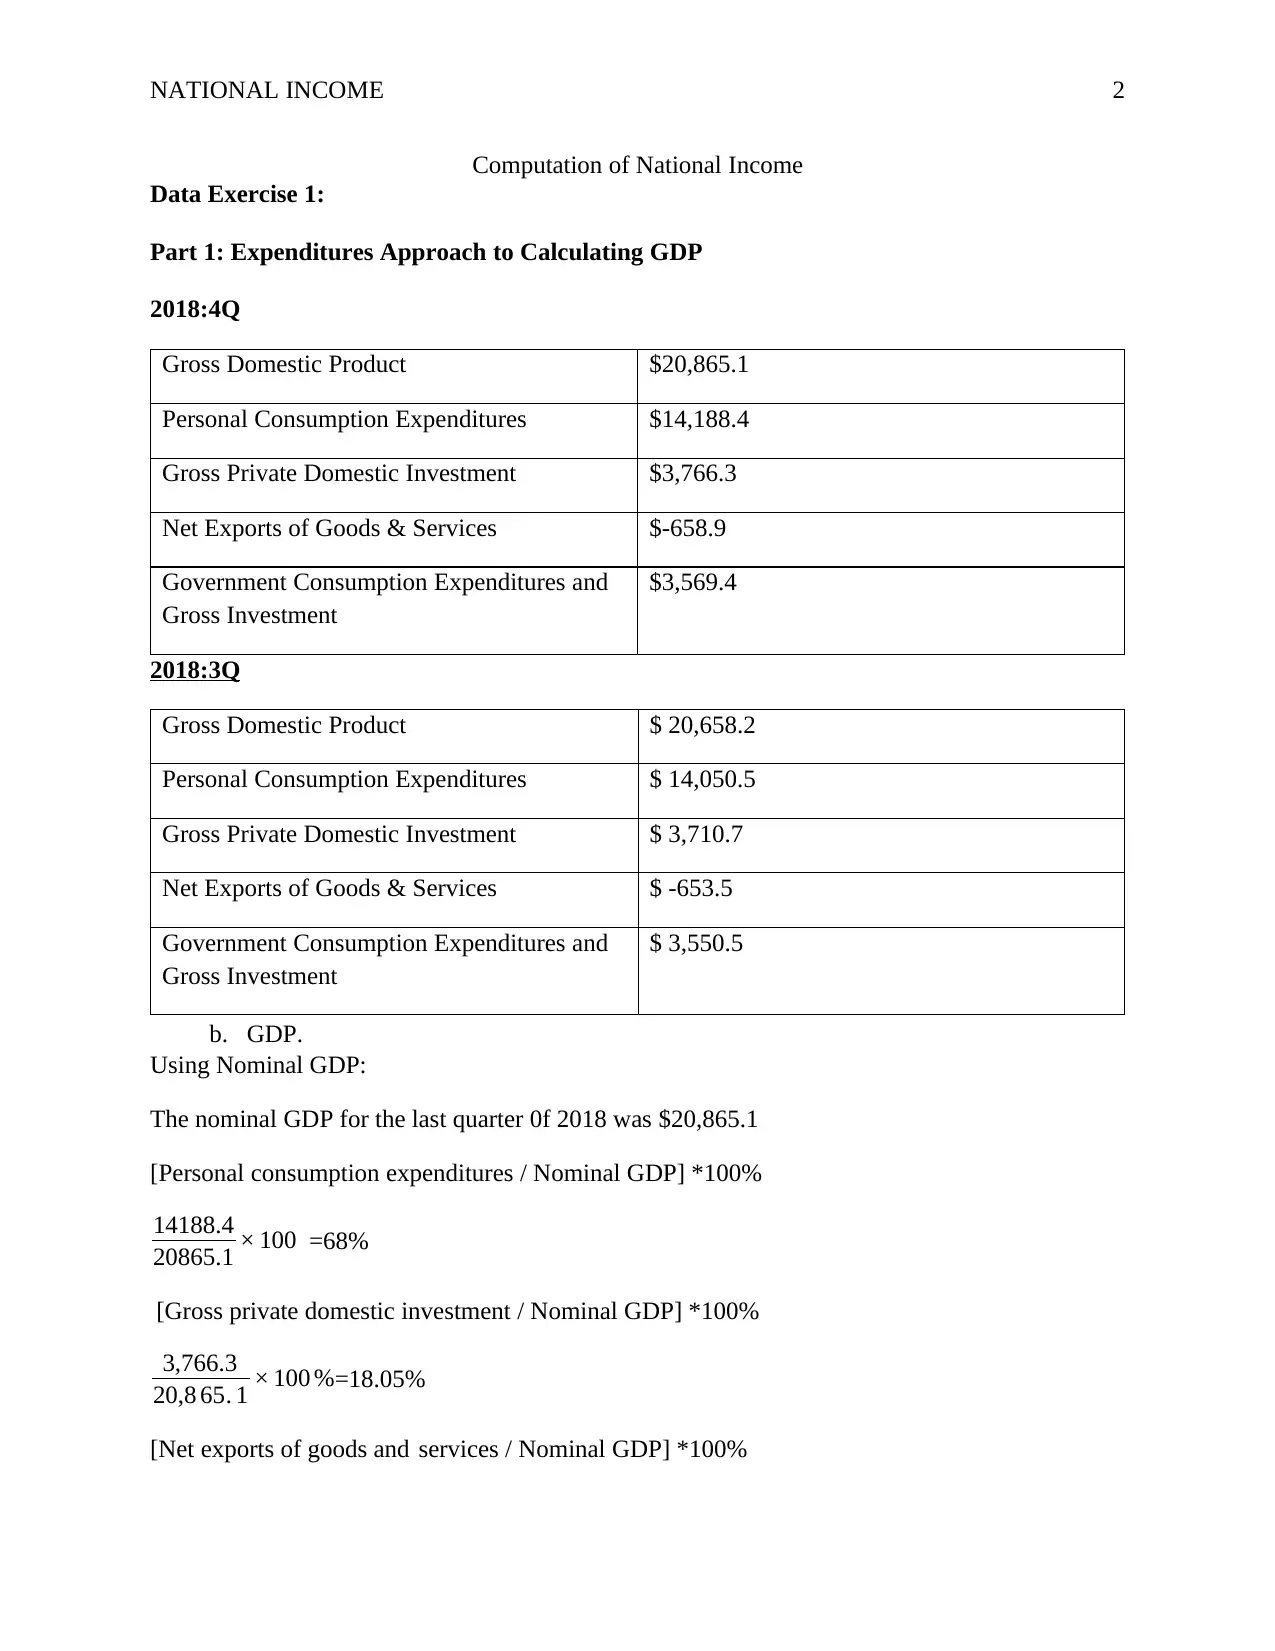
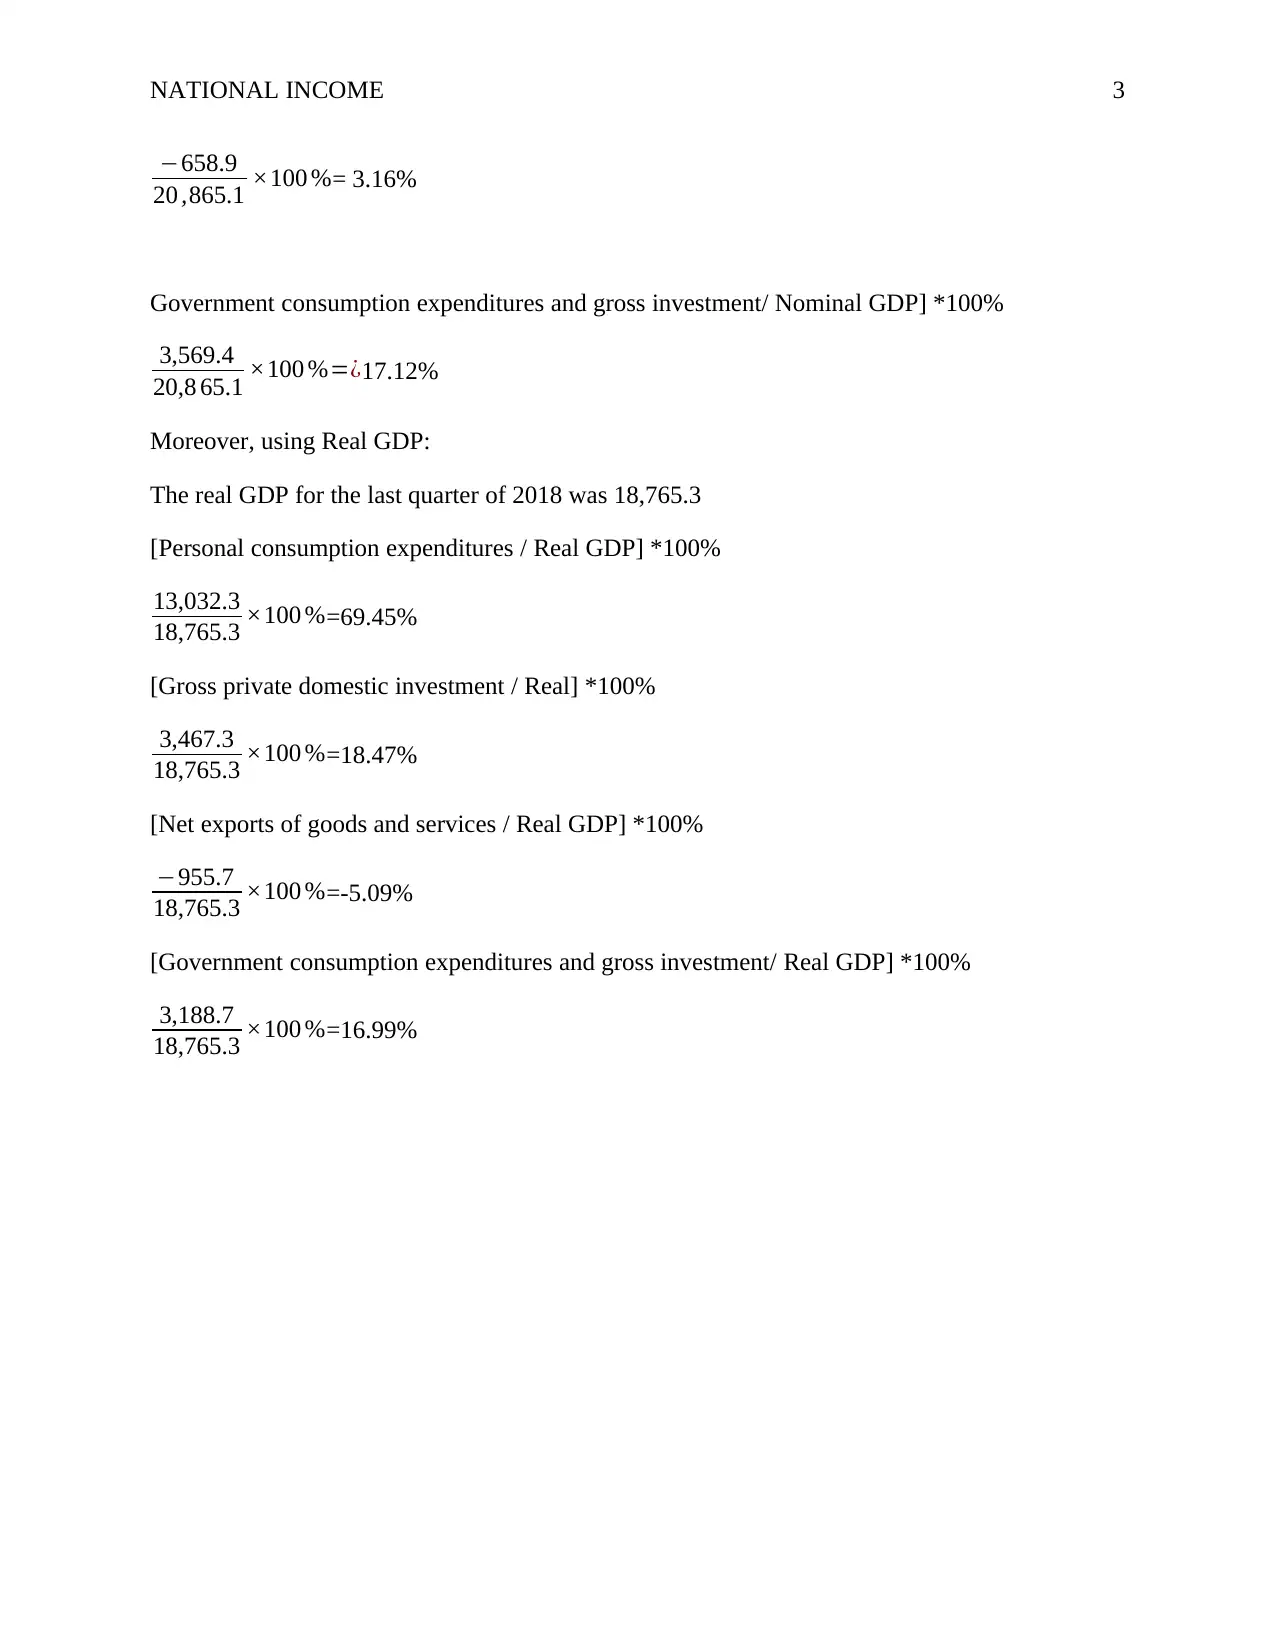
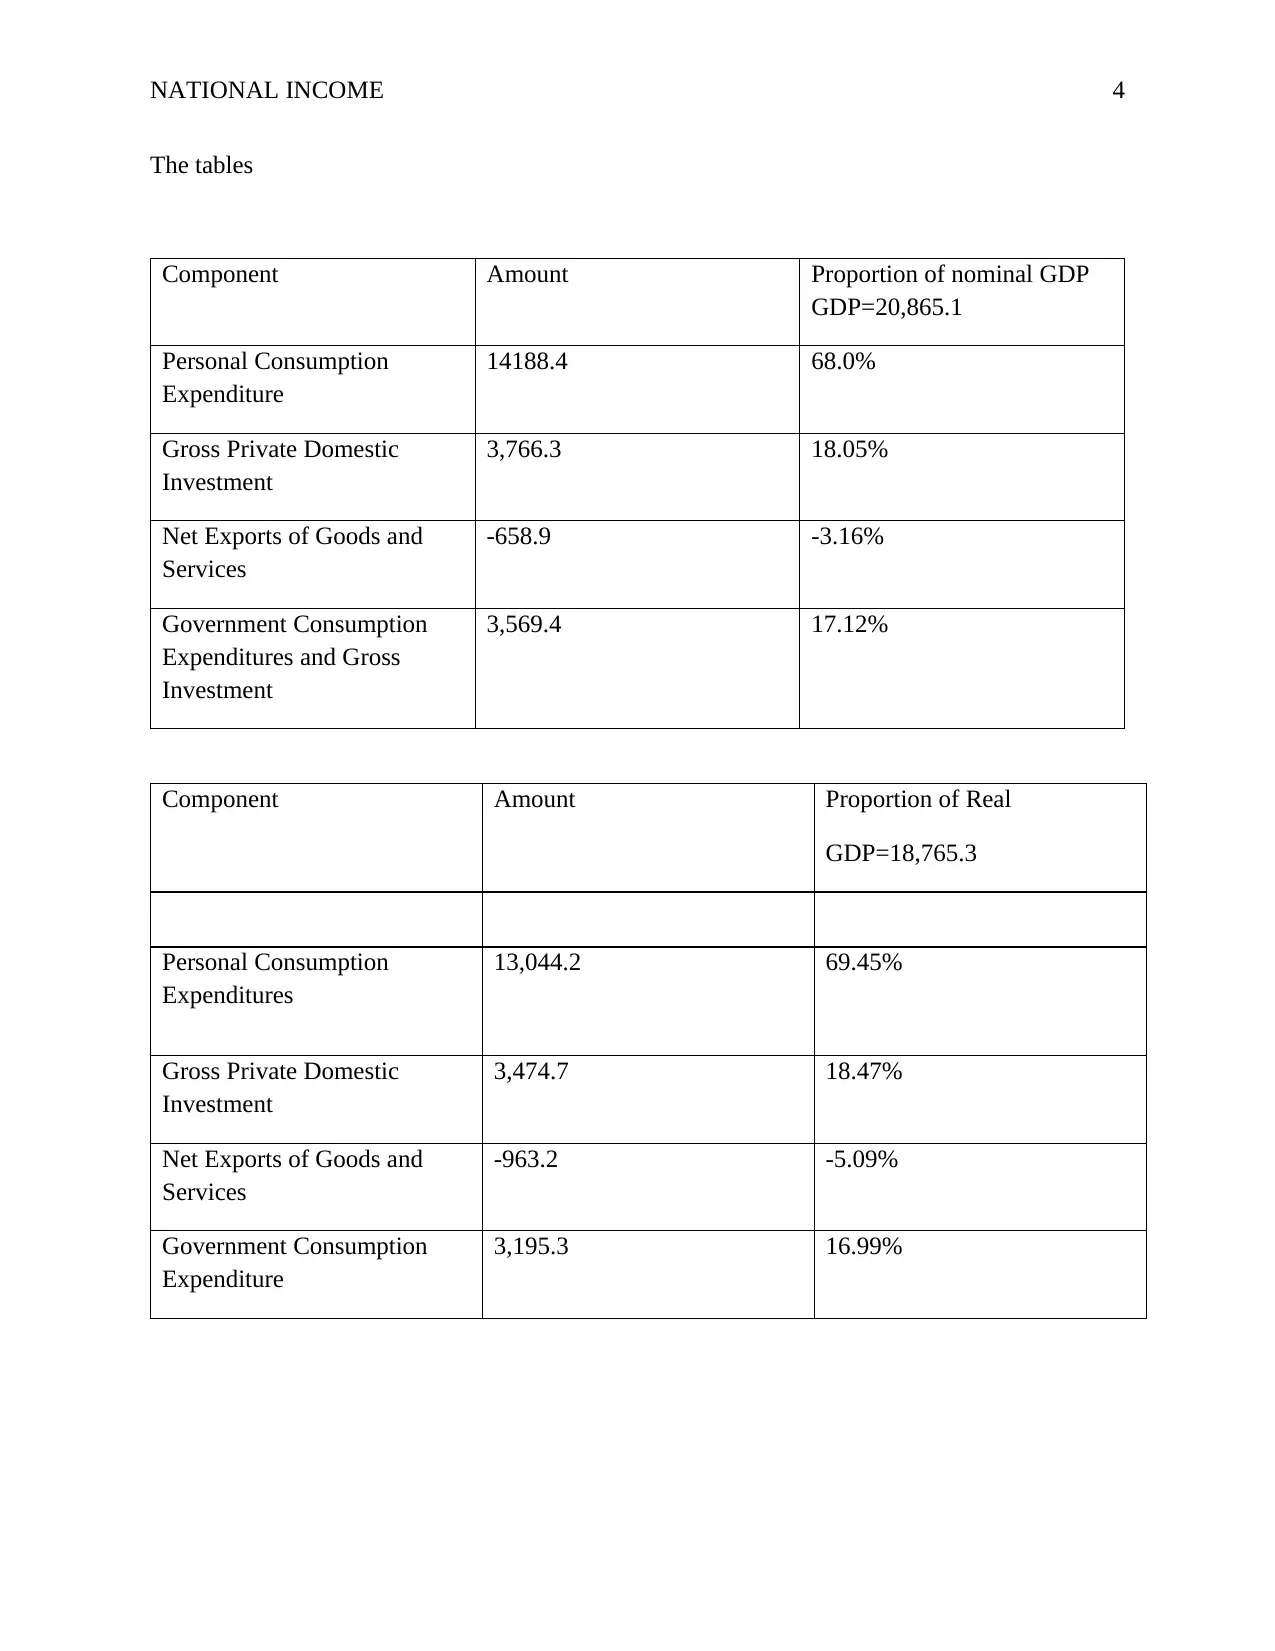
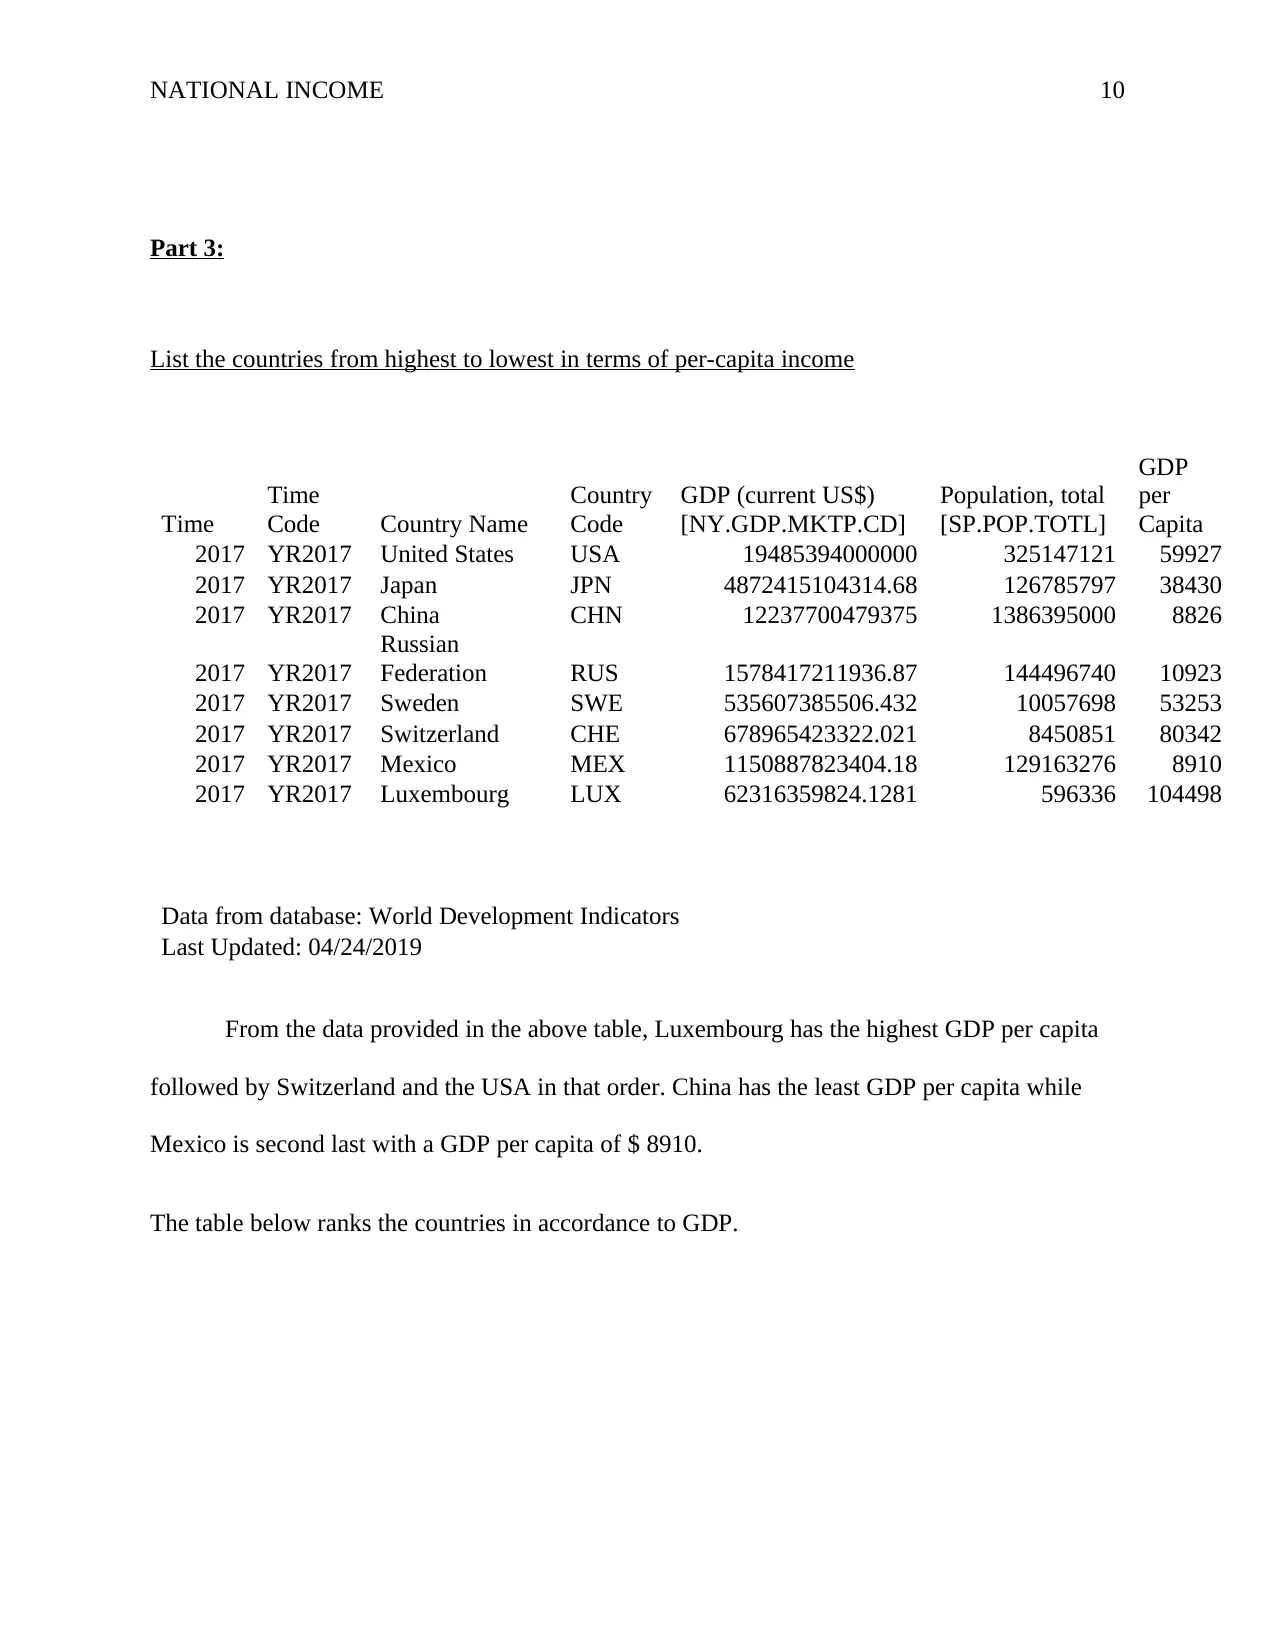
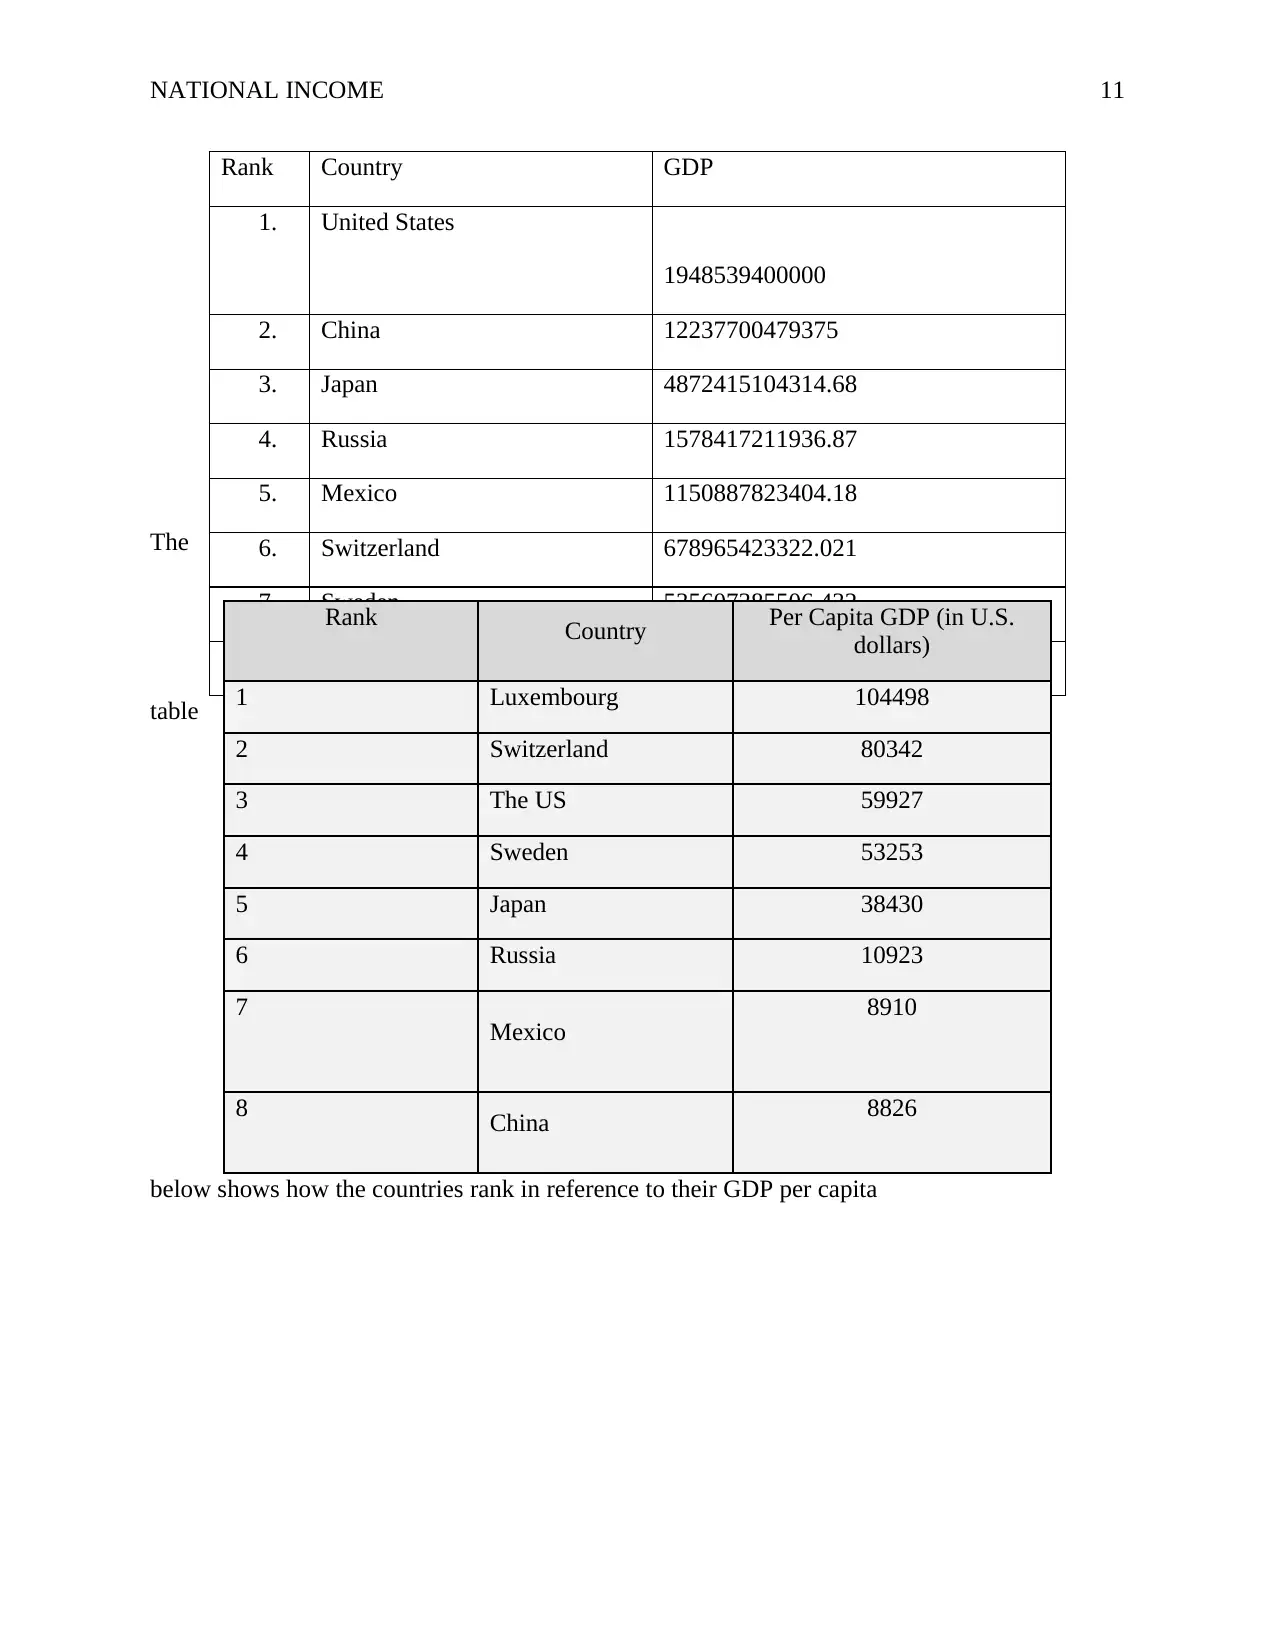
This assignment analyzes national income using both the expenditure and income approaches. Part 1 focuses on calculating GDP using the expenditure approach, comparing nominal and real GDP, and analyzing the components of GDP such as personal consumption, investment, net exports, and government spending. It also explores the differences between nominal and real GDP and the significance of each component. Part 2 shifts to the income approach, examining GDP, GNP, net national product, national income, and personal income. It explains the relationships between these measures and analyzes their components, with a focus on the categories that constitute national income. Part 3 compares countries based on per capita income, ranking them and discussing the significance of GDP and GDP per capita as indicators of economic performance. Part 4 examines overall economic freedom scores and various economic freedoms by country, providing insights into factors influencing economic performance and comparing economic indicators across different nations. The assignment uses data from the Bureau of Economic Analysis and the Heritage Foundation, providing a comprehensive overview of national income analysis.
tabler-icon-diamond-filled.svg

Contribute Materials

Your contribution can guide someone’s learning journey. Share your documents today.
Document Page
Running Head: NATIONAL INCOME 1
Computation of National Income
Students Name
University Affiliation
tabler-icon-diamond-filled.svg

Secure Best Marks with AI Grader

Need help grading? Try our AI Grader for instant feedback on your assignments.
Document Page
NATIONAL INCOME 2
Computation of National Income
Data Exercise 1:
Part 1: Expenditures Approach to Calculating GDP
2018:4Q
Gross Domestic Product $20,865.1
Personal Consumption Expenditures $14,188.4
Gross Private Domestic Investment $3,766.3
Net Exports of Goods & Services $-658.9
Government Consumption Expenditures and
Gross Investment
$3,569.4
2018:3Q
Gross Domestic Product $ 20,658.2
Personal Consumption Expenditures $ 14,050.5
Gross Private Domestic Investment $ 3,710.7
Net Exports of Goods & Services $ -653.5
Government Consumption Expenditures and
Gross Investment
$ 3,550.5
b. GDP.
Using Nominal GDP:
The nominal GDP for the last quarter 0f 2018 was $20,865.1
[Personal consumption expenditures / Nominal GDP] *100%
14188.4
20865.1 × 100 =68%
[Gross private domestic investment / Nominal GDP] *100%
3,766.3
20,8 65. 1 × 100 %=18.05%
[Net exports of goods and services / Nominal GDP] *100%
Document Page
NATIONAL INCOME 3
−658.9
20 ,865.1 ×100 %= 3.16%
Government consumption expenditures and gross investment/ Nominal GDP] *100%
3,569.4
20,8 65.1 ×100 %=¿17.12%
Moreover, using Real GDP:
The real GDP for the last quarter of 2018 was 18,765.3
[Personal consumption expenditures / Real GDP] *100%
13,032.3
18,765.3 ×100 %=69.45%
[Gross private domestic investment / Real] *100%
3,467.3
18,765.3 ×100 %=18.47%
[Net exports of goods and services / Real GDP] *100%
−955.7
18,765.3 ×100 %=-5.09%
[Government consumption expenditures and gross investment/ Real GDP] *100%
3,188.7
18,765.3 ×100 %=16.99%
Document Page
NATIONAL INCOME 4
The tables
Component Amount Proportion of nominal GDP
GDP=20,865.1
Personal Consumption
Expenditure
14188.4 68.0%
Gross Private Domestic
Investment
3,766.3 18.05%
Net Exports of Goods and
Services
-658.9 -3.16%
Government Consumption
Expenditures and Gross
Investment
3,569.4 17.12%
Component Amount Proportion of Real
GDP=18,765.3
Personal Consumption
Expenditures
13,044.2 69.45%
Gross Private Domestic
Investment
3,474.7 18.47%
Net Exports of Goods and
Services
-963.2 -5.09%
Government Consumption
Expenditure
3,195.3 16.99%
tabler-icon-diamond-filled.svg

Secure Best Marks with AI Grader

Need help grading? Try our AI Grader for instant feedback on your assignments.
Document Page
NATIONAL INCOME 5
Why nominal GDP is greater than real GDP
Heretofore, the nominal GDP of the last quarter of 2018 is $20865.1 billion whereas the
real GDP is 18,765.3. Therefore, the nominal GDP exceeds the real GDP by $2099.8 billion.
According to Mankiw (2015), the real GDP always has a higher value than the real GDP because
it carries the effect of inflation. Given that inflation is positive, the value of the real GDP is
always lower than that of the nominal GDP.
Category by proportion of GDP
Analyzing the tables given above, the personal expenditure category constitutes the
highest proportion of both real and nominal GDP at 69.45% and 68% respectively. The
implication of this result points out that any given nation’s GDP majorly consists of personal
consumption expenditure. The net exports and imports category form the least part of both real
and nominal GDP having contributed deficits of 5.09% and 3.16% in that order.
The Gross Private Domestic Investment
This is an estimate of the proportion of capital that investors put into the purchase of
fresh inventory in the economy. It involves purchase of physical assets and stocks. Krugman and
Wells (2013) note that such investments do not factor in the purchase of financial assets such as
bonds.
Why the net export component is negative
Notably, from the two tables above, the percentage contribution of the net exports is
negative. The negative figure is realized because the amount of imports into the US during the
period of analysis was greater than the exports in both real and nominal terms.
Document Page
NATIONAL INCOME 6
National defense
From table 3., national defense expenditure contributed $799.6 billion in nominal terms
and 761.2 in real terms to the government consumption expenditure and gross investment. If
converted into percentage, in nominal terms it contributed 799. 6
3,569.4 × 100 %=22.4 % and
761 ..1
3,188.7 ×100 %=2 3.87 % in real terms as a percentage of government consumption expenditure
and gross investment.
From the foregoing analysis, three crucial lessons were learnt. That, the real GDP is
always less than the nominal GDP since its market prices have been adjusted of inflation of
which the nominal GDP is not. Further, the net exports can be sometimes negatively affecting
the GDP. That happens when the imports are greater than exports yielding a negative figure for
net exports. Finally, the computation of GDP using the expenditure approach assumes that the
total money spent on various products within the economy ought to be equal to income from the
goods and services and that the personal consumption expenditure forms the major part of the
GDP.
Document Page
NATIONAL INCOME 7
Part 2: Income Approach to Calculating GDP
: Income Approach to Calculating GDP
Item Year
total
1st Quarter 2nd
Quarter
3rd Quarter 4th Quarter
Gross domestic product 20,494.1 20,041.0 20,411.9 20,658.2 20,865.1
Gross national product 20,755.5 20,309.8 20,678.9 20,913.3 21,120.0
Net national product 17481.3 17106.4 17425.1 17615.6 17779.4
National income 17,529.4 17,266.2 17,423.7 17,673.9 17,753.6
Personal income 17,569.5 17,319.2 17,466.7 17,657.3 17,835.0
Source: Bureau of Economic Analysis
lysis USA (2019)
GDP and GNP
When considered, GDP and GNP are both measures of economic output of a country
with specific periods. However, GNP values the production that takes place within a country’s
borders while GDP takes the value of production by citizens of a given country whether within
or without the country with adjustments for net production by foreigners.
Further analysis of the data provided shows that the GDP apparently fluctuates.
Sometimes it increases whereas it decreases in some other instances. This phenomenon is
explained by the occurrence of the business cycle as explained by Miller (2012). It falls when the
economy is in recession and rises when the economy booms.
Some adjustments on GDP to find GNP
tabler-icon-diamond-filled.svg

Paraphrase This Document

Need a fresh take? Get an instant paraphrase of this document with our AI Paraphraser
Document Page
NATIONAL INCOME 8
Gross National Product is obtained by introducing the net-income to and from abroad to
the GDP. That way income earned by foreigners in given country is subtracted while that earned
by citizens of that country who are overseas is added to the aggregate income of the economy.
NI and NDP
National income is obtained by adding all earnings attributed to factors of production. For
accountants to arrive at such a figure, they must subtract business tax, transfer payments and any
firm income corrections that do not increase or decrease that national income. It differs from net
domestic product (NDP) because unlike NI, NDP includes all the net factor income from abroad.
National Income (NI) and GNP
Overall, GNP shows to be lower than the national income because for one to arrive at the
GNP, they must deduct capital consumption and other statistical discrepancies. However, in
practice, they are the same except for the discrepancies for which adjustments have to be made.
Category by composition of National Income
From analysis done in this paper, the category of employee compensation constitutes the
major part of national income. The category includes the payment to workers for their services
during a specified period of production.
Significance and Reflection on data analyzed
In practice, GNP is a better measure of economic performance because it includes all incomes
earned by the citizens of a given country whether in or out of the country. Further, GNP exposes
those citizens who repatriate property and income to countries other than where they produce or
earn their income. GNP, as much as GDP has had criticism reveled against them notwithstanding
Document Page
NATIONAL INCOME 9
their performance in exposing repatriation leading to economists resorting to Gross National
Income that they deem more accurate than both GDP and GNP. Other measures that have been
used in some other circumstances include the Gross National happiness and Green GDP to factor
in the effects of production activities on the environment. The world bank is one organization
that has consistently used the GNI in ranking countries according to their economic performance
in three tiers- the low, middle- and high-income earning countries. It is also noteworthy that the
newfound measure in GNI, does not give a summary of development statistics to the economists
and therefore its undoing.
Further, it is important to note that aggregating the personal incomes of all individuals in the
economy may essentially add up to the figure of net national income as such method excludes
the transfer payments such as old age pay and social security funds. Finally, during the lessons of
computing national income using the income approach, it was noted that the overall income
earned by each factor of production may be added to give a common figure that is taken as the
national output.
Document Page
NATIONAL INCOME 10
Part 3:
List the countries from highest to lowest in terms of per-capita income
Time
Time
Code Country Name
Country
Code
GDP (current US$)
[NY.GDP.MKTP.CD]
Population, total
[SP.POP.TOTL]
GDP
per
Capita
2017 YR2017 United States USA 19485394000000 325147121 59927
2017 YR2017 Japan JPN 4872415104314.68 126785797 38430
2017 YR2017 China CHN 12237700479375 1386395000 8826
2017 YR2017
Russian
Federation RUS 1578417211936.87 144496740 10923
2017 YR2017 Sweden SWE 535607385506.432 10057698 53253
2017 YR2017 Switzerland CHE 678965423322.021 8450851 80342
2017 YR2017 Mexico MEX 1150887823404.18 129163276 8910
2017 YR2017 Luxembourg LUX 62316359824.1281 596336 104498
Data from database: World Development Indicators
Last Updated: 04/24/2019
From the data provided in the above table, Luxembourg has the highest GDP per capita
followed by Switzerland and the USA in that order. China has the least GDP per capita while
Mexico is second last with a GDP per capita of $ 8910.
The table below ranks the countries in accordance to GDP.
tabler-icon-diamond-filled.svg

Secure Best Marks with AI Grader

Need help grading? Try our AI Grader for instant feedback on your assignments.
Document Page
NATIONAL INCOME 11
The
table
below shows how the countries rank in reference to their GDP per capita
Rank Country GDP
1. United States
1948539400000
2. China 12237700479375
3. Japan 4872415104314.68
4. Russia 1578417211936.87
5. Mexico 1150887823404.18
6. Switzerland 678965423322.021
7. Sweden 535607385506.432
8. Luxembourg 62316359824.1281
Rank Country Per Capita GDP (in U.S.
dollars)
1 Luxembourg 104498
2 Switzerland 80342
3 The US 59927
4 Sweden 53253
5 Japan 38430
6 Russia 10923
7 Mexico 8910
8 China 8826
Document Page
NATIONAL INCOME 12
From the two rankings above, it is noticeable that the ranking for all the countries differ.
Some countries rank higher when GDP is used but they fall to lower rankings when the GDP per
capita measure is used. Contrary, others such as Luxembourg rank lowly when they are
compared with the rest on the basis of GDP but they top the list when they are ranked depending
on GDP per capita. The reason for this is the difference in population. Countries with higher
population will record lower GDP per capita unless their GDP is extremely high, In this case,
Luxembourg has a lower population when compared with the rest of the countries hence the
higher GDP per capita.
Significance of data on GDP
The determination of economic performance of an economy is anchored in the
computation of national income statistics. According to a Mankiw (2015), the data is useful in
analyzing the performance of a given country across periods and for comparison against the
performance of other countries from the same or other regions of the world (Romer, 2012).
However, under such circumstances, the GDP of all the countries must be first be expressed in a
common currency. On other occasions, the data is useful in creating development plans for the
concerned countries. Also, it can be reckoned that data on the GDP and GDP per capita can be
Document Page
NATIONAL INCOME 13
used by various investors and business people in their development of their policies and
decisions.
It is notable form the analysis hereabove that a country that has a high GDP does not
necessarily have a high GDP per capita. This is because the GDP per capita is majorly dependent
on the size of population that the country has. For example, China in the table above has a high
GDP but her high population sees her drop in the GDP per capita ranking to last.
Finally, in the GDP computation lessons, it was learnt that the GDP is a good measure of
the standard of living despite it ignoring the individual disparities of income distribution among
the citizens of a given country. It fails because it is a collective figure and thus it may portray a
country as a rich one when actually it is a few people holding a large share of the GDP.
tabler-icon-diamond-filled.svg

Paraphrase This Document

Need a fresh take? Get an instant paraphrase of this document with our AI Paraphraser
Document Page
NATIONAL INCOME 14
Part 4:
1)Overall Economic Freedom and Index rank
Country
Overall Economic
Freedom Score
World Index Rank
United States 76.8 12
Japan 72.1 30
China 58.4 100
Luxemburg 75.9 17
Switzerland 81.9 4
Sweden 75.2 19
Russia Federation 58.9 98
Mexico 64.7 66
Source: Heritage Foundation (2019)
2) Various Economic Freedoms by Country
Rank Country Property
rights
Business
freedom Trade freedom Financial freedom
1 Switzerland 85.3 75.4 87.4 90
2 United States 79.3 83.8 86.6 80
3 Luxemburg 83 68.8 86 80
4 Sweden 89.5 88 86 80
5 Japan 84.1 80.5 80 60
6 Mexico 59.1 67.8 81.4 60
7 Russia
Federation 52.4 78.4 77.8 30
8 China 49.9 56.2 73 20
Source: Heritage Foundation (2019)
3)
Document Page
NATIONAL INCOME 15
Country Per Capita GDP (in thousands of U.S.
dollars) Overall score
Switzerland 80342 81.9
USA 59927 76.8
Luxemburg 104498 75.9
Sweden 53253 75.2
Japan 38430 72.1
Mexico 8910 64.7
Russia Federation 10923 58.9
China 8826 58.4
Source: Heritage Foundation
From the data analyzed above, the leading country in overall economic freedom is
Switzerland that ranks 4th worldwide. The United States ranks 12th and is second in the table with
a score of 76.8. China is the last country in the table following Russia which ranks 98th overall
worldwide as shown in the table above.
Economic freedom vs GDP per capita of the case countries
Those countries that record high rankings in economic freedoms also tend to record
higher GDP. Switzerland, the US and Luxembourg are among those countries that exhibit this
phenomenon when they paralleled with countries with lower economic freedoms such as
Mexico.
Significance and Reflection
The data on economic freedom is important as it illustrated that countries that are
economically freer encourage better production and higher GDP when compared to those
countries lower in the economic freedom rankings. Those countries that show sturdy economic
Document Page
NATIONAL INCOME 16
freedoms always have a higher productivity when compared in terms of GDP (Krieger &
Meirrieks, 2016). Moreover, the concept of economic freedom helps governments to discover the
remedies of widespread poverty. That is so because higher economic freedoms, as proffered by
Saunoris and Sjny(2017), lead to lower levels of unemployment and a boosted living standard
thereof. Establishment and operation of businesses in countries with greater economic freedom is
also cheaper and easier. Countries that respect property rights encourage economic growth and
development and that sets the pace for the rest of the world with lower freedoms.
tabler-icon-diamond-filled.svg

Secure Best Marks with AI Grader

Need help grading? Try our AI Grader for instant feedback on your assignments.
Document Page
NATIONAL INCOME 17
References
Bureau of Economic Analysis USA (2019). Gross domestic product fourth quarter 2018 and
annual 2018(third estimate) cooperate profits, fourth quarter 2018 and annual 2018.
Retrieved from: https://www.bea.gov/system/files/2019-03/gdp4q18_3rd_1.pdf
Heritage Foundation (2019). 2019 Index of economic freedom. Retrieved from:
https://www.heritage.org/index/explore
Krugman P., & Wells, R. (2013). Economics (3rd ed.) New York, NY: Worth publisher.
Krieger, T. &Meierrieks, D. (2016). Political capitalism: The interaction between income
inequality, economic freedom and democracy. European Journal of Political Economy
45(2016): 115-132
Mankiw, N. G. (2015). Principles of economics. (7th ed.) Boston, MA: Cengage Learning.
Miller, R. L. (2012). Economics today: The macro view. (16th ed.) Boston, MA: Addison-
Wesley.
Romer, D. (2012). Advanced macroeconomics. (4th ed.). New York, NY: McGraw Hill Irwin.
Saunoris, J. W, & Sajny, A. (2017). Entrepreneurship and economic freedom: cross-country
evidence from formal and informal sectors. Entrepreneurship &Regional Development
29 (3-4), 292-316.
Document Page
NATIONAL INCOME 18
chevron_up_icon
1 out of 18
circle_padding
hide_on_mobile
zoom_out_icon
logo.png

Your All-in-One AI-Powered Toolkit for Academic Success.

Available 24*7 on WhatsApp / Email

[object Object]