Financial Analysis Project Report: NATIONAL TAKAFUL COMPANY Overview
VerifiedAdded on 2020/04/21
|16
|2741
|216
Project
AI Summary
This project report conducts a comprehensive financial analysis of NATIONAL TAKAFUL COMPANY, focusing on its performance in the UAE market. It provides a company overview, including its establishment in 2011 and its focus on Health Takaful. The analysis utilizes various financial tactics such as ratio analysis, DU Pont analysis, and trend analysis to evaluate the company's profitability, liquidity, and solvency. The report highlights the negative net margin and ROE, while also discussing improvements in liquidity and debt management. The DU Pont analysis assesses the return on equity, and trend analysis examines changes in financial performance over time. Industry analysis provides context within the UAE insurance sector, and the report concludes with an assessment of the company's improving position. The appendix includes detailed financial data and calculations to support the analysis.
Running Head: Financial Statement analysis
1
Project Report: Financial Statement analysis
1
Project Report: Financial Statement analysis
Paraphrase This Document
Need a fresh take? Get an instant paraphrase of this document with our AI Paraphraser
Financial Statement analysis
2
Contents
Introduction.......................................................................................................................3
Company overview...........................................................................................................3
Financial analysis..............................................................................................................3
Ratio analysis................................................................................................................3
DU Pont analysis..........................................................................................................4
Trend analysis...............................................................................................................5
Industry analysis...........................................................................................................5
Conclusion........................................................................................................................5
References.........................................................................................................................7
Appendix...........................................................................................................................8
Financial Statement analysis
3
Introduction:
This report has been prepared to analyze the financial position of NATIONAL
TAKAFUL COMPANY. In this report, various financial tactics and methods have been used
to evaluate the position of the company in the market.
Company overview:
NATIONAL TAKAFUL COMPANY is operating its business into ABU DHABI,
UAE. This company has come into existence in 2011. It has been founded by National
insurance company and National Islamic finance. Currently, 6 branches are operated by this
company in the UAE market. The main operations of this company are to offer the Health
Takaful to its employees (Home, 2017).
Further, the economical condition of UAE is quite string right now. The country is
performing well and the companies in this country are also achieving the high growth into the
market. The growth of the company is continuously increasing (ADX, 2017).
Financial analysis:
A financial analysis study has been performed over the company to analyze and
investigate the position of the company. Ratio analysis, DU Pont analysis and trend analysis
study has been done over the NATIONAL TAKAFUL COMPANY (Ansari, 2004).
Ratio analysis:
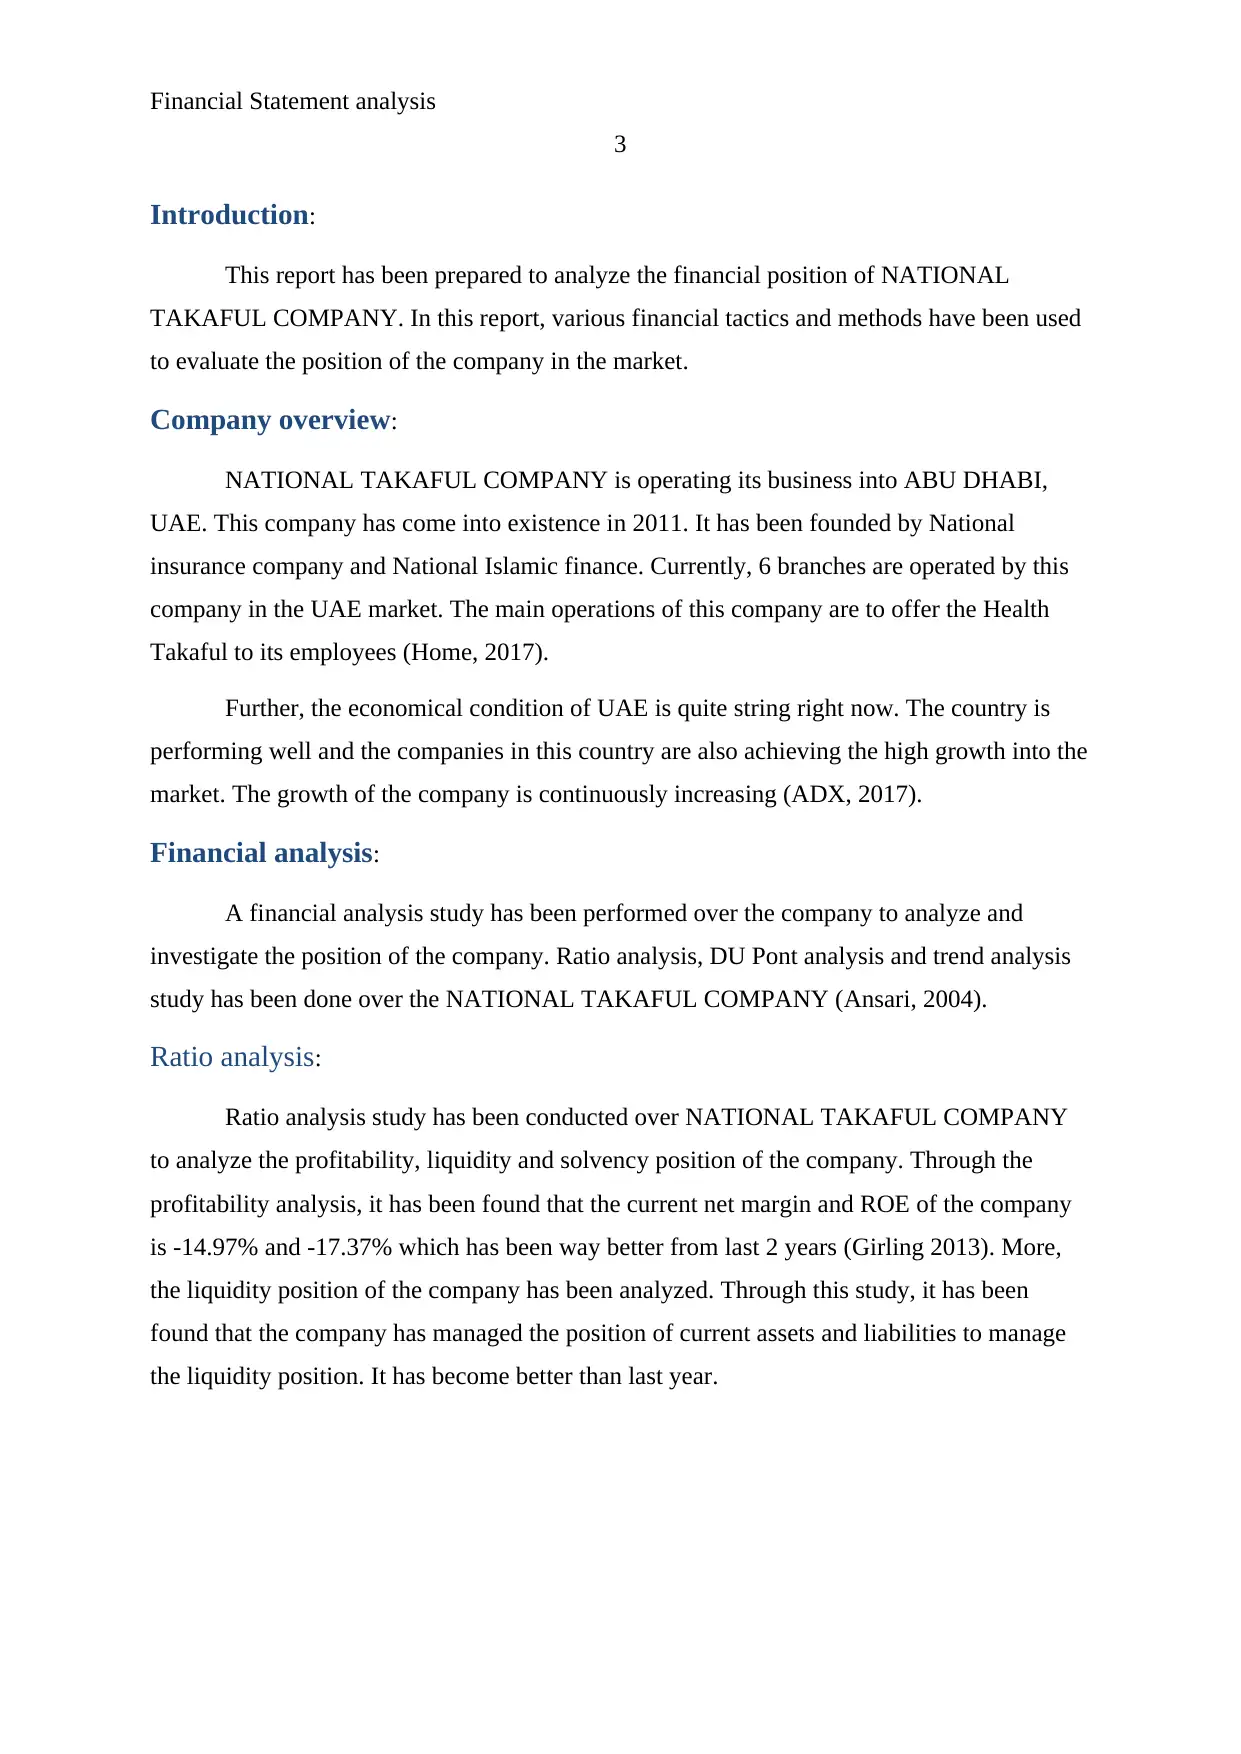
Ratio analysis study has been conducted over NATIONAL TAKAFUL COMPANY
to analyze the profitability, liquidity and solvency position of the company. Through the
profitability analysis, it has been found that the current net margin and ROE of the company
is -14.97% and -17.37% which has been way better from last 2 years (Girling 2013). More,
the liquidity position of the company has been analyzed. Through this study, it has been
found that the company has managed the position of current assets and liabilities to manage
the liquidity position. It has become better than last year.
3
Introduction:
This report has been prepared to analyze the financial position of NATIONAL
TAKAFUL COMPANY. In this report, various financial tactics and methods have been used
to evaluate the position of the company in the market.
Company overview:
NATIONAL TAKAFUL COMPANY is operating its business into ABU DHABI,
UAE. This company has come into existence in 2011. It has been founded by National
insurance company and National Islamic finance. Currently, 6 branches are operated by this
company in the UAE market. The main operations of this company are to offer the Health
Takaful to its employees (Home, 2017).
Further, the economical condition of UAE is quite string right now. The country is
performing well and the companies in this country are also achieving the high growth into the
market. The growth of the company is continuously increasing (ADX, 2017).
Financial analysis:
A financial analysis study has been performed over the company to analyze and
investigate the position of the company. Ratio analysis, DU Pont analysis and trend analysis
study has been done over the NATIONAL TAKAFUL COMPANY (Ansari, 2004).
Ratio analysis:
Ratio analysis study has been conducted over NATIONAL TAKAFUL COMPANY
to analyze the profitability, liquidity and solvency position of the company. Through the
profitability analysis, it has been found that the current net margin and ROE of the company
is -14.97% and -17.37% which has been way better from last 2 years (Girling 2013). More,
the liquidity position of the company has been analyzed. Through this study, it has been
found that the company has managed the position of current assets and liabilities to manage
the liquidity position. It has become better than last year.
⊘ This is a preview!⊘
Do you want full access?
Subscribe today to unlock all pages.
Trusted by 1+ million students worldwide
Financial Statement analysis
4
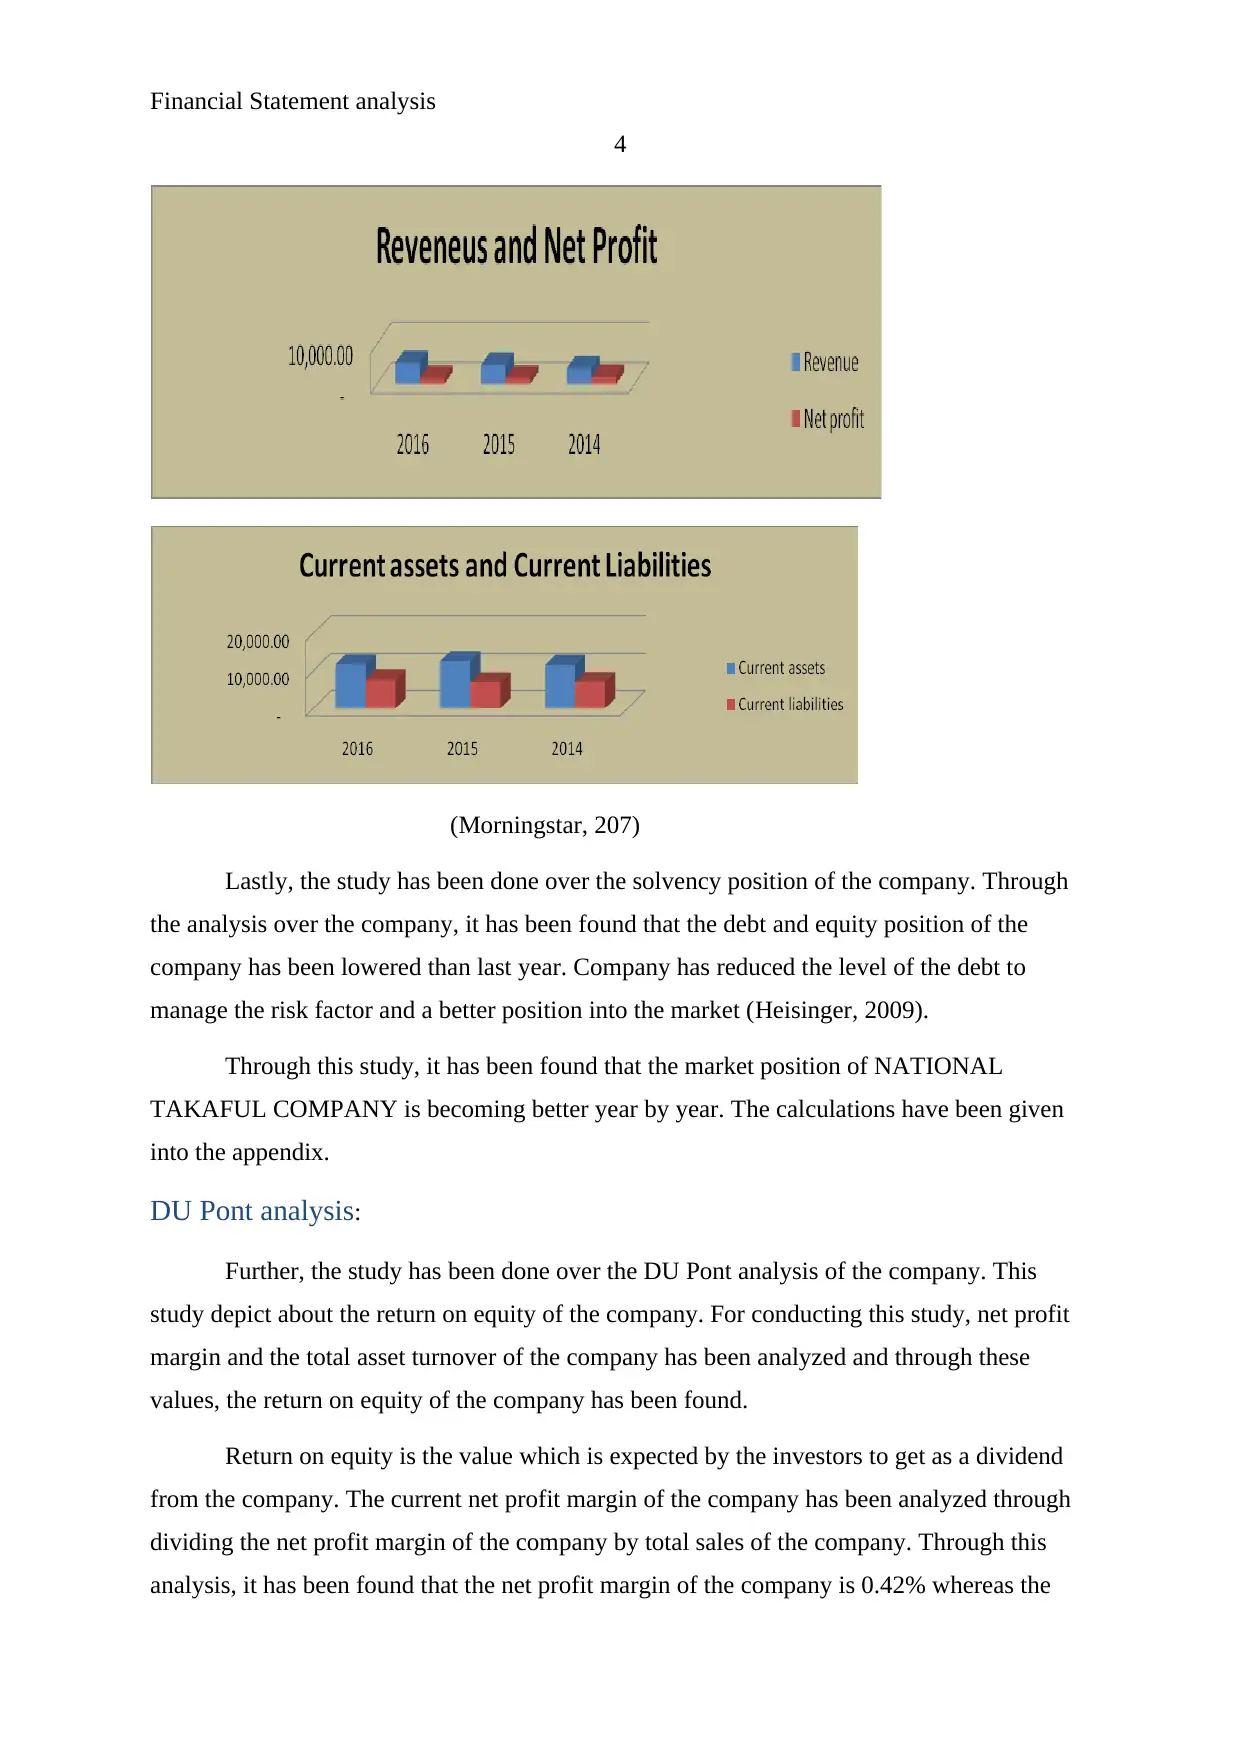
(Morningstar, 207)
Lastly, the study has been done over the solvency position of the company. Through
the analysis over the company, it has been found that the debt and equity position of the
company has been lowered than last year. Company has reduced the level of the debt to
manage the risk factor and a better position into the market (Heisinger, 2009).
Through this study, it has been found that the market position of NATIONAL
TAKAFUL COMPANY is becoming better year by year. The calculations have been given
into the appendix.
DU Pont analysis:
Further, the study has been done over the DU Pont analysis of the company. This
study depict about the return on equity of the company. For conducting this study, net profit
margin and the total asset turnover of the company has been analyzed and through these
values, the return on equity of the company has been found.
Return on equity is the value which is expected by the investors to get as a dividend
from the company. The current net profit margin of the company has been analyzed through
dividing the net profit margin of the company by total sales of the company. Through this
analysis, it has been found that the net profit margin of the company is 0.42% whereas the
4
(Morningstar, 207)
Lastly, the study has been done over the solvency position of the company. Through
the analysis over the company, it has been found that the debt and equity position of the
company has been lowered than last year. Company has reduced the level of the debt to
manage the risk factor and a better position into the market (Heisinger, 2009).
Through this study, it has been found that the market position of NATIONAL
TAKAFUL COMPANY is becoming better year by year. The calculations have been given
into the appendix.
DU Pont analysis:
Further, the study has been done over the DU Pont analysis of the company. This
study depict about the return on equity of the company. For conducting this study, net profit
margin and the total asset turnover of the company has been analyzed and through these
values, the return on equity of the company has been found.
Return on equity is the value which is expected by the investors to get as a dividend
from the company. The current net profit margin of the company has been analyzed through
dividing the net profit margin of the company by total sales of the company. Through this
analysis, it has been found that the net profit margin of the company is 0.42% whereas the
Paraphrase This Document
Need a fresh take? Get an instant paraphrase of this document with our AI Paraphraser
Financial Statement analysis
5
total asset turnover of the company has also been analyzed through dividing the sales by total
assets of the company and it has been found that the total asset turnover of the company is
0.2845 (Warren, Reeve & Duchac, 2011).
More, the return one equity of the company has been analyzed through multiplying
the net profit margin and the total asset turnover of the company and the current ROE of the
company is 0.12% which depict that the company would pay 0.12% of the total profit to each
share holder of the company as dividend. The calculations have been given into the appendix.
Trend analysis:
Further, the study has been done over the trend analysis of the company, through this
analysis; it has been found that the position of the company is rapidly changing in every year.
The study of trend analysis has been done over the income statement, balance sheet and cash
flow statement of the company to analyze the changes which has take place into the financial
performance and the figures in each year (Weygandt, Kimmel & Kieso, 2009).
Through this analysis, it has been found that the entire activities have been changed in
every year in the financial reports of the company. Mostly, all the changes are depicting
about the better performance and good result about the company. The calculations have been
given into the appendix.
Industry analysis:
Further, the study has been done over the industry and the position of the company in
the industry. According to the insurance industry of UAE, it has been found that the positive
changes are taken place into the performance of the industry. Earlier, this industry has faced
various losses and due to which the performance of all the companies which are operating
into this industry has been affected. But with the time, various positive changes have taken
place into the position and the performance of the industry and thus the company position has
also been improved (Index, 2017).
The study over the company and the industry, cumulatively depict that the
performance and the position has been way better in last few years and thus it is expected by
the company to enhance and manage the better position in the market.
Conclusion:

Financial Statement analysis
6
Through the above study, it has been analyzed that various positive changes have
taken place into the position of the company and due to which the performance of the
company has also been improved. Through the financial analysis over the company, it has
been concluded that the performance of the company is becoming better day by day. The
current position of the company is not that much good but according to the last year,
performance and the profitability position of the company has been improved.
⊘ This is a preview!⊘
Do you want full access?
Subscribe today to unlock all pages.
Trusted by 1+ million students worldwide
Financial Statement analysis
7
References:
Morningstar. (2017). NATIONAL TAKAFUL COMPANY. Retrieved from
http://financials.morningstar.com/income-statement/is.html?t=WATANIA®ion=are
available as on 6th Nov 2017.
ADX. (2017). NATIONAL TAKAFUL COMPANY. Retrieved from
https://www.adx.ae/English/Pages/default.aspx available as on 6th Nov 2017.
Home. (2017). NATIONAL TAKAFUL COMPANY. Retrieved from
https://takaful.ae/en/about-us/overview/ available as on 6th Nov 2017.
Index (2017). Insurance industry. Retrieved from https://www.takaful.ae/english/index.aspx
available as on 6th Nov 2017.
Weygandt J., Kimmel P., Kieso D. (2009). Managerial Accounting:Tools for business
decision making. John Wiley & sons.
Warren C., Reeve J. & Duchac J. (2011). Financial and Managerail Accounting. Cengage
Learning.
Heisinger K. (2009). Essentials of Managerial Accounting. Cengage learning.
Girling P. (2013). Operational Risk Management. John Wiley & sons.
Ansari S. (2004). Management Accounting: A Strategic Focus. Houghton Mifflin College
Devision.
Paraphrase This Document
Need a fresh take? Get an instant paraphrase of this document with our AI Paraphraser
Financial Statement analysis
8
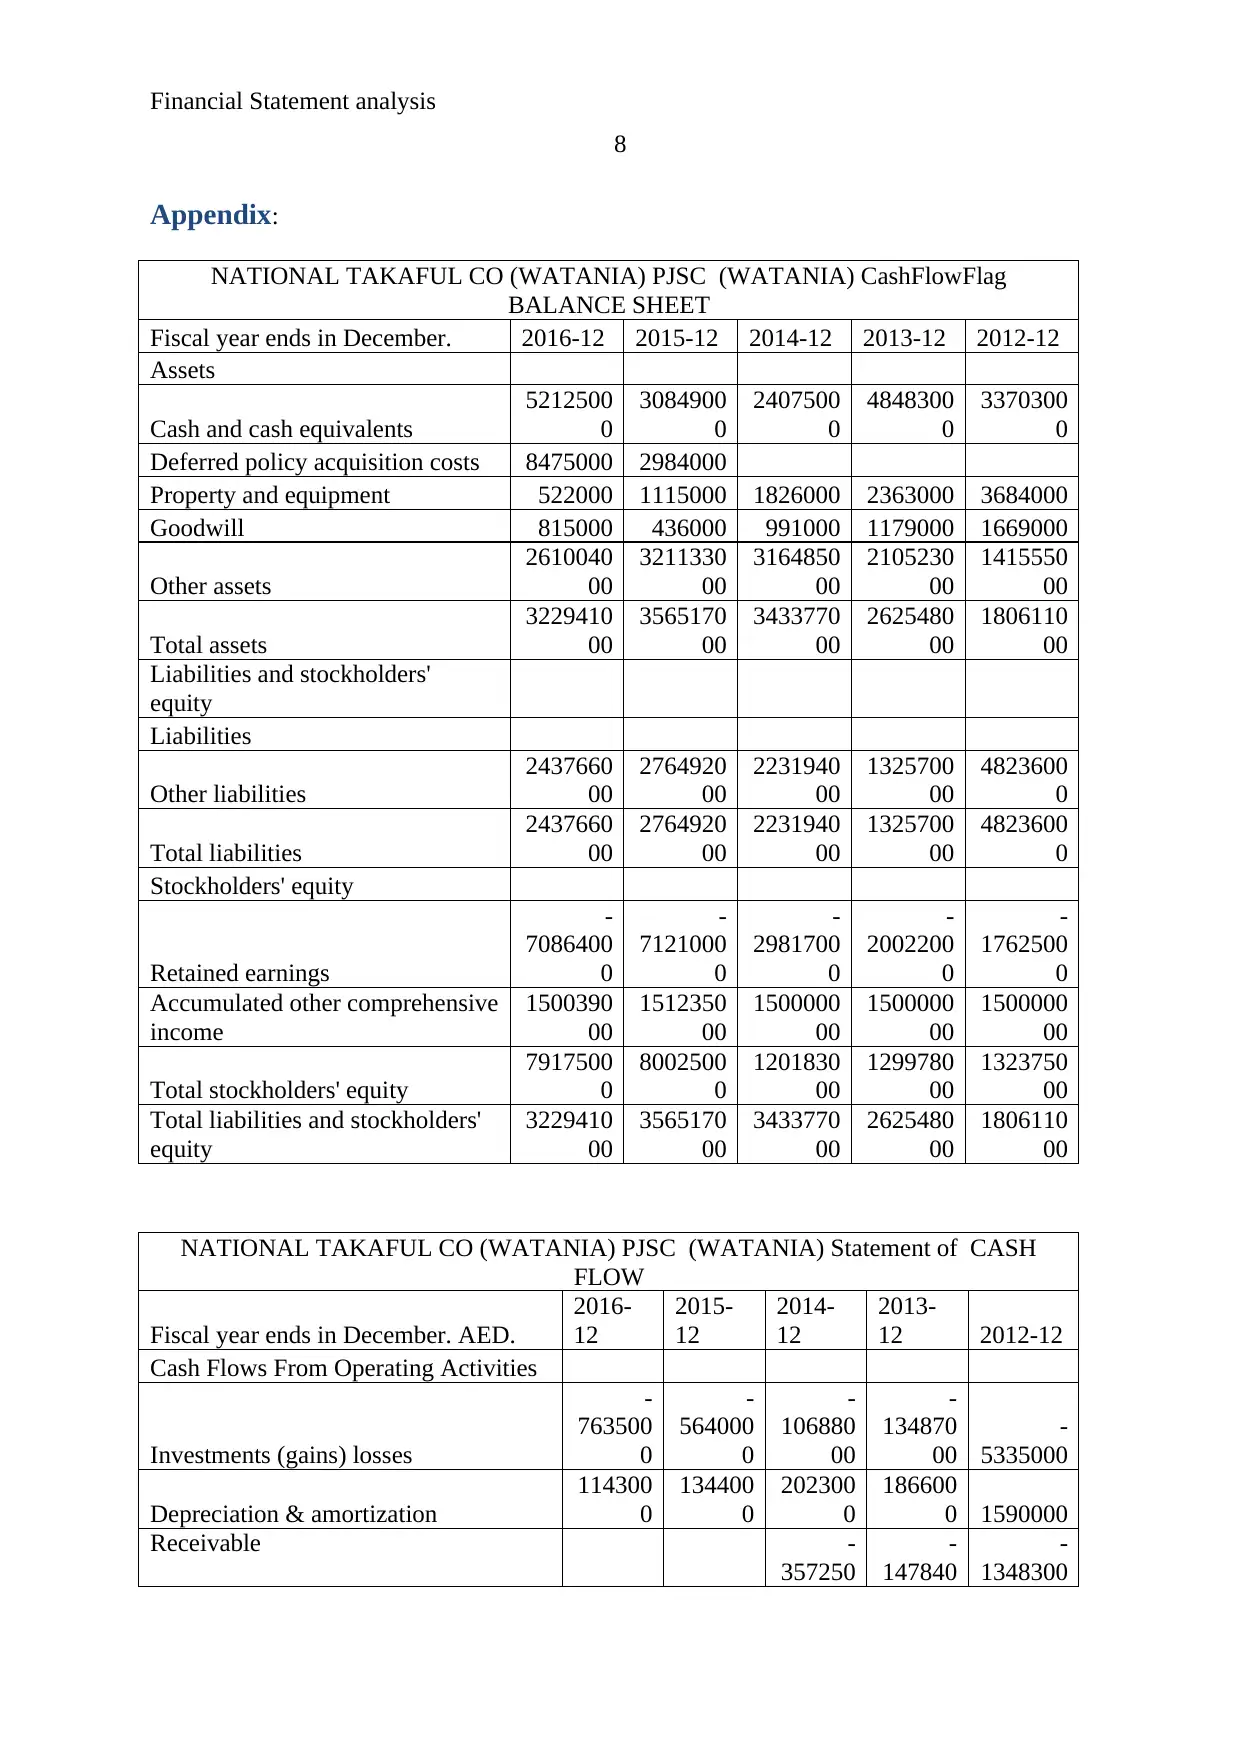
Appendix:
NATIONAL TAKAFUL CO (WATANIA) PJSC (WATANIA) CashFlowFlag
BALANCE SHEET
Fiscal year ends in December. 2016-12 2015-12 2014-12 2013-12 2012-12
Assets
Cash and cash equivalents
5212500
0
3084900
0
2407500
0
4848300
0
3370300
0
Deferred policy acquisition costs 8475000 2984000
Property and equipment 522000 1115000 1826000 2363000 3684000
Goodwill 815000 436000 991000 1179000 1669000
Other assets
2610040
00
3211330
00
3164850
00
2105230
00
1415550
00
Total assets
3229410
00
3565170
00
3433770
00
2625480
00
1806110
00
Liabilities and stockholders'
equity
Liabilities
Other liabilities
2437660
00
2764920
00
2231940
00
1325700
00
4823600
0
Total liabilities
2437660
00
2764920
00
2231940
00
1325700
00
4823600
0
Stockholders' equity
Retained earnings
-
7086400
0
-
7121000
0
-
2981700
0
-
2002200
0
-
1762500
0
Accumulated other comprehensive
income
1500390
00
1512350
00
1500000
00
1500000
00
1500000
00
Total stockholders' equity
7917500
0
8002500
0
1201830
00
1299780
00
1323750
00
Total liabilities and stockholders'
equity
3229410
00
3565170
00
3433770
00
2625480
00
1806110
00
NATIONAL TAKAFUL CO (WATANIA) PJSC (WATANIA) Statement of CASH
FLOW
Fiscal year ends in December. AED.
2016-
12
2015-
12
2014-
12
2013-
12 2012-12
Cash Flows From Operating Activities
Investments (gains) losses
-
763500
0
-
564000
0
-
106880
00
-
134870
00
-
5335000
Depreciation & amortization
114300
0
134400
0
202300
0
186600
0 1590000
Receivable -
357250
-
147840
-
1348300
8
Appendix:
NATIONAL TAKAFUL CO (WATANIA) PJSC (WATANIA) CashFlowFlag
BALANCE SHEET
Fiscal year ends in December. 2016-12 2015-12 2014-12 2013-12 2012-12
Assets
Cash and cash equivalents
5212500
0
3084900
0
2407500
0
4848300
0
3370300
0
Deferred policy acquisition costs 8475000 2984000
Property and equipment 522000 1115000 1826000 2363000 3684000
Goodwill 815000 436000 991000 1179000 1669000
Other assets
2610040
00
3211330
00
3164850
00
2105230
00
1415550
00
Total assets
3229410
00
3565170
00
3433770
00
2625480
00
1806110
00
Liabilities and stockholders'
equity
Liabilities
Other liabilities
2437660
00
2764920
00
2231940
00
1325700
00
4823600
0
Total liabilities
2437660
00
2764920
00
2231940
00
1325700
00
4823600
0
Stockholders' equity
Retained earnings
-
7086400
0
-
7121000
0
-
2981700
0
-
2002200
0
-
1762500
0
Accumulated other comprehensive
income
1500390
00
1512350
00
1500000
00
1500000
00
1500000
00
Total stockholders' equity
7917500
0
8002500
0
1201830
00
1299780
00
1323750
00
Total liabilities and stockholders'
equity
3229410
00
3565170
00
3433770
00
2625480
00
1806110
00
NATIONAL TAKAFUL CO (WATANIA) PJSC (WATANIA) Statement of CASH
FLOW
Fiscal year ends in December. AED.
2016-
12
2015-
12
2014-
12
2013-
12 2012-12
Cash Flows From Operating Activities
Investments (gains) losses
-
763500
0
-
564000
0
-
106880
00
-
134870
00
-
5335000
Depreciation & amortization
114300
0
134400
0
202300
0
186600
0 1590000
Receivable -
357250
-
147840
-
1348300
Financial Statement analysis
9
00 00 0
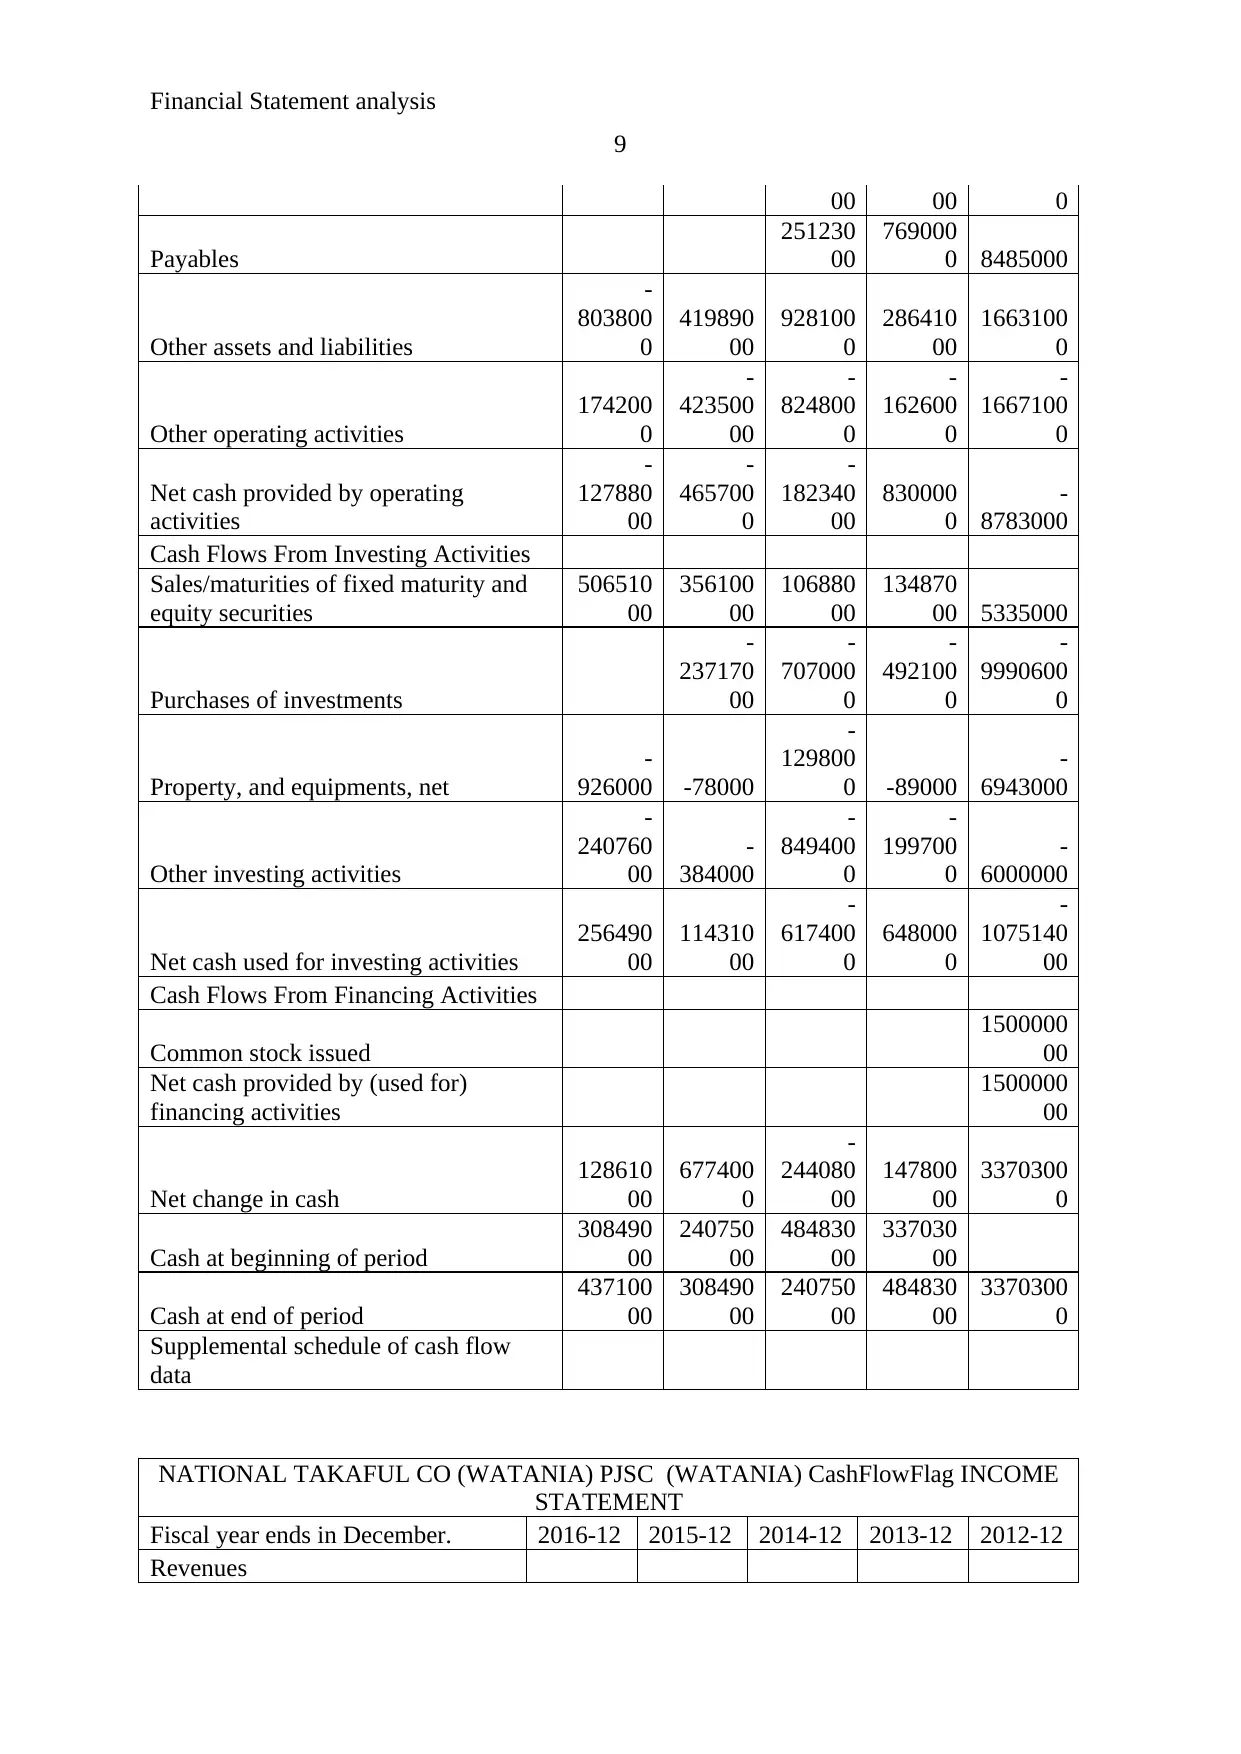
Payables
251230
00
769000
0 8485000
Other assets and liabilities
-
803800
0
419890
00
928100
0
286410
00
1663100
0
Other operating activities
174200
0
-
423500
00
-
824800
0
-
162600
0
-
1667100
0
Net cash provided by operating
activities
-
127880
00
-
465700
0
-
182340
00
830000
0
-
8783000
Cash Flows From Investing Activities
Sales/maturities of fixed maturity and
equity securities
506510
00
356100
00
106880
00
134870
00 5335000
Purchases of investments
-
237170
00
-
707000
0
-
492100
0
-
9990600
0
Property, and equipments, net
-
926000 -78000
-
129800
0 -89000
-
6943000
Other investing activities
-
240760
00
-
384000
-
849400
0
-
199700
0
-
6000000
Net cash used for investing activities
256490
00
114310
00
-
617400
0
648000
0
-
1075140
00
Cash Flows From Financing Activities
Common stock issued
1500000
00
Net cash provided by (used for)
financing activities
1500000
00
Net change in cash
128610
00
677400
0
-
244080
00
147800
00
3370300
0
Cash at beginning of period
308490
00
240750
00
484830
00
337030
00
Cash at end of period
437100
00
308490
00
240750
00
484830
00
3370300
0
Supplemental schedule of cash flow
data
NATIONAL TAKAFUL CO (WATANIA) PJSC (WATANIA) CashFlowFlag INCOME
STATEMENT
Fiscal year ends in December. 2016-12 2015-12 2014-12 2013-12 2012-12
Revenues
9
00 00 0
Payables
251230
00
769000
0 8485000
Other assets and liabilities
-
803800
0
419890
00
928100
0
286410
00
1663100
0
Other operating activities
174200
0
-
423500
00
-
824800
0
-
162600
0
-
1667100
0
Net cash provided by operating
activities
-
127880
00
-
465700
0
-
182340
00
830000
0
-
8783000
Cash Flows From Investing Activities
Sales/maturities of fixed maturity and
equity securities
506510
00
356100
00
106880
00
134870
00 5335000
Purchases of investments
-
237170
00
-
707000
0
-
492100
0
-
9990600
0
Property, and equipments, net
-
926000 -78000
-
129800
0 -89000
-
6943000
Other investing activities
-
240760
00
-
384000
-
849400
0
-
199700
0
-
6000000
Net cash used for investing activities
256490
00
114310
00
-
617400
0
648000
0
-
1075140
00
Cash Flows From Financing Activities
Common stock issued
1500000
00
Net cash provided by (used for)
financing activities
1500000
00
Net change in cash
128610
00
677400
0
-
244080
00
147800
00
3370300
0
Cash at beginning of period
308490
00
240750
00
484830
00
337030
00
Cash at end of period
437100
00
308490
00
240750
00
484830
00
3370300
0
Supplemental schedule of cash flow
data
NATIONAL TAKAFUL CO (WATANIA) PJSC (WATANIA) CashFlowFlag INCOME
STATEMENT
Fiscal year ends in December. 2016-12 2015-12 2014-12 2013-12 2012-12
Revenues
⊘ This is a preview!⊘
Do you want full access?
Subscribe today to unlock all pages.
Trusted by 1+ million students worldwide
Financial Statement analysis
10
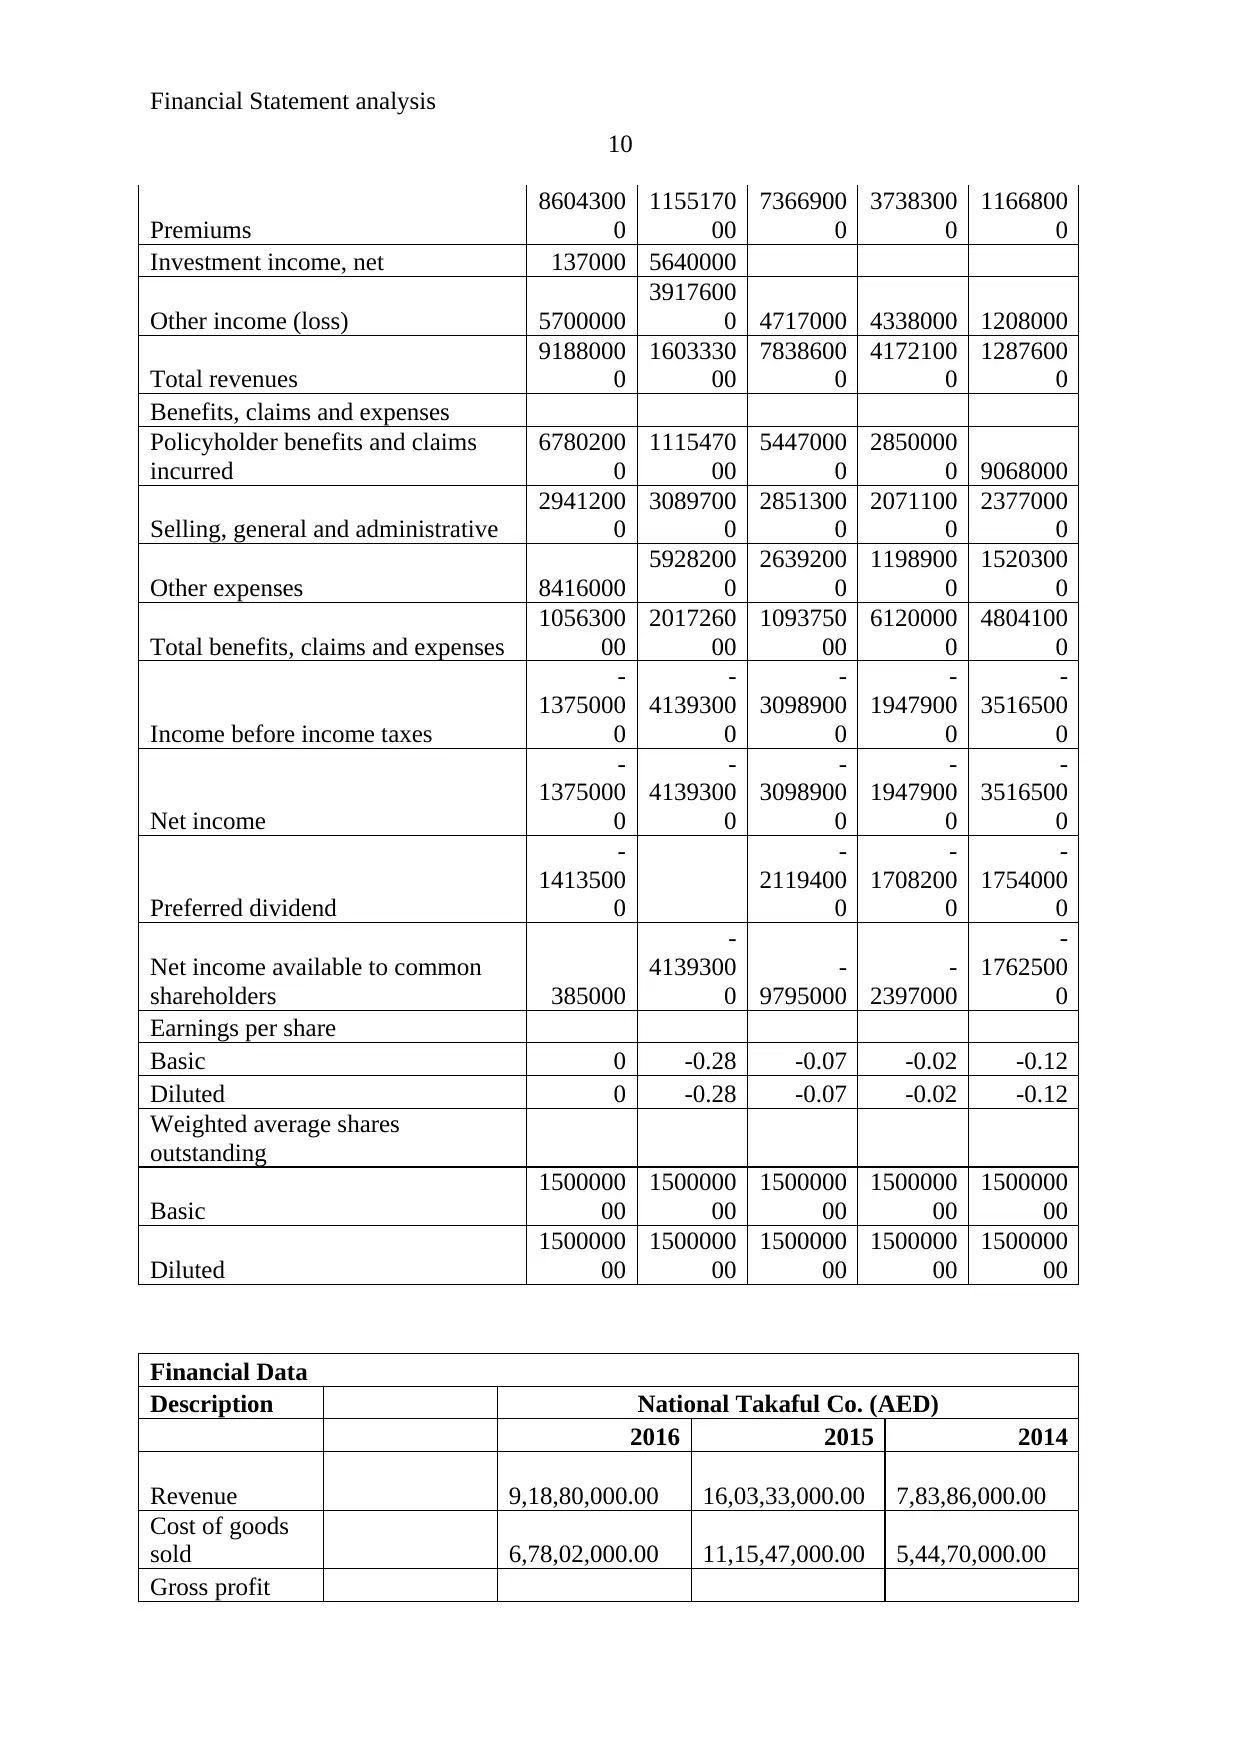
Premiums
8604300
0
1155170
00
7366900
0
3738300
0
1166800
0
Investment income, net 137000 5640000
Other income (loss) 5700000
3917600
0 4717000 4338000 1208000
Total revenues
9188000
0
1603330
00
7838600
0
4172100
0
1287600
0
Benefits, claims and expenses
Policyholder benefits and claims
incurred
6780200
0
1115470
00
5447000
0
2850000
0 9068000
Selling, general and administrative
2941200
0
3089700
0
2851300
0
2071100
0
2377000
0
Other expenses 8416000
5928200
0
2639200
0
1198900
0
1520300
0
Total benefits, claims and expenses
1056300
00
2017260
00
1093750
00
6120000
0
4804100
0
Income before income taxes
-
1375000
0
-
4139300
0
-
3098900
0
-
1947900
0
-
3516500
0
Net income
-
1375000
0
-
4139300
0
-
3098900
0
-
1947900
0
-
3516500
0
Preferred dividend
-
1413500
0
-
2119400
0
-
1708200
0
-
1754000
0
Net income available to common
shareholders 385000
-
4139300
0
-
9795000
-
2397000
-
1762500
0
Earnings per share
Basic 0 -0.28 -0.07 -0.02 -0.12
Diluted 0 -0.28 -0.07 -0.02 -0.12
Weighted average shares
outstanding
Basic
1500000
00
1500000
00
1500000
00
1500000
00
1500000
00
Diluted
1500000
00
1500000
00
1500000
00
1500000
00
1500000
00
Financial Data
Description National Takaful Co. (AED)
2016 2015 2014
Revenue 9,18,80,000.00 16,03,33,000.00 7,83,86,000.00
Cost of goods
sold 6,78,02,000.00 11,15,47,000.00 5,44,70,000.00
Gross profit
10
Premiums
8604300
0
1155170
00
7366900
0
3738300
0
1166800
0
Investment income, net 137000 5640000
Other income (loss) 5700000
3917600
0 4717000 4338000 1208000
Total revenues
9188000
0
1603330
00
7838600
0
4172100
0
1287600
0
Benefits, claims and expenses
Policyholder benefits and claims
incurred
6780200
0
1115470
00
5447000
0
2850000
0 9068000
Selling, general and administrative
2941200
0
3089700
0
2851300
0
2071100
0
2377000
0
Other expenses 8416000
5928200
0
2639200
0
1198900
0
1520300
0
Total benefits, claims and expenses
1056300
00
2017260
00
1093750
00
6120000
0
4804100
0
Income before income taxes
-
1375000
0
-
4139300
0
-
3098900
0
-
1947900
0
-
3516500
0
Net income
-
1375000
0
-
4139300
0
-
3098900
0
-
1947900
0
-
3516500
0
Preferred dividend
-
1413500
0
-
2119400
0
-
1708200
0
-
1754000
0
Net income available to common
shareholders 385000
-
4139300
0
-
9795000
-
2397000
-
1762500
0
Earnings per share
Basic 0 -0.28 -0.07 -0.02 -0.12
Diluted 0 -0.28 -0.07 -0.02 -0.12
Weighted average shares
outstanding
Basic
1500000
00
1500000
00
1500000
00
1500000
00
1500000
00
Diluted
1500000
00
1500000
00
1500000
00
1500000
00
1500000
00
Financial Data
Description National Takaful Co. (AED)
2016 2015 2014
Revenue 9,18,80,000.00 16,03,33,000.00 7,83,86,000.00
Cost of goods
sold 6,78,02,000.00 11,15,47,000.00 5,44,70,000.00
Gross profit
Paraphrase This Document
Need a fresh take? Get an instant paraphrase of this document with our AI Paraphraser
Financial Statement analysis
11
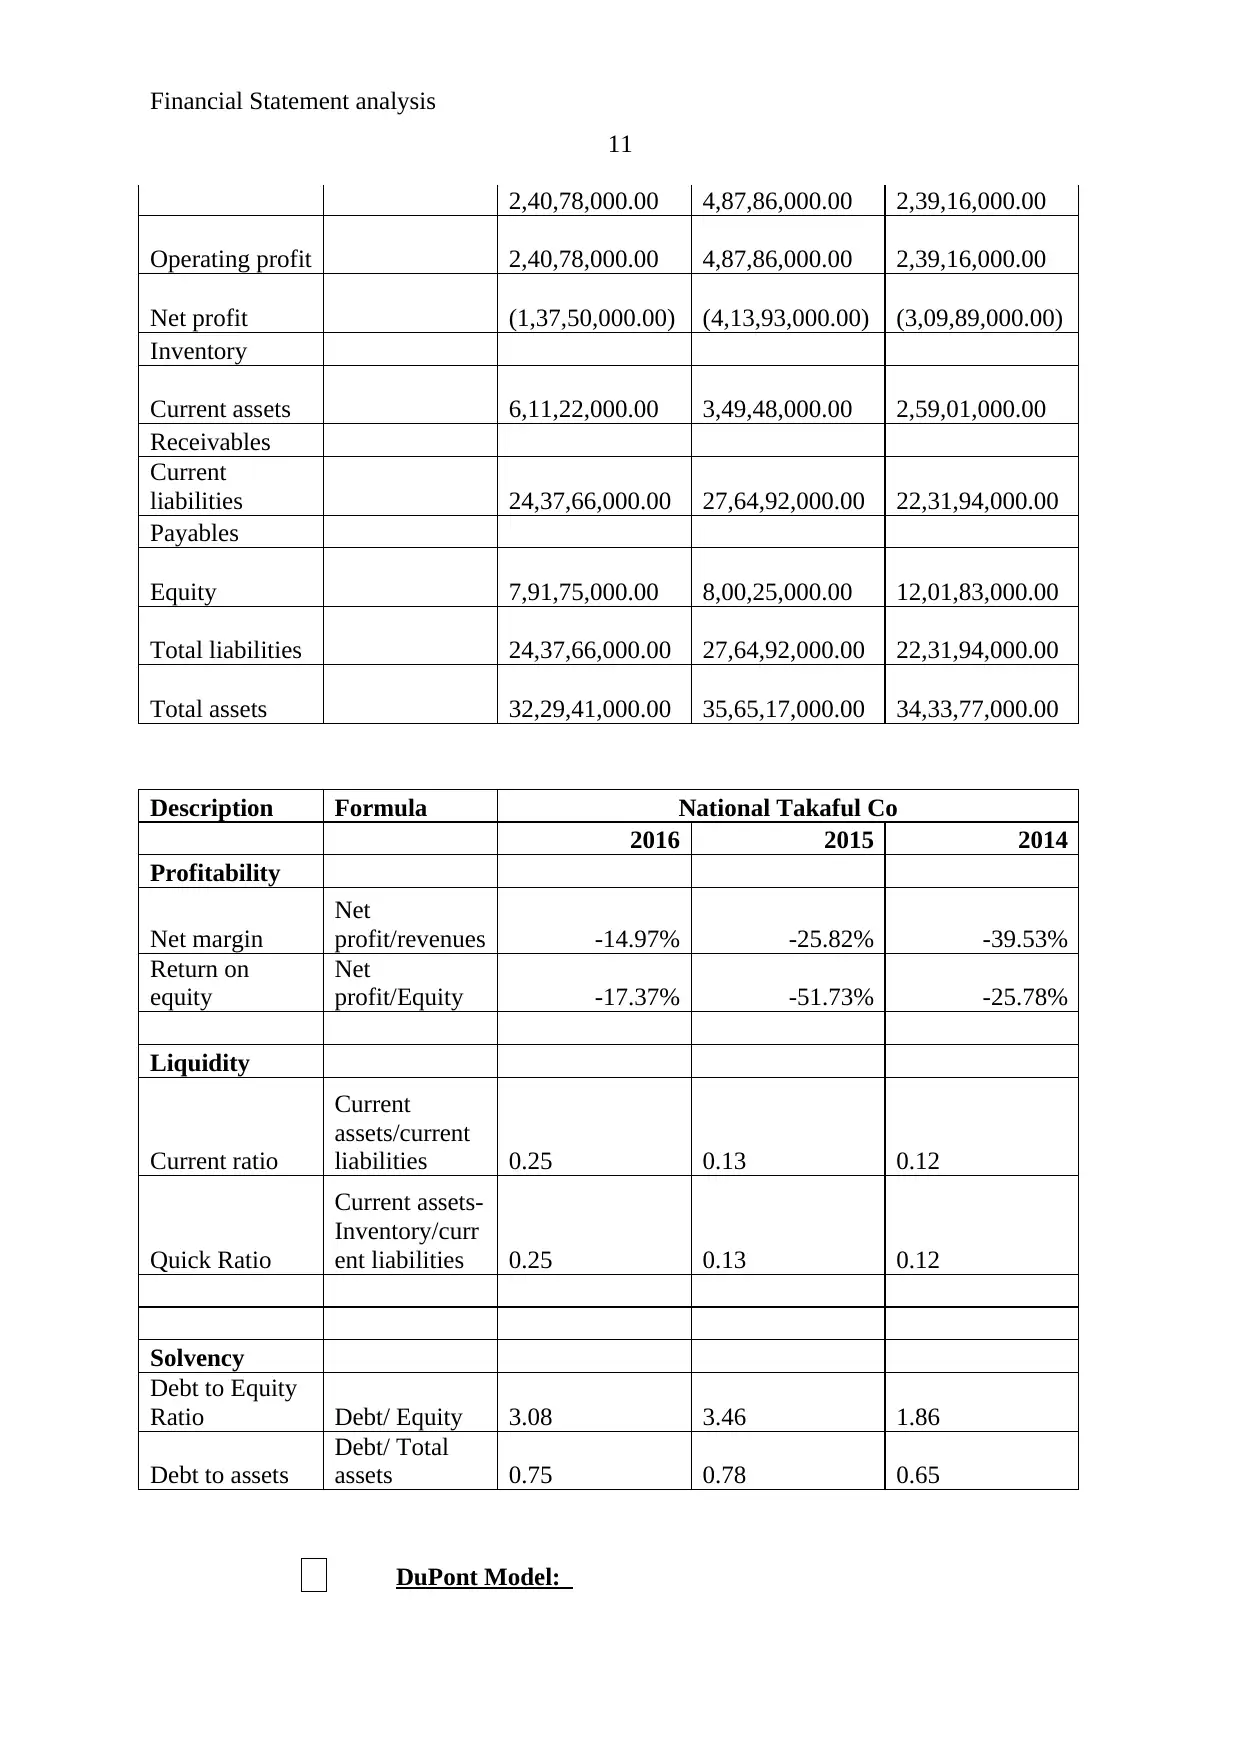
2,40,78,000.00 4,87,86,000.00 2,39,16,000.00
Operating profit 2,40,78,000.00 4,87,86,000.00 2,39,16,000.00
Net profit (1,37,50,000.00) (4,13,93,000.00) (3,09,89,000.00)
Inventory
Current assets 6,11,22,000.00 3,49,48,000.00 2,59,01,000.00
Receivables
Current
liabilities 24,37,66,000.00 27,64,92,000.00 22,31,94,000.00
Payables
Equity 7,91,75,000.00 8,00,25,000.00 12,01,83,000.00
Total liabilities 24,37,66,000.00 27,64,92,000.00 22,31,94,000.00
Total assets 32,29,41,000.00 35,65,17,000.00 34,33,77,000.00
Description Formula National Takaful Co
2016 2015 2014
Profitability
Net margin
Net
profit/revenues -14.97% -25.82% -39.53%
Return on
equity
Net
profit/Equity -17.37% -51.73% -25.78%
Liquidity
Current ratio
Current
assets/current
liabilities 0.25 0.13 0.12
Quick Ratio
Current assets-
Inventory/curr
ent liabilities 0.25 0.13 0.12
Solvency
Debt to Equity
Ratio Debt/ Equity 3.08 3.46 1.86
Debt to assets
Debt/ Total
assets 0.75 0.78 0.65
DuPont Model:
11
2,40,78,000.00 4,87,86,000.00 2,39,16,000.00
Operating profit 2,40,78,000.00 4,87,86,000.00 2,39,16,000.00
Net profit (1,37,50,000.00) (4,13,93,000.00) (3,09,89,000.00)
Inventory
Current assets 6,11,22,000.00 3,49,48,000.00 2,59,01,000.00
Receivables
Current
liabilities 24,37,66,000.00 27,64,92,000.00 22,31,94,000.00
Payables
Equity 7,91,75,000.00 8,00,25,000.00 12,01,83,000.00
Total liabilities 24,37,66,000.00 27,64,92,000.00 22,31,94,000.00
Total assets 32,29,41,000.00 35,65,17,000.00 34,33,77,000.00
Description Formula National Takaful Co
2016 2015 2014
Profitability
Net margin
Net
profit/revenues -14.97% -25.82% -39.53%
Return on
equity
Net
profit/Equity -17.37% -51.73% -25.78%
Liquidity
Current ratio
Current
assets/current
liabilities 0.25 0.13 0.12
Quick Ratio
Current assets-
Inventory/curr
ent liabilities 0.25 0.13 0.12
Solvency
Debt to Equity
Ratio Debt/ Equity 3.08 3.46 1.86
Debt to assets
Debt/ Total
assets 0.75 0.78 0.65
DuPont Model:
Financial Statement analysis
12
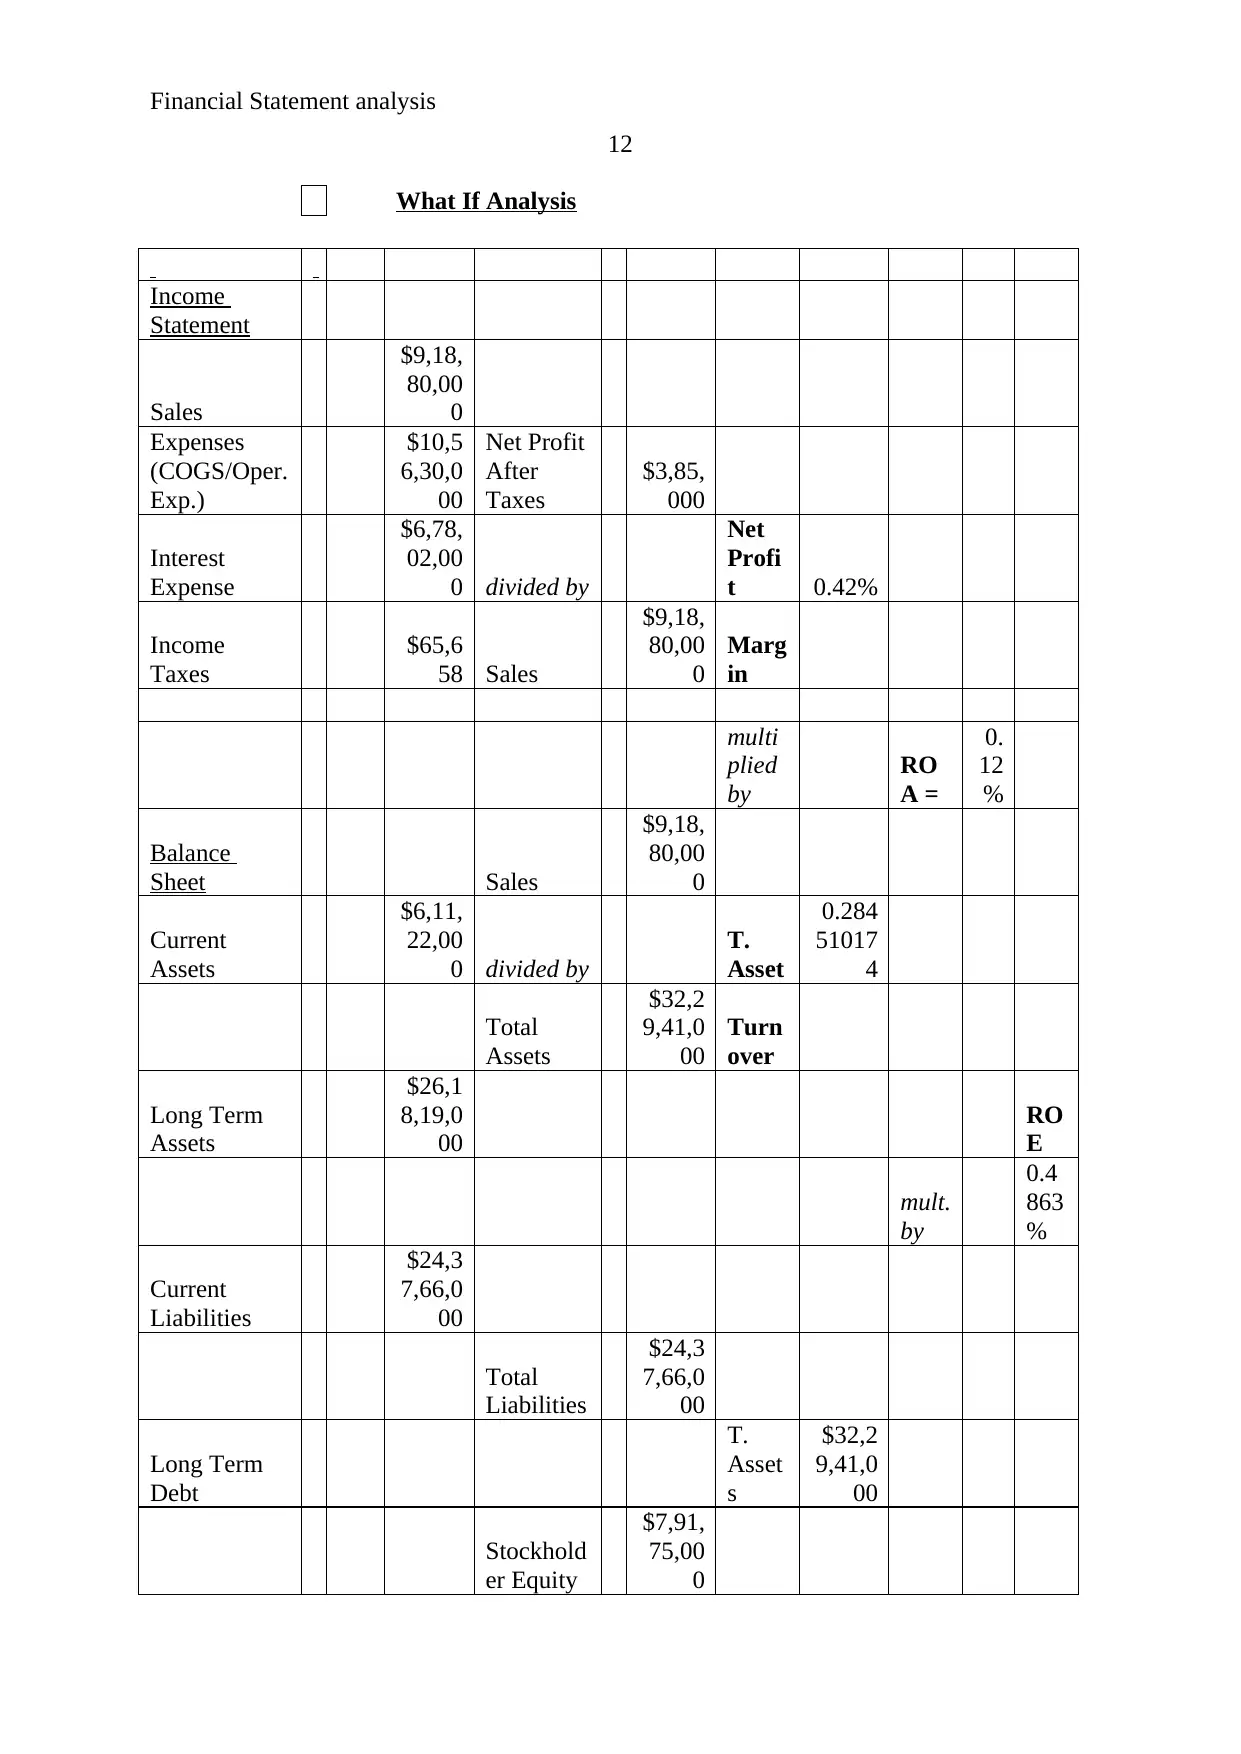
What If Analysis
Income
Statement
Sales
$9,18,
80,00
0
Expenses
(COGS/Oper.
Exp.)
$10,5
6,30,0
00
Net Profit
After
Taxes
$3,85,
000
Interest
Expense
$6,78,
02,00
0 divided by
Net
Profi
t 0.42%
Income
Taxes
$65,6
58 Sales
$9,18,
80,00
0
Marg
in
multi
plied
by
RO
A =
0.
12
%
Balance
Sheet Sales
$9,18,
80,00
0
Current
Assets
$6,11,
22,00
0 divided by
T.
Asset
0.284
51017
4
Total
Assets
$32,2
9,41,0
00
Turn
over
Long Term
Assets
$26,1
8,19,0
00
RO
E
mult.
by
0.4
863
%
Current
Liabilities
$24,3
7,66,0
00
Total
Liabilities
$24,3
7,66,0
00
Long Term
Debt
T.
Asset
s
$32,2
9,41,0
00
Stockhold
er Equity
$7,91,
75,00
0
12
What If Analysis
Income
Statement
Sales
$9,18,
80,00
0
Expenses
(COGS/Oper.
Exp.)
$10,5
6,30,0
00
Net Profit
After
Taxes
$3,85,
000
Interest
Expense
$6,78,
02,00
0 divided by
Net
Profi
t 0.42%
Income
Taxes
$65,6
58 Sales
$9,18,
80,00
0
Marg
in
multi
plied
by
RO
A =
0.
12
%
Balance
Sheet Sales
$9,18,
80,00
0
Current
Assets
$6,11,
22,00
0 divided by
T.
Asset
0.284
51017
4
Total
Assets
$32,2
9,41,0
00
Turn
over
Long Term
Assets
$26,1
8,19,0
00
RO
E
mult.
by
0.4
863
%
Current
Liabilities
$24,3
7,66,0
00
Total
Liabilities
$24,3
7,66,0
00
Long Term
Debt
T.
Asset
s
$32,2
9,41,0
00
Stockhold
er Equity
$7,91,
75,00
0
⊘ This is a preview!⊘
Do you want full access?
Subscribe today to unlock all pages.
Trusted by 1+ million students worldwide
1 out of 16
Related Documents


Your All-in-One AI-Powered Toolkit for Academic Success.
+13062052269
info@desklib.com
Available 24*7 on WhatsApp / Email
![[object Object]](/_next/static/media/star-bottom.7253800d.svg)
Unlock your academic potential
Copyright © 2020–2026 A2Z Services. All Rights Reserved. Developed and managed by ZUCOL.