Evidence Base for Natural Capital Risks in Australian Wheat Farms
VerifiedAdded on 2022/10/13
|24
|9981
|360
Report
AI Summary
This report delves into the critical connection between natural capital and financial risk in the context of Australian wheat farming. It highlights the agricultural sector's significant dependence on natural capital, such as soil health and water resources, and how lenders are exposed to related risks through loans to farmers. The study emphasizes the limitations of traditional credit risk assessment methods, which primarily rely on historical financial data and often overlook environmental factors. It provides an evidence base to support natural capital risk assessment for Australian wheat farming, acknowledging the complexity and interconnectedness of natural capital processes, particularly concerning soil health. The research outlines a methodology for identifying key environmental risks and dependencies, and it offers insights into how these risks can be assessed, mitigated, and monitored by financial institutions. The study contributes to the broader discussion on sustainable lending and the integration of environmental considerations into financial decision-making, especially within the Australian agricultural sector. The report also reviews the relevant literature on environmental credit risk assessment, noting the scarcity of research in the context of smaller-scale loans and specific agricultural sub-sectors.
Developing an evidence base for assessing natural
capital risks and dependencies in lending to Australian
wheat farms
Abstract:
Farmers are highly dependent on stocks of natural capital, and lenders are in turn exposed to
natural capital through their loans to farmers. However, the traditional process for assessing a
farmer’s credit risk relies primarily on historical financial data. Banks’ consideration of
environmental factors tends to be limited to major risks such as contaminated land liabilities,
and to large project and corporate finance, as opposed to the smaller loans typical of the
Australian agricultural sector. The relevant risks and dependencies for agriculture vary by sub-
sector and geography, and there is a lack of standardized methodologies and evidence to
support risk assessment. We provide an evidence base to support natural capital risk
assessment for a single sub-sector of Australian agriculture – wheat farming. We show that
such an assessment is possible, with a combination of quantitative and qualitative inputs, but
the complexity and interconnectedness of natural capital processes is a challenge, particularly
for soil health.
Key Words:
Natural capital; environmental risk; environmental credit risk assessment; responsible lending;
wheat farming; Australia
Acknowledgements:
This work was supported by the Australian Commonwealth Department of Infrastructure and
Rural Development under the Sense-T “Sensing Natural Capital” project. We thank the project’s
industry partners, National Australia Bank (NAB) and the Climate Disclosure Standards Board
(CDSB) for their support.
Paraphrase This Document
Need a fresh take? Get an instant paraphrase of this document with our AI Paraphraser
2
1 Introduction
Agriculture is a small but important part of the Australian economy, accounting for 7% (by
value) of total exports in 2014-15 (ABS 2016a), and contributing as much as 12% of Australia’s
GDP, when including the value of associated pre- and post-farm production activities (NFF
2012). Farmers own or manage 61% of Australia’s land (NFF 2012) and therefore play a key role
in managing Australia’s stocks of natural capital, or “those elements of nature which either
directly provide benefits or underpin human wellbeing” (Natural Capital Committee 2013, 11).
Farmers all over the world are highly dependent on environmental factors such as rainfall,
temperature and climate, as well as natural capital stocks such as energy, mineral and water
resources, productive soils and ecosystems. Australia’s aridity (70% of mainland Australia
receives less than 500mm of rain per year – Geoscience Australia 2016) and generally poor soils
means that Australian agriculture is particularly vulnerable to variability and extreme
conditions. For example, widespread drought in 2002-03 led to a 41% reduction in agricultural
income, reducing Australia’s GDP by around 1% in that year (Lu and Hedley 2004).
99% of the 134,000 farm businesses operating in Australia in 2012 were family owned (NFF
2012), with on average 85% of business equity being held by the operator and close relatives or
business partners (ABARES 2016). The remaining 15% takes the form of debt, including short-
term unsecured debt such as credit cards; equipment supplier finance; and formal secured
loans, usually from one of the small number of Australian banks with extensive rural networks.
Through these loans, which are typically used either to fund land or machinery purchases, or to
provide working capital to bridge temporary income-cost mismatches, these banks are exposed
to a range of natural capital and environmental risks and dependencies. The traditional process
for assessing a farmer’s credit risk, however, relies primary on historical financial data, which
only indirectly and incompletely reflects these risks and dependencies.
In 2012, around 40 international financial institutions signed the Natural Capital Declaration
(NCD), committing to integrate natural capital considerations into their financial products, and
their accounting and reporting frameworks, by 2020. 1 A pilot study (Cojoianu et al. 2015) found
that 42% of financial institutions claim to be already integrating natural capital risks in credit
risk assessments. However, the evidence to date suggests that this is limited to large (over
US$10 million) project finance deals and even larger corporate loans, and is virtually non-
existent for smaller secured loans typical of the Australian agricultural sector. A key challenge
for agriculture is the fact that the relevant risks and dependencies vary by sub-sector and in
some cases by individual crop or animal production system, as well as by geography. Other
difficulties include lack of awareness around natural capital issues, the vagueness of regulatory
1 http://www.naturalcapitalfinancealliance.org/about-the-natural-capital-declaration/ (accessed 26 October 2016).
3
requirements around natural capital issues, the challenge of relating long-term issues to short-
term materiality, and most importantly, lack of standardized industry- and geography-specific
methodologies and robust information for the quantification of natural capital risks (Cojoianu
et al. 2015). Our paper therefore aims to help address these challenges by developing an
evidence base to support natural capital credit risk assessment for a single sub-sector of
Australian agriculture – wheat farming, which contributed over A$7 billion or 13% of Australia’s
total value of agricultural production in 2015, second only to cattle grazing (ABS 2016b).
The paper is structured as follows. In section 2, we review the literature on environmental
credit risk assessment. Section 3 outlines our methodology for identifying key environmental
and natural capital risks and dependencies, and section 4 sets out our findings for the
Australian wheat sector, explaining why each risk is material, how it can be mitigated, and how
a bank could assess and monitor the risk. Finally, section 5 discusses the overall findings that
emerged from this analysis.
2 Environmental credit risk assessment
The literature on sustainability in the banking sector can be divided into two broad groups
(Zeidan et al., 2015): one dealing with external practices (which include banks’ communications
with shareholders and stakeholders around sustainability issues) and the other with internal
practices (which include how sustainability issues are incorporated into risk management
models and lending or investment decisions). Our paper contributes to the latter.
Within this strand of the literature there are two main areas of focus. The first considers how
environmental performance influences the perceived credit risk and cost of debt of companies,
with most studies finding that firms with better sustainability performance ratings experience a
lower cost of debt, and vice versa (Bauer & Hann 2010; Nandy & Lodh 2012). Most studies focus
on public companies in developed countries (although Weber, Hoque, and Ayub Islam (2015)
provide evidence linking sustainability criteria to loan default probability in a developing
country, while noting that sustainability criteria are not yet being used by lenders there), and
on major risks such as hazardous chemicals, substantial emissions and climate change
(Schneider 2011; Chava 2014). Most papers also focus on large-scale corporate loans and bond
finance, rather than smaller loans to privately held companies and SMEs, where data on
sustainability as well as financial issues is much scarcer and opaque (Berger and Udell 1998).
There is, to the best of our knowledge, no peer-reviewed research demonstrating a clear link
between environmental performance at this smaller scale, and the availability, terms or cost of
bank loans. Nevertheless, from our discussions with Australian banking officials it appears that
at least some banks are operating on the assumption that there is such a link:
⊘ This is a preview!⊘
Do you want full access?
Subscribe today to unlock all pages.
Trusted by 1+ million students worldwide
4
“I guess, you know, there’s an assumption that we’ve made, that seems to be validated
by numerous case studies, that our more productive agribusiness customers are those
who manage their environmental resources better, and they seem to be one and the
same thing.” (Environmental finance professional, August 6, 2015).
The second area concerns the extent to which banks incorporate sustainability criteria in their
lending decision-making. It is generally agreed that banks have been incorporating some
environmental risks into their credit assessment processes, since the early 1990s (Weber,
Fenchel, & Scholz 2008). This was originally driven by legislation, such as the Comprehensive
Environmental Response, Compensation and Liability Act 1980 in the United States, which
imposed remediation liabilities on the owners of contaminated sites. As a result, early
environmental credit risk assessments tended to focus only on such specific liabilities, rather
than providing a comprehensive framework for the assessment of all potentially material
environmental (and social) risks, dependencies and opportunities. In the mid-2000s, Weber,
Fenchel, & Scholz (2008) identified only four classes of environmental risk being considered by
banks: contamination liabilities; impacts of mandatory environmental regulations; changes in
buyer/consumer attitudes; and reputational risk due to being associated with projects seen as
environmentally or socially damaging by stakeholders. Furthermore, they found that most
attention was given to environmental issues in the rating (or risk identification) phase of the
credit management process, least in the costing (or risk evaluation) phase and an intermediate
level in the monitoring (or risk controlling) phases.
A recent survey of 36 financial institutions and 26 financial research providers undertaken for
the NCD (Cojoianu et al. 2015) found that although 42% of respondents claim to consider
natural capital risks in their credit risk assessment, there is no evidence that this is done
systematically. Lenders cited numerous difficulties in assessing natural capital risks including
the lack of suitable contextual methodologies, data, budgets and capacity. Currently, only
project finance transactions and related services can be benchmarked to an international
standard of environmental and social due diligence: the Equator Principles, which are applied
only to projects over US$10 million, or US$100 million for corporate loans.
The aforementioned body of research on sustainability performance and perceived credit risk
of borrowers goes some way toward explaining why banks might seek to incorporate
environmental risks and dependencies in their credit assessment processes. As Weber, Hoque,
and Ayub Islam (2015, 3) observe, “The rationale for using sustainability indicators for
predicting credit risks is based on the idea that good sustainability performance mitigates risks
arising through environmental and social impacts as well as through and stakeholder pressure
and regulation.” However, while high-level sustainability indicators may be available for larger
companies, usually based on research providers’ analysis of annual and sustainability reports,
Paraphrase This Document
Need a fresh take? Get an instant paraphrase of this document with our AI Paraphraser
5
they are typically not applicable to smaller-scale loans such as those typical in the Australian
agricultural sector.
Very little research has been published on the incorporation of environmental risks and
dependencies into credit assessment for smaller-scale loans in any sector, or for any scale of
loans in agriculture in particular. A search across all academic databases subscribed to by the
University of Oxford using the keywords ‘environmental’, ‘credit’, ‘risk’ and ‘agriculture’ yielded
only 80 results, only a few of which were found to be relevant. For example, Georgopoulou et
al. (2015) develop a framework to assess the risk of climate change to lending across several
Greek industries, including wheat farming, using the loan portfolio of a Greek bank as a case
study. The authors use climate and agronomic modelling to make the case for materiality of
climate change to the agriculture sector, and conclude that the physical risks from climate
change to Greek crop farms are between 7.4-12.4% of their annual turnover. However, they do
not provide an evidence base for the assessment of more granular risk factors (e.g. rainfall
availability), but rather rely on a generic crop yield simulation model. The emphasis is on
calculation of portfolio-level exposure to systemic risks, as opposed to individual loan
assessment. Similarly, Do et al. (2016) find evidence that banks are considering drought risk at a
systemic level, increasing loan interest rates to large agricultural enterprises by up to 6 basis
points for every step increase in regional drought level in the 12 months prior to loan
origination. Zeidan et al. (2015) propose a sustainability credit score system for the sugar
industry in Brazil, based on six dimensions: economic growth, environmental protection, social
progress, socio-economic development, eco-efficiency and socio-environmental development.
Whilst taking a higher-level sustainability focus, this study is the most complementary to our
own in terms providing a basis for the evaluation of such risks for a specific sector and country.
In summary, there is an almost complete absence in the literature of detailed assessments of
how environmental and natural capital risks can be identified and included in the credit risk
assessment process for smaller-scale (e.g. US$0.5-2 million) bank loans. This is true across
industries, and for agriculture in particular. Our paper complements the top-down approach
taken by Zeidan et al. (2015) by developing a bottom-up, robust evidence base on why and how
different natural capital risks and dependencies are likely to affect the financial performance of
wheat farms in Australia, how these risks can be managed, and how the resultant managed risk
can be assessed by a lender.
3 Methodology
We followed a multi-stage approach to identifying, prioritizing and researching the natural
capital risks and dependencies applicable to Australian wheat farm lending, from a lender’s
perspective. First, we searched the publicly available environmental risk methodologies of 66
financial research providers and consultants identified by Cojoianu et al. (2015) for
6
environmental risk factors specifically relevant to the agricultural sector. As we found that
coverage of agriculture was limited to just nine research providers, we also conducted a desk
review of 34 publications from financial institutions related to environmental risks, published
between 2006 and 2016, to identify high level environmental risk factors which were
considered to be material across a broad range of industries. Those most applicable to
agriculture are listed in Table 1 below.
The next step was to determine which of these risks were of most importance for wheat
farming, in the Australian context in particular. To do this we triangulated evidence from three
different sources: a review of 39 relevant academic papers shortlisted from a set of 974 papers
containing the keywords ‘wheat’, ‘Australia’ and ‘yield’ in the Scopus database; a review of
online publications from Australian industry-specific bodies (such as the Grains Research and
Development Corporation, GRDC) and relevant government agencies; and a set of four
interviews with Australian agribusiness professionals, credit managers and environmental
finance professionals. Typically, industry body publications proved the most useful in
demonstrating the materiality of specific environmental risks to the wheat industry, given their
focus and access to information specific to the Australian context.
A risk was considered material if it was clearly capable of being a significant determinant of
either yields, prices or costs, either in the short- or long-term. It was not practicable to set
quantitative thresholds for significance, but where possible we have provided quantitative
evidence in support of our judgment. We consider historical average conditions to be the
baseline: a risk is therefore only significant if it results in a deviation (in a negative direction)
from this baseline, either in the short- or long-term. It should be noted that risk is the product
of the probability of occurrence and the magnitude of impact, and it is therefore appropriate to
include some factors which are low impact but high probability, and vice versa. In addition,
some factors have been included on the basis of externalities which are currently not fully
priced, but which may become more appropriately priced in the medium to long term.
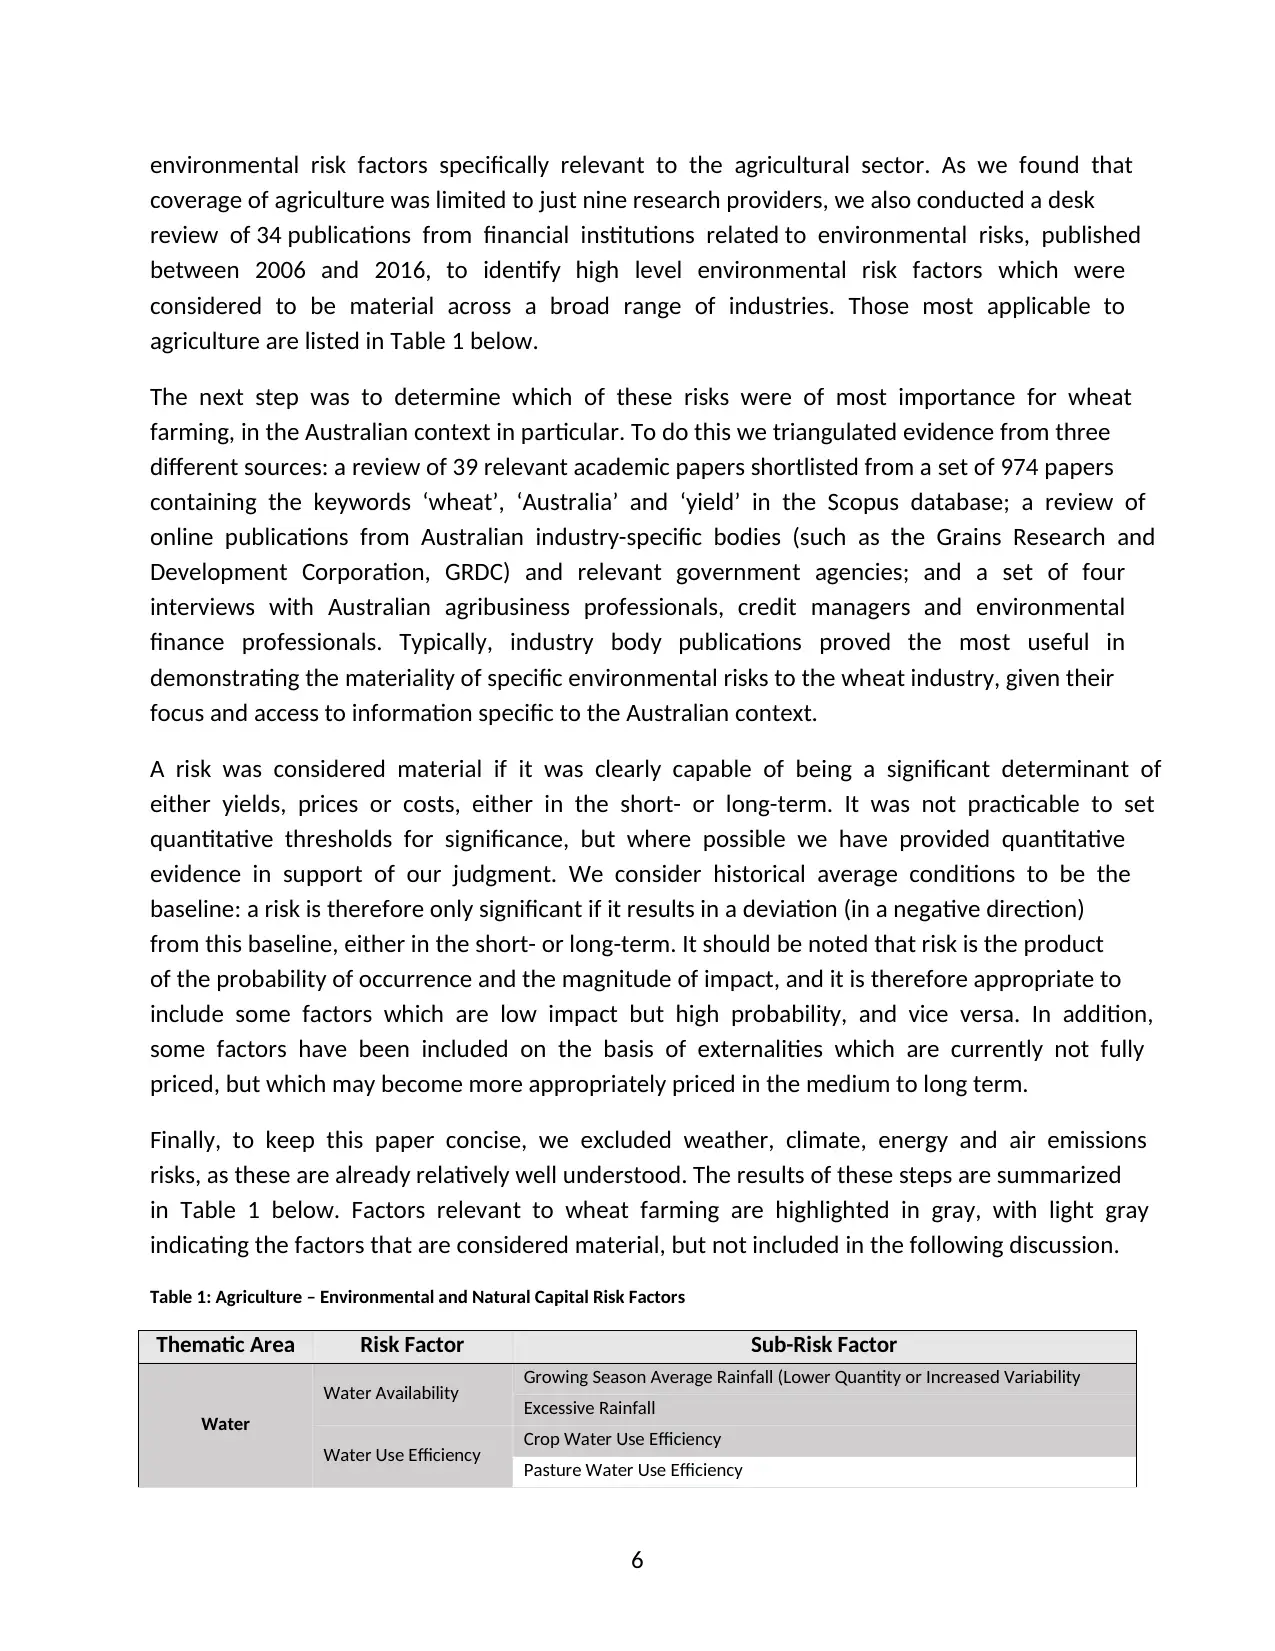
Finally, to keep this paper concise, we excluded weather, climate, energy and air emissions
risks, as these are already relatively well understood. The results of these steps are summarized
in Table 1 below. Factors relevant to wheat farming are highlighted in gray, with light gray
indicating the factors that are considered material, but not included in the following discussion.
Table 1: Agriculture – Environmental and Natural Capital Risk Factors
Thematic Area Risk Factor Sub-Risk Factor
Water
Water Availability Growing Season Average Rainfall (Lower Quantity or Increased Variability
Excessive Rainfall
Water Use Efficiency Crop Water Use Efficiency
Pasture Water Use Efficiency
environmental risk factors specifically relevant to the agricultural sector. As we found that
coverage of agriculture was limited to just nine research providers, we also conducted a desk
review of 34 publications from financial institutions related to environmental risks, published
between 2006 and 2016, to identify high level environmental risk factors which were
considered to be material across a broad range of industries. Those most applicable to
agriculture are listed in Table 1 below.
The next step was to determine which of these risks were of most importance for wheat
farming, in the Australian context in particular. To do this we triangulated evidence from three
different sources: a review of 39 relevant academic papers shortlisted from a set of 974 papers
containing the keywords ‘wheat’, ‘Australia’ and ‘yield’ in the Scopus database; a review of
online publications from Australian industry-specific bodies (such as the Grains Research and
Development Corporation, GRDC) and relevant government agencies; and a set of four
interviews with Australian agribusiness professionals, credit managers and environmental
finance professionals. Typically, industry body publications proved the most useful in
demonstrating the materiality of specific environmental risks to the wheat industry, given their
focus and access to information specific to the Australian context.
A risk was considered material if it was clearly capable of being a significant determinant of
either yields, prices or costs, either in the short- or long-term. It was not practicable to set
quantitative thresholds for significance, but where possible we have provided quantitative
evidence in support of our judgment. We consider historical average conditions to be the
baseline: a risk is therefore only significant if it results in a deviation (in a negative direction)
from this baseline, either in the short- or long-term. It should be noted that risk is the product
of the probability of occurrence and the magnitude of impact, and it is therefore appropriate to
include some factors which are low impact but high probability, and vice versa. In addition,
some factors have been included on the basis of externalities which are currently not fully
priced, but which may become more appropriately priced in the medium to long term.
Finally, to keep this paper concise, we excluded weather, climate, energy and air emissions
risks, as these are already relatively well understood. The results of these steps are summarized
in Table 1 below. Factors relevant to wheat farming are highlighted in gray, with light gray
indicating the factors that are considered material, but not included in the following discussion.
Table 1: Agriculture – Environmental and Natural Capital Risk Factors
Thematic Area Risk Factor Sub-Risk Factor
Water
Water Availability Growing Season Average Rainfall (Lower Quantity or Increased Variability
Excessive Rainfall
Water Use Efficiency Crop Water Use Efficiency
Pasture Water Use Efficiency
⊘ This is a preview!⊘
Do you want full access?
Subscribe today to unlock all pages.
Trusted by 1+ million students worldwide
7
Animal Stock Watering Efficiency
Farm Water Use Efficiency
Water Rights Quantity
Price
Irrigation Technology Failure
Water Quality
Salinity Management
Water Contamination
Water Acidity
Weather and
Climate
Heat Stress
Frost Damage
Extreme Weather Events
Land Use and
Pollution
Fertiliser Use
Quantity
Price
Run-Off
Appropriate Application
Soil Organic Carbon
Soil Erosion Water Erosion
Wind Erosion
Soil Acidification
Soil Salinity
Soil Compaction
Organic Contaminants
Heavy Metals
Waste Management
Biodiversity and
Ecosystems
GMO Contamination
Pests and Diseases
Weeds
Biodiversity
Livestock Health/Animal Welfare
Pasture Cover and Composition
Energy Use On-Farm Energy Use
Fertiliser Production and Transport Energy Use
Air Emissions
Carbon Dioxide
Energy Use Emissions
Fertiliser Production and Transport Energy Emissions
Direct Land Use Change Emissions
Methane Enteric Fermentation Emissions
Manure Management Emissions
Nitrous Oxide Fertiliser Application Emissions
F-gases (Hydrofluorocarbons, Perfluorocarbons and Sulfur Hexafluoride)
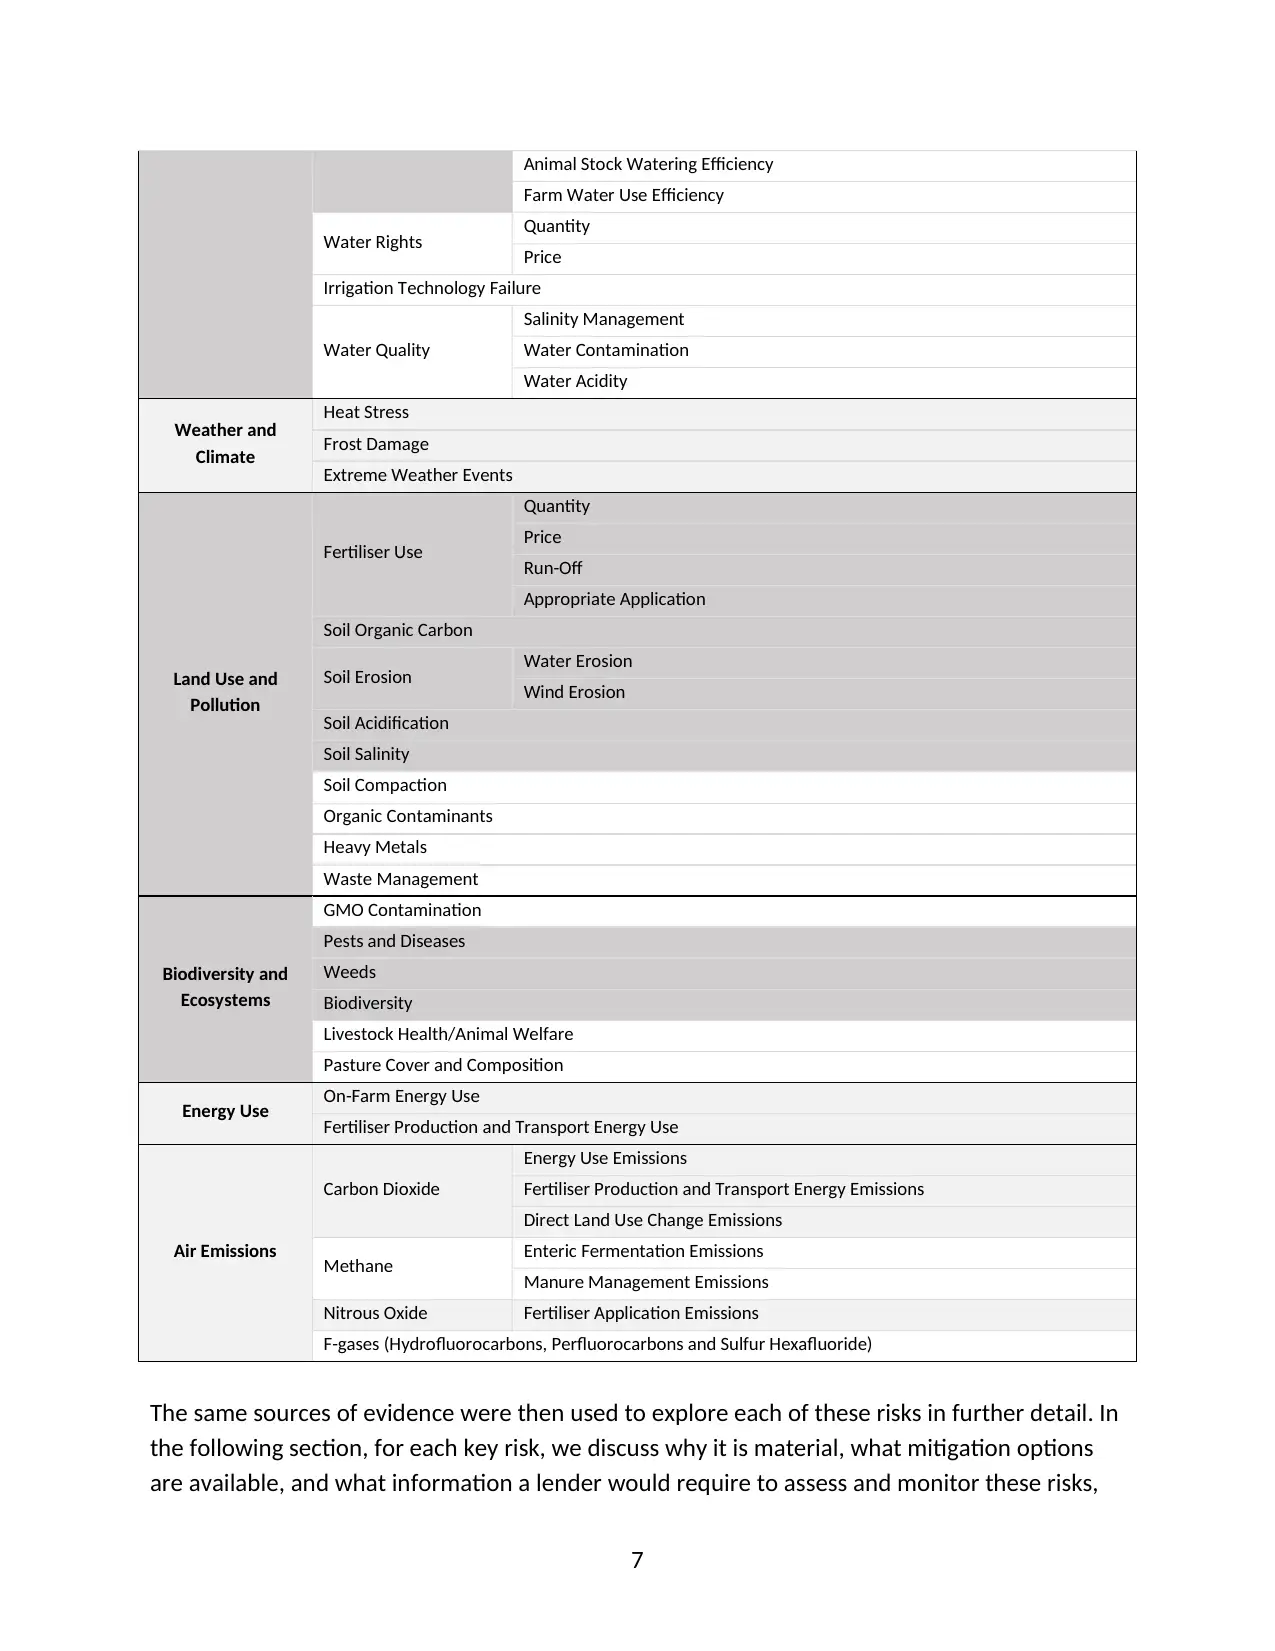
The same sources of evidence were then used to explore each of these risks in further detail. In
the following section, for each key risk, we discuss why it is material, what mitigation options
are available, and what information a lender would require to assess and monitor these risks,
Animal Stock Watering Efficiency
Farm Water Use Efficiency
Water Rights Quantity
Price
Irrigation Technology Failure
Water Quality
Salinity Management
Water Contamination
Water Acidity
Weather and
Climate
Heat Stress
Frost Damage
Extreme Weather Events
Land Use and
Pollution
Fertiliser Use
Quantity
Price
Run-Off
Appropriate Application
Soil Organic Carbon
Soil Erosion Water Erosion
Wind Erosion
Soil Acidification
Soil Salinity
Soil Compaction
Organic Contaminants
Heavy Metals
Waste Management
Biodiversity and
Ecosystems
GMO Contamination
Pests and Diseases
Weeds
Biodiversity
Livestock Health/Animal Welfare
Pasture Cover and Composition
Energy Use On-Farm Energy Use
Fertiliser Production and Transport Energy Use
Air Emissions
Carbon Dioxide
Energy Use Emissions
Fertiliser Production and Transport Energy Emissions
Direct Land Use Change Emissions
Methane Enteric Fermentation Emissions
Manure Management Emissions
Nitrous Oxide Fertiliser Application Emissions
F-gases (Hydrofluorocarbons, Perfluorocarbons and Sulfur Hexafluoride)
The same sources of evidence were then used to explore each of these risks in further detail. In
the following section, for each key risk, we discuss why it is material, what mitigation options
are available, and what information a lender would require to assess and monitor these risks,
Paraphrase This Document
Need a fresh take? Get an instant paraphrase of this document with our AI Paraphraser
8
either quantitatively or qualitatively. The key risks identified for wheat can, for ease of
discussion, be grouped into the following headings: water; fertiliser use; soil health; pests,
diseases and weeds, and biodiversity.
Hoepner et al. (2014) point out that banks can adopt two different approaches to assess the
credit-worthiness of a borrower. The first is the traditional approach to credit risk assessments
or ‘transaction-based banking’, which is based on quantitative and easily verifiable information,
predominantly financial metrics. The second is ‘relationship banking’, in which lending decisions
are based on intangible factors which are harder to quantify, often collected manually and
difficult to verify (e.g. managerial competence). The authors highlight a growing body of
literature showing that the use of intangible information in tandem with financial metrics can
lead to better credit risk assessments than those based only on financial factors. Hence we have
considered both quantitative and qualitative information that could contribute to assessing
each risk.
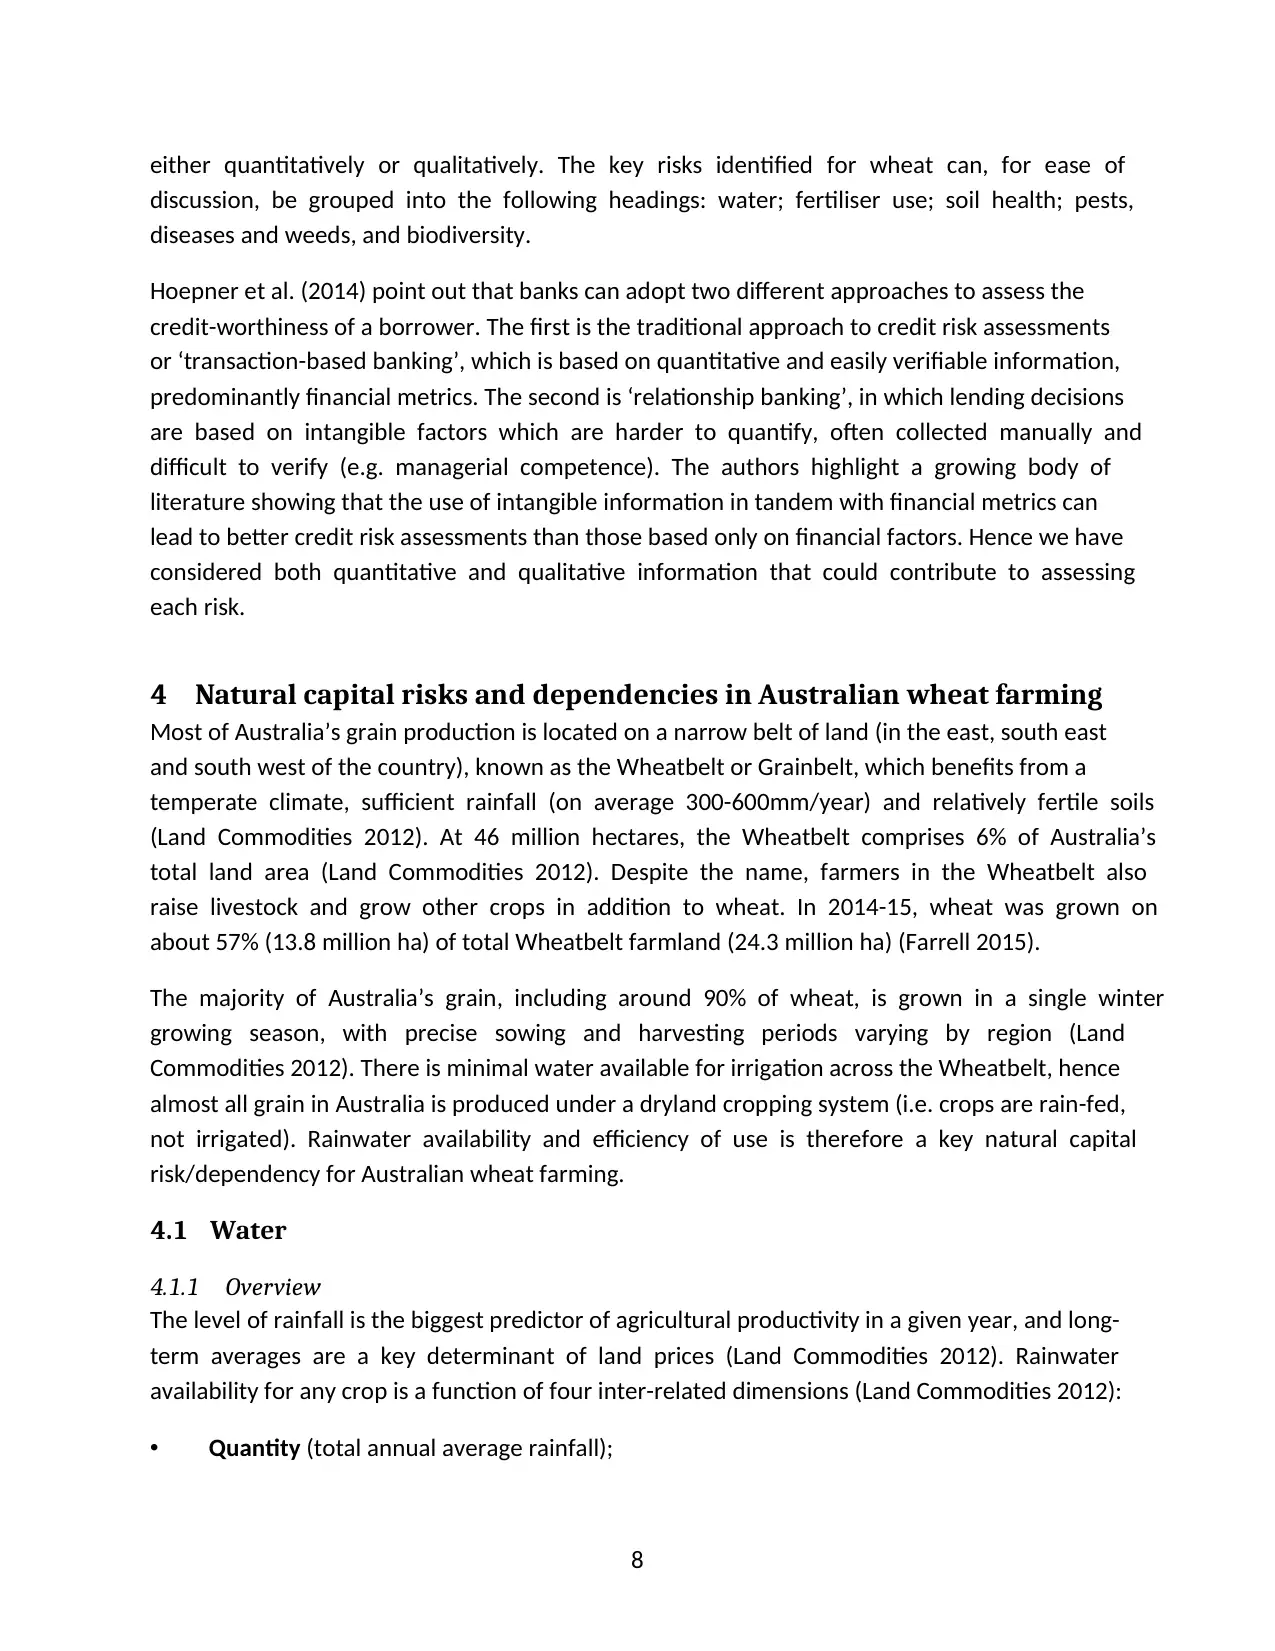
4 Natural capital risks and dependencies in Australian wheat farming
Most of Australia’s grain production is located on a narrow belt of land (in the east, south east
and south west of the country), known as the Wheatbelt or Grainbelt, which benefits from a
temperate climate, sufficient rainfall (on average 300-600mm/year) and relatively fertile soils
(Land Commodities 2012). At 46 million hectares, the Wheatbelt comprises 6% of Australia’s
total land area (Land Commodities 2012). Despite the name, farmers in the Wheatbelt also
raise livestock and grow other crops in addition to wheat. In 2014-15, wheat was grown on
about 57% (13.8 million ha) of total Wheatbelt farmland (24.3 million ha) (Farrell 2015).
The majority of Australia’s grain, including around 90% of wheat, is grown in a single winter
growing season, with precise sowing and harvesting periods varying by region (Land
Commodities 2012). There is minimal water available for irrigation across the Wheatbelt, hence
almost all grain in Australia is produced under a dryland cropping system (i.e. crops are rain-fed,
not irrigated). Rainwater availability and efficiency of use is therefore a key natural capital
risk/dependency for Australian wheat farming.
4.1 Water
4.1.1 Overview
The level of rainfall is the biggest predictor of agricultural productivity in a given year, and long-
term averages are a key determinant of land prices (Land Commodities 2012). Rainwater
availability for any crop is a function of four inter-related dimensions (Land Commodities 2012):
• Quantity (total annual average rainfall);
either quantitatively or qualitatively. The key risks identified for wheat can, for ease of
discussion, be grouped into the following headings: water; fertiliser use; soil health; pests,
diseases and weeds, and biodiversity.
Hoepner et al. (2014) point out that banks can adopt two different approaches to assess the
credit-worthiness of a borrower. The first is the traditional approach to credit risk assessments
or ‘transaction-based banking’, which is based on quantitative and easily verifiable information,
predominantly financial metrics. The second is ‘relationship banking’, in which lending decisions
are based on intangible factors which are harder to quantify, often collected manually and
difficult to verify (e.g. managerial competence). The authors highlight a growing body of
literature showing that the use of intangible information in tandem with financial metrics can
lead to better credit risk assessments than those based only on financial factors. Hence we have
considered both quantitative and qualitative information that could contribute to assessing
each risk.
4 Natural capital risks and dependencies in Australian wheat farming
Most of Australia’s grain production is located on a narrow belt of land (in the east, south east
and south west of the country), known as the Wheatbelt or Grainbelt, which benefits from a
temperate climate, sufficient rainfall (on average 300-600mm/year) and relatively fertile soils
(Land Commodities 2012). At 46 million hectares, the Wheatbelt comprises 6% of Australia’s
total land area (Land Commodities 2012). Despite the name, farmers in the Wheatbelt also
raise livestock and grow other crops in addition to wheat. In 2014-15, wheat was grown on
about 57% (13.8 million ha) of total Wheatbelt farmland (24.3 million ha) (Farrell 2015).
The majority of Australia’s grain, including around 90% of wheat, is grown in a single winter
growing season, with precise sowing and harvesting periods varying by region (Land
Commodities 2012). There is minimal water available for irrigation across the Wheatbelt, hence
almost all grain in Australia is produced under a dryland cropping system (i.e. crops are rain-fed,
not irrigated). Rainwater availability and efficiency of use is therefore a key natural capital
risk/dependency for Australian wheat farming.
4.1 Water
4.1.1 Overview
The level of rainfall is the biggest predictor of agricultural productivity in a given year, and long-
term averages are a key determinant of land prices (Land Commodities 2012). Rainwater
availability for any crop is a function of four inter-related dimensions (Land Commodities 2012):
• Quantity (total annual average rainfall);
9
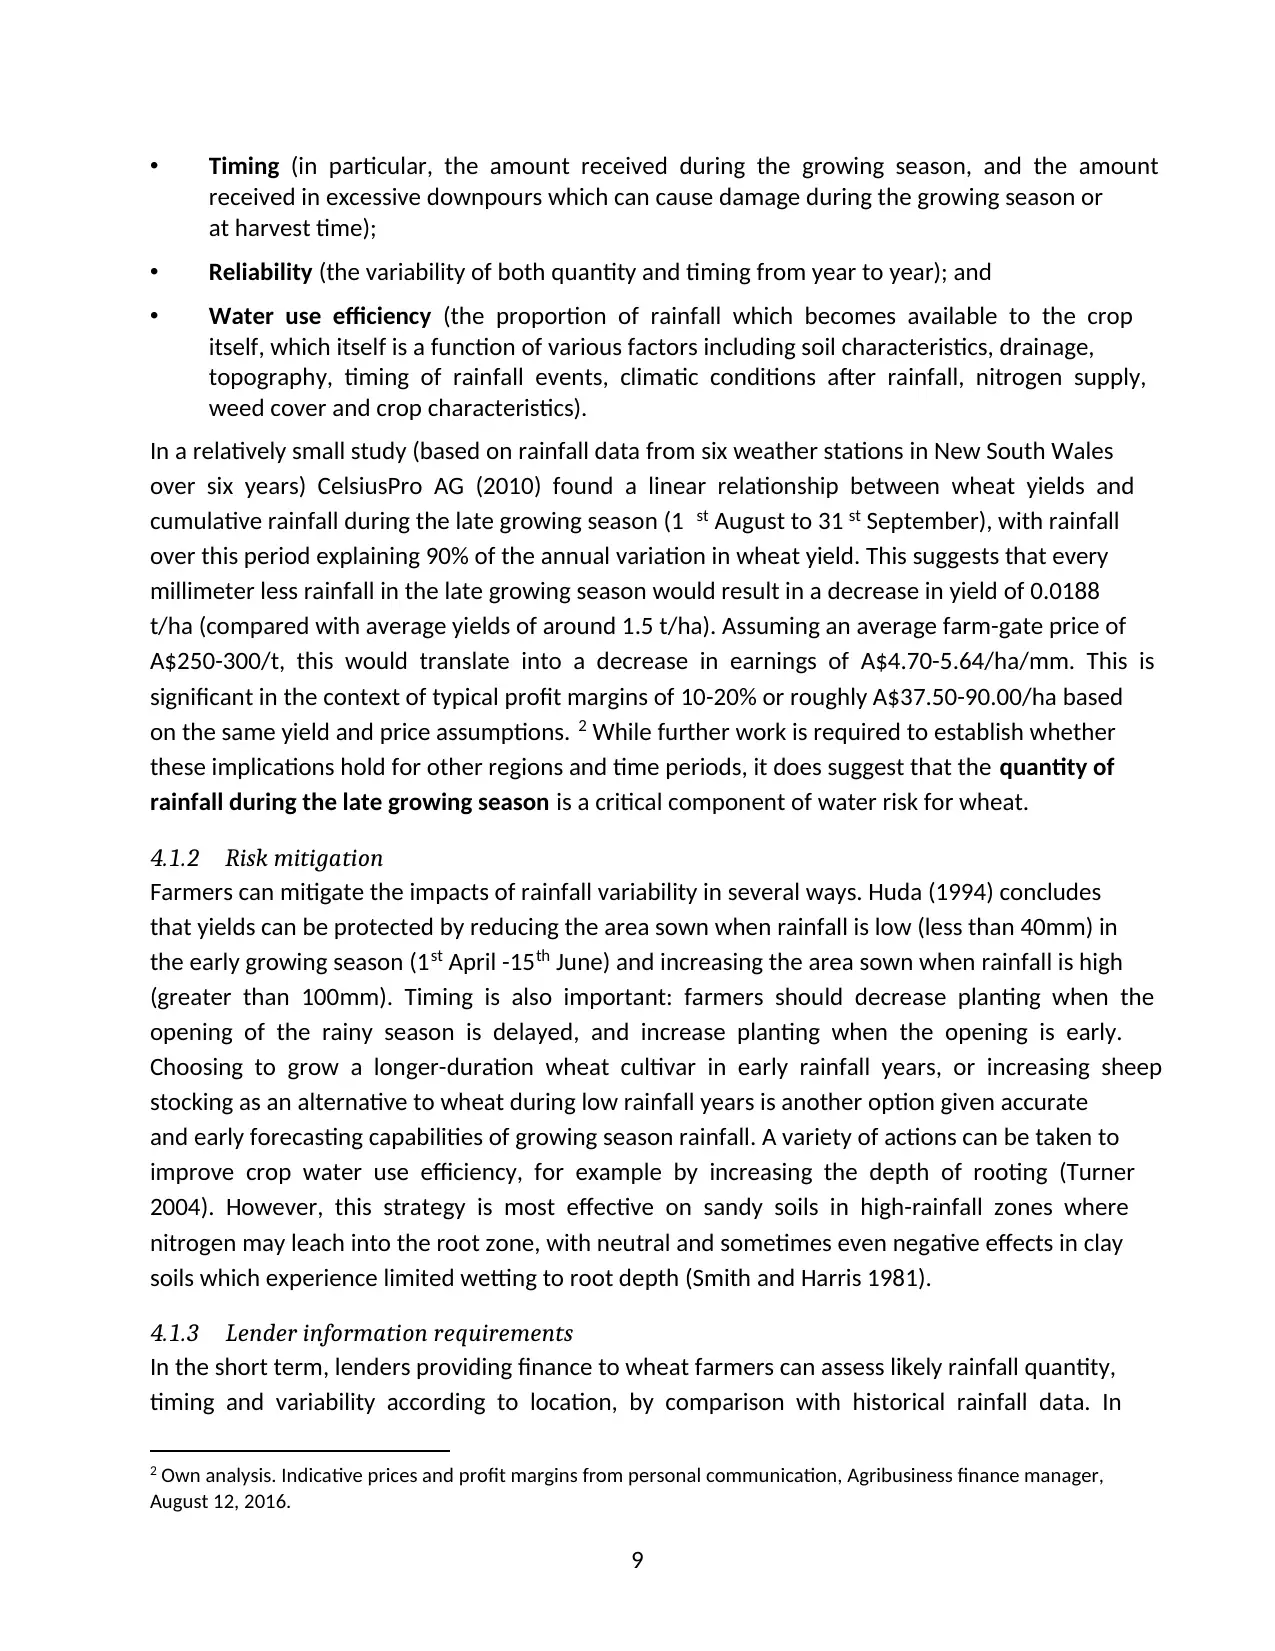
• Timing (in particular, the amount received during the growing season, and the amount
received in excessive downpours which can cause damage during the growing season or
at harvest time);
• Reliability (the variability of both quantity and timing from year to year); and
• Water use efficiency (the proportion of rainfall which becomes available to the crop
itself, which itself is a function of various factors including soil characteristics, drainage,
topography, timing of rainfall events, climatic conditions after rainfall, nitrogen supply,
weed cover and crop characteristics).
In a relatively small study (based on rainfall data from six weather stations in New South Wales
over six years) CelsiusPro AG (2010) found a linear relationship between wheat yields and
cumulative rainfall during the late growing season (1 st August to 31 st September), with rainfall
over this period explaining 90% of the annual variation in wheat yield. This suggests that every
millimeter less rainfall in the late growing season would result in a decrease in yield of 0.0188
t/ha (compared with average yields of around 1.5 t/ha). Assuming an average farm-gate price of
A$250-300/t, this would translate into a decrease in earnings of A$4.70-5.64/ha/mm. This is
significant in the context of typical profit margins of 10-20% or roughly A$37.50-90.00/ha based
on the same yield and price assumptions. 2 While further work is required to establish whether
these implications hold for other regions and time periods, it does suggest that the quantity of
rainfall during the late growing season is a critical component of water risk for wheat.
4.1.2 Risk mitigation
Farmers can mitigate the impacts of rainfall variability in several ways. Huda (1994) concludes
that yields can be protected by reducing the area sown when rainfall is low (less than 40mm) in
the early growing season (1st April -15th June) and increasing the area sown when rainfall is high
(greater than 100mm). Timing is also important: farmers should decrease planting when the
opening of the rainy season is delayed, and increase planting when the opening is early.
Choosing to grow a longer-duration wheat cultivar in early rainfall years, or increasing sheep
stocking as an alternative to wheat during low rainfall years is another option given accurate
and early forecasting capabilities of growing season rainfall. A variety of actions can be taken to
improve crop water use efficiency, for example by increasing the depth of rooting (Turner
2004). However, this strategy is most effective on sandy soils in high-rainfall zones where
nitrogen may leach into the root zone, with neutral and sometimes even negative effects in clay
soils which experience limited wetting to root depth (Smith and Harris 1981).
4.1.3 Lender information requirements
In the short term, lenders providing finance to wheat farmers can assess likely rainfall quantity,
timing and variability according to location, by comparison with historical rainfall data. In
2 Own analysis. Indicative prices and profit margins from personal communication, Agribusiness finance manager,
August 12, 2016.
⊘ This is a preview!⊘
Do you want full access?
Subscribe today to unlock all pages.
Trusted by 1+ million students worldwide
10
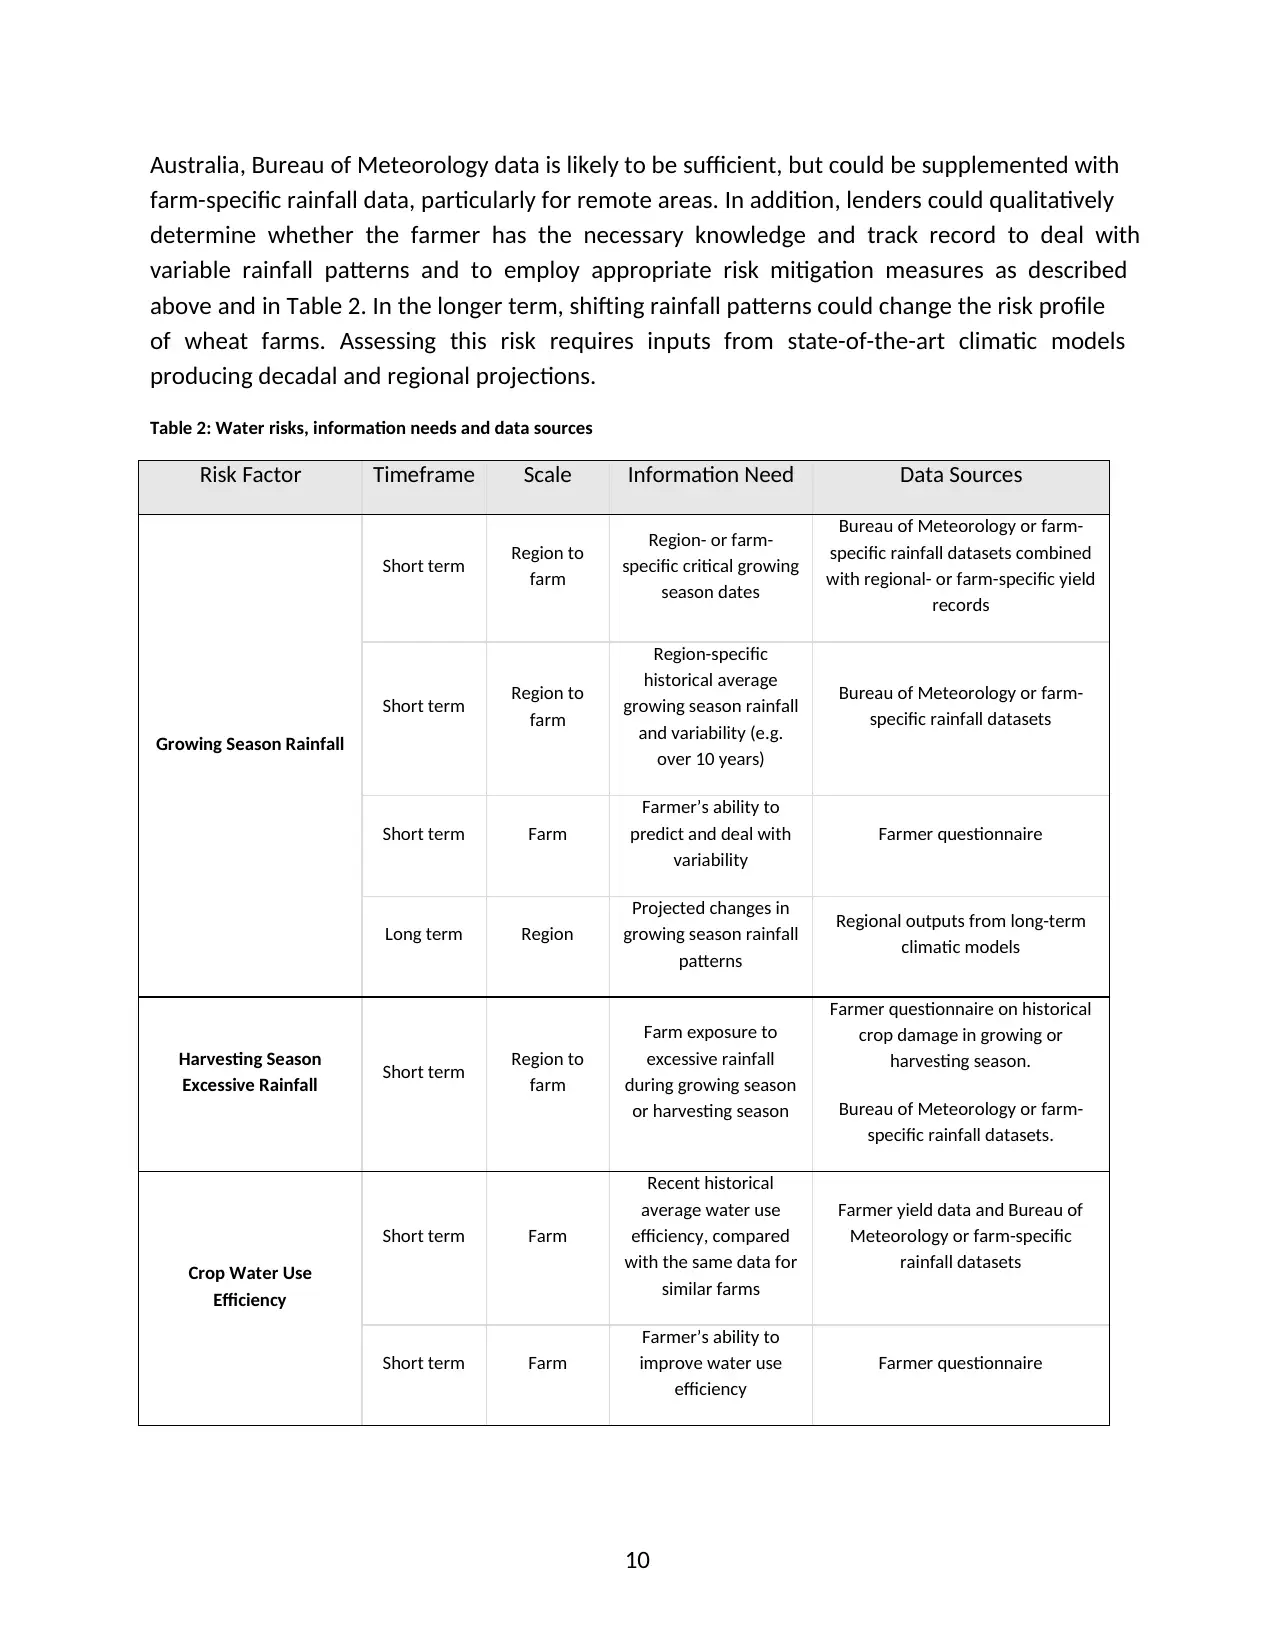
Australia, Bureau of Meteorology data is likely to be sufficient, but could be supplemented with
farm-specific rainfall data, particularly for remote areas. In addition, lenders could qualitatively
determine whether the farmer has the necessary knowledge and track record to deal with
variable rainfall patterns and to employ appropriate risk mitigation measures as described
above and in Table 2. In the longer term, shifting rainfall patterns could change the risk profile
of wheat farms. Assessing this risk requires inputs from state-of-the-art climatic models
producing decadal and regional projections.
Table 2: Water risks, information needs and data sources
Risk Factor Timeframe Scale Information Need Data Sources
Growing Season Rainfall
Short term Region to
farm
Region- or farm-
specific critical growing
season dates
Bureau of Meteorology or farm-
specific rainfall datasets combined
with regional- or farm-specific yield
records
Short term Region to
farm
Region-specific
historical average
growing season rainfall
and variability (e.g.
over 10 years)
Bureau of Meteorology or farm-
specific rainfall datasets
Short term Farm
Farmer’s ability to
predict and deal with
variability
Farmer questionnaire
Long term Region
Projected changes in
growing season rainfall
patterns
Regional outputs from long-term
climatic models
Harvesting Season
Excessive Rainfall Short term Region to
farm
Farm exposure to
excessive rainfall
during growing season
or harvesting season
Farmer questionnaire on historical
crop damage in growing or
harvesting season.
Bureau of Meteorology or farm-
specific rainfall datasets.
Crop Water Use
Efficiency
Short term Farm
Recent historical
average water use
efficiency, compared
with the same data for
similar farms
Farmer yield data and Bureau of
Meteorology or farm-specific
rainfall datasets
Short term Farm
Farmer’s ability to
improve water use
efficiency
Farmer questionnaire
Paraphrase This Document
Need a fresh take? Get an instant paraphrase of this document with our AI Paraphraser
11
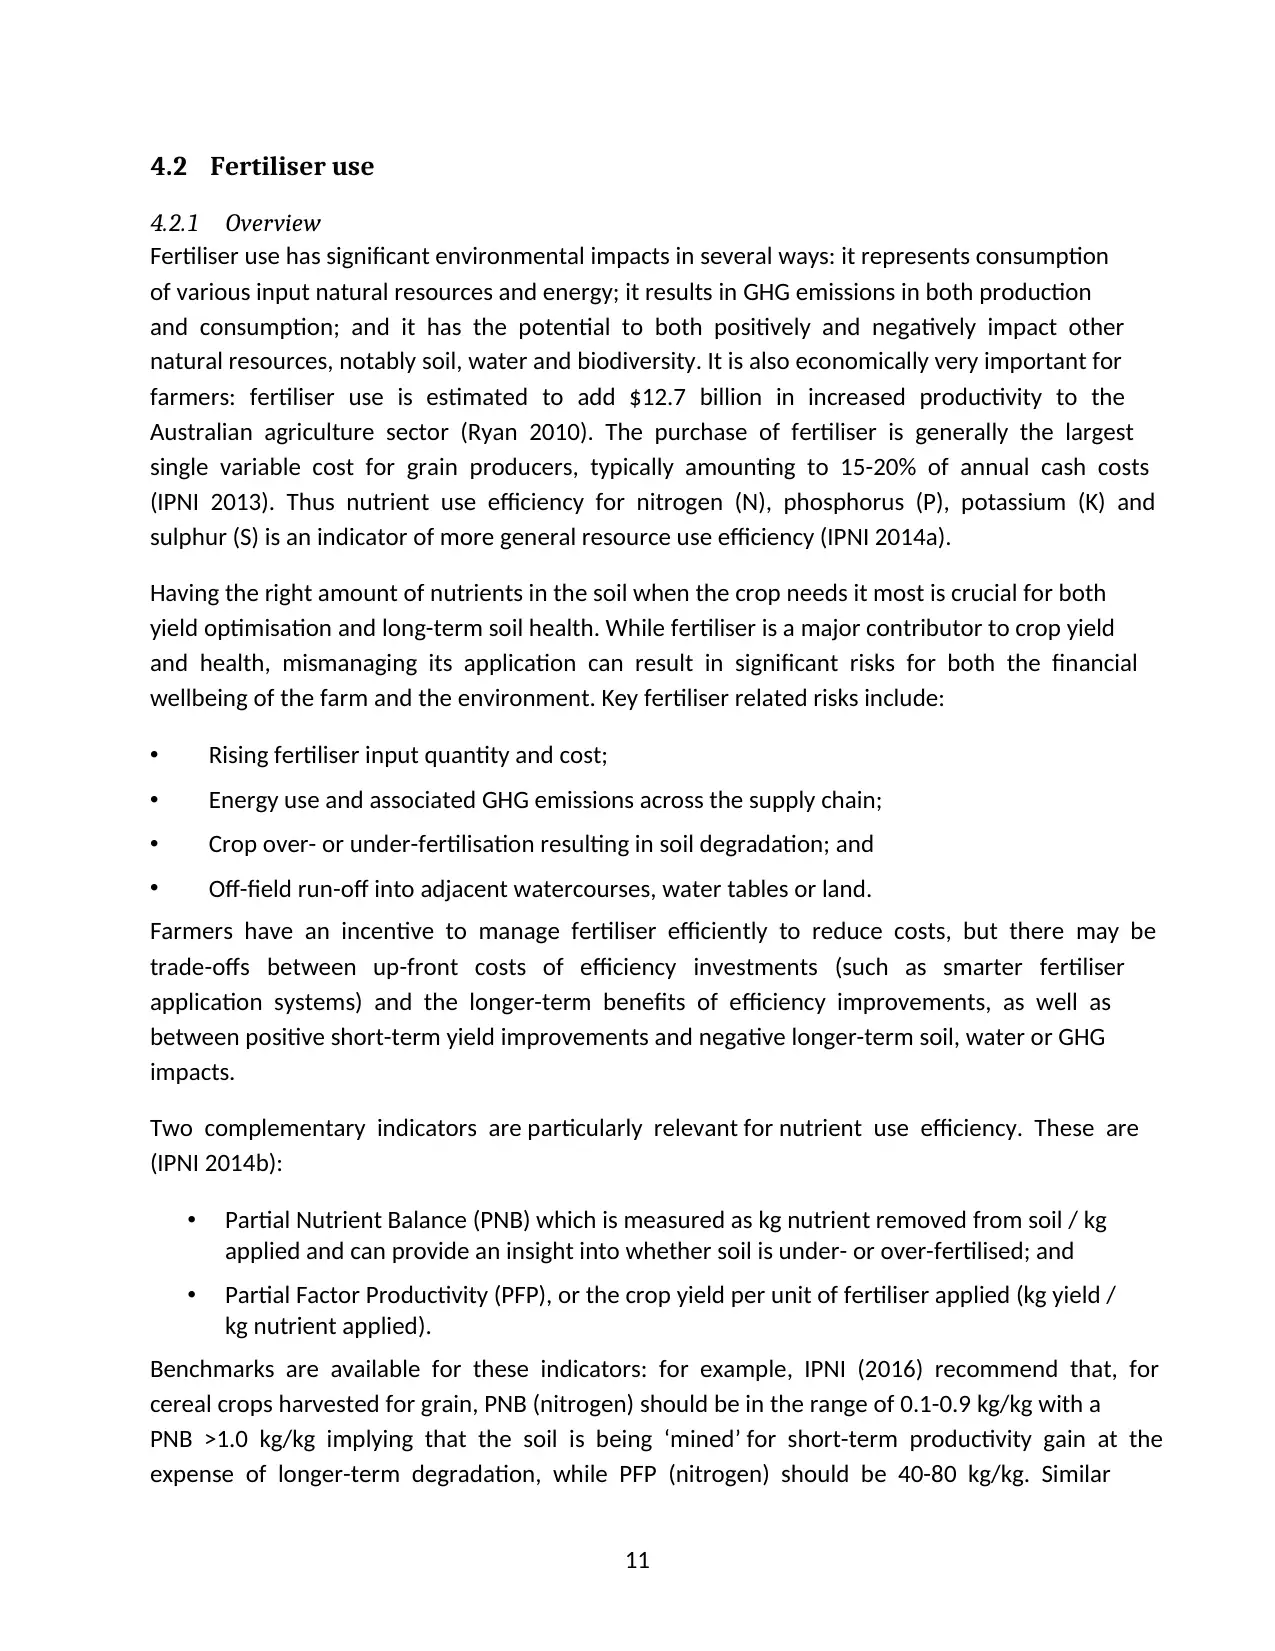
4.2 Fertiliser use
4.2.1 Overview
Fertiliser use has significant environmental impacts in several ways: it represents consumption
of various input natural resources and energy; it results in GHG emissions in both production
and consumption; and it has the potential to both positively and negatively impact other
natural resources, notably soil, water and biodiversity. It is also economically very important for
farmers: fertiliser use is estimated to add $12.7 billion in increased productivity to the
Australian agriculture sector (Ryan 2010). The purchase of fertiliser is generally the largest
single variable cost for grain producers, typically amounting to 15-20% of annual cash costs
(IPNI 2013). Thus nutrient use efficiency for nitrogen (N), phosphorus (P), potassium (K) and
sulphur (S) is an indicator of more general resource use efficiency (IPNI 2014a).
Having the right amount of nutrients in the soil when the crop needs it most is crucial for both
yield optimisation and long-term soil health. While fertiliser is a major contributor to crop yield
and health, mismanaging its application can result in significant risks for both the financial
wellbeing of the farm and the environment. Key fertiliser related risks include:
• Rising fertiliser input quantity and cost;
• Energy use and associated GHG emissions across the supply chain;
• Crop over- or under-fertilisation resulting in soil degradation; and
• Off-field run-off into adjacent watercourses, water tables or land.
Farmers have an incentive to manage fertiliser efficiently to reduce costs, but there may be
trade-offs between up-front costs of efficiency investments (such as smarter fertiliser
application systems) and the longer-term benefits of efficiency improvements, as well as
between positive short-term yield improvements and negative longer-term soil, water or GHG
impacts.
Two complementary indicators are particularly relevant for nutrient use efficiency. These are
(IPNI 2014b):
• Partial Nutrient Balance (PNB) which is measured as kg nutrient removed from soil / kg
applied and can provide an insight into whether soil is under- or over-fertilised; and
• Partial Factor Productivity (PFP), or the crop yield per unit of fertiliser applied (kg yield /
kg nutrient applied).
Benchmarks are available for these indicators: for example, IPNI (2016) recommend that, for
cereal crops harvested for grain, PNB (nitrogen) should be in the range of 0.1-0.9 kg/kg with a
PNB >1.0 kg/kg implying that the soil is being ‘mined’ for short-term productivity gain at the
expense of longer-term degradation, while PFP (nitrogen) should be 40-80 kg/kg. Similar
12
benchmarks can be established for phosphorus, potassium and sulphur, and a lender could
establish their own benchmarks across a portfolio of similar farms. However, differences in soil
type, crop variety, micro-climate and other factors may make it difficult to distinguish between
best and worst performers: for example, Mahjourimajd et al. (2016) find that different wheat
genotypes have a significantly different PFP in low rainfall environments in Australia.
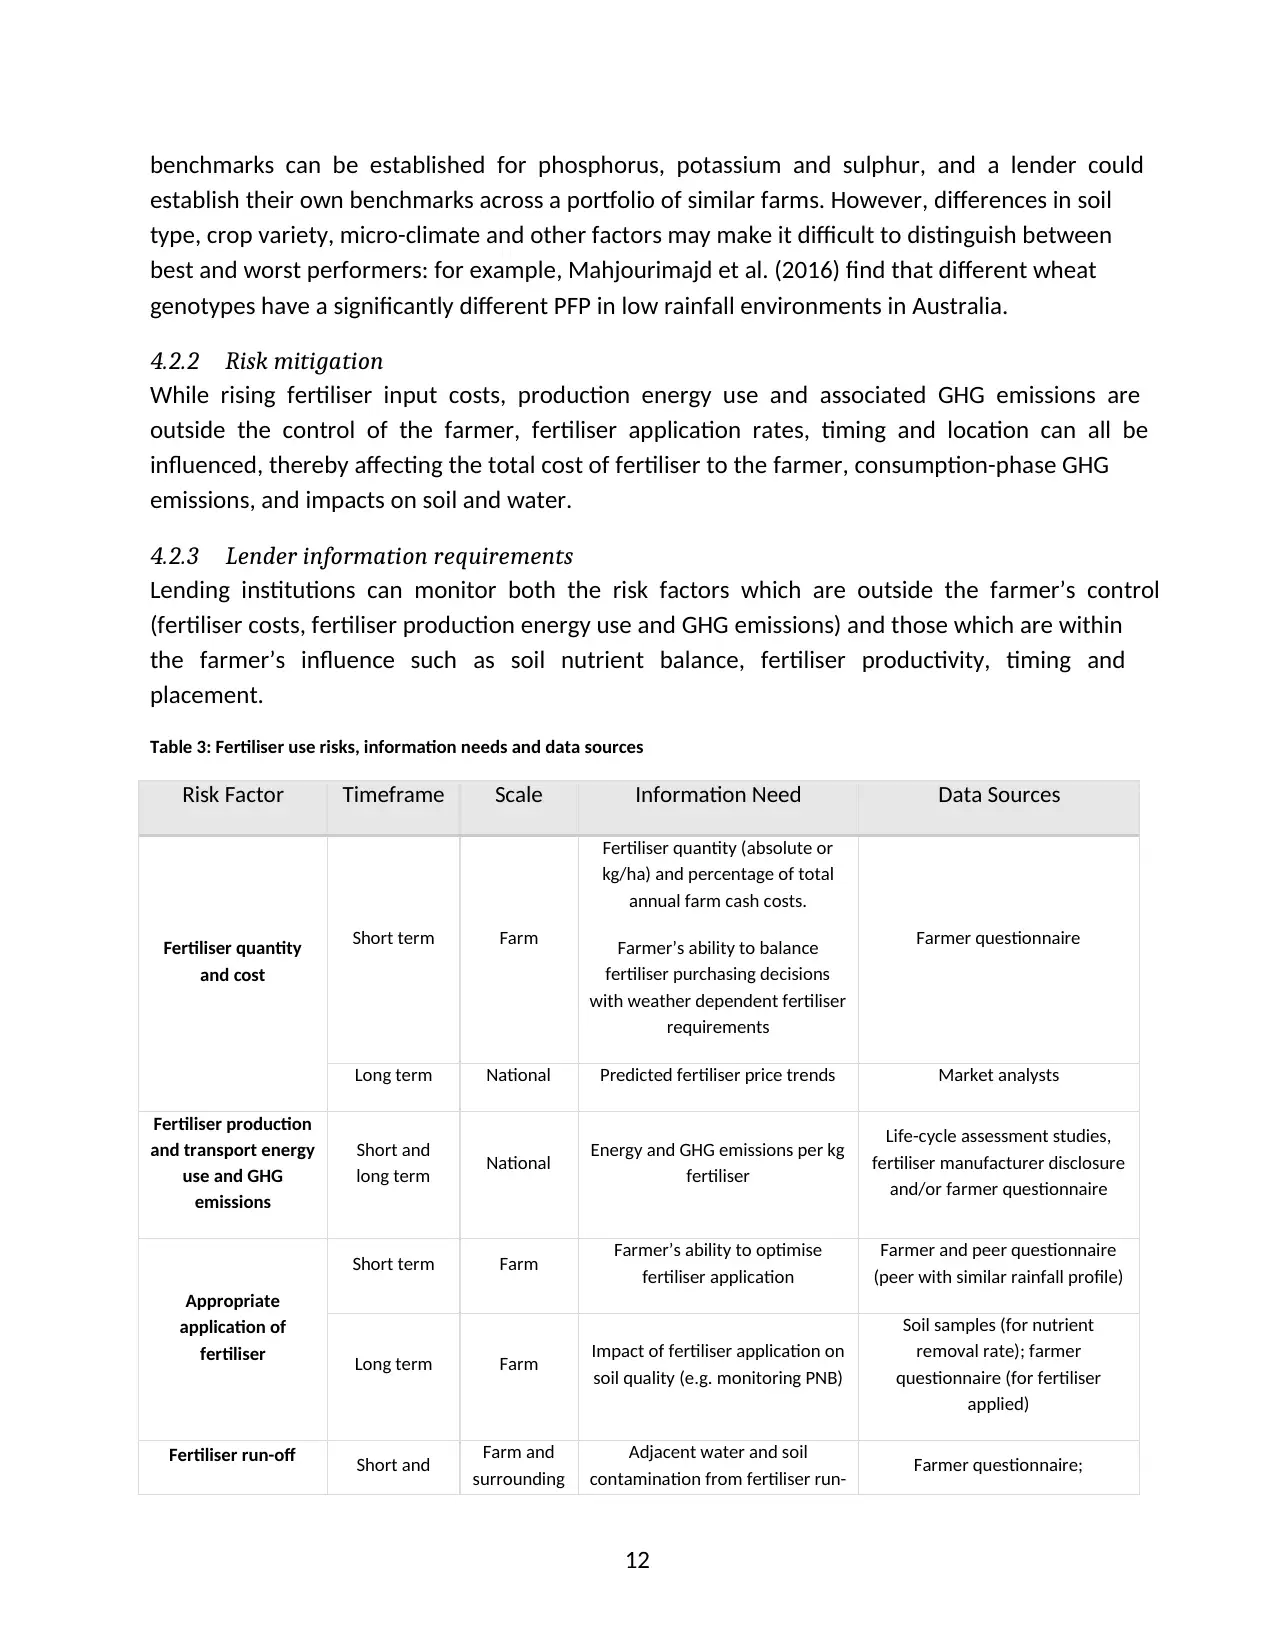
4.2.2 Risk mitigation
While rising fertiliser input costs, production energy use and associated GHG emissions are
outside the control of the farmer, fertiliser application rates, timing and location can all be
influenced, thereby affecting the total cost of fertiliser to the farmer, consumption-phase GHG
emissions, and impacts on soil and water.
4.2.3 Lender information requirements
Lending institutions can monitor both the risk factors which are outside the farmer’s control
(fertiliser costs, fertiliser production energy use and GHG emissions) and those which are within
the farmer’s influence such as soil nutrient balance, fertiliser productivity, timing and
placement.
Table 3: Fertiliser use risks, information needs and data sources
Risk Factor Timeframe Scale Information Need Data Sources
Fertiliser quantity
and cost
Short term Farm
Fertiliser quantity (absolute or
kg/ha) and percentage of total
annual farm cash costs.
Farmer’s ability to balance
fertiliser purchasing decisions
with weather dependent fertiliser
requirements
Farmer questionnaire
Long term National Predicted fertiliser price trends Market analysts
Fertiliser production
and transport energy
use and GHG
emissions
Short and
long term National Energy and GHG emissions per kg
fertiliser
Life-cycle assessment studies,
fertiliser manufacturer disclosure
and/or farmer questionnaire
Appropriate
application of
fertiliser
Short term Farm Farmer’s ability to optimise
fertiliser application
Farmer and peer questionnaire
(peer with similar rainfall profile)
Long term Farm Impact of fertiliser application on
soil quality (e.g. monitoring PNB)
Soil samples (for nutrient
removal rate); farmer
questionnaire (for fertiliser
applied)
Fertiliser run-off Short and Farm and
surrounding
Adjacent water and soil
contamination from fertiliser run- Farmer questionnaire;
benchmarks can be established for phosphorus, potassium and sulphur, and a lender could
establish their own benchmarks across a portfolio of similar farms. However, differences in soil
type, crop variety, micro-climate and other factors may make it difficult to distinguish between
best and worst performers: for example, Mahjourimajd et al. (2016) find that different wheat
genotypes have a significantly different PFP in low rainfall environments in Australia.
4.2.2 Risk mitigation
While rising fertiliser input costs, production energy use and associated GHG emissions are
outside the control of the farmer, fertiliser application rates, timing and location can all be
influenced, thereby affecting the total cost of fertiliser to the farmer, consumption-phase GHG
emissions, and impacts on soil and water.
4.2.3 Lender information requirements
Lending institutions can monitor both the risk factors which are outside the farmer’s control
(fertiliser costs, fertiliser production energy use and GHG emissions) and those which are within
the farmer’s influence such as soil nutrient balance, fertiliser productivity, timing and
placement.
Table 3: Fertiliser use risks, information needs and data sources
Risk Factor Timeframe Scale Information Need Data Sources
Fertiliser quantity
and cost
Short term Farm
Fertiliser quantity (absolute or
kg/ha) and percentage of total
annual farm cash costs.
Farmer’s ability to balance
fertiliser purchasing decisions
with weather dependent fertiliser
requirements
Farmer questionnaire
Long term National Predicted fertiliser price trends Market analysts
Fertiliser production
and transport energy
use and GHG
emissions
Short and
long term National Energy and GHG emissions per kg
fertiliser
Life-cycle assessment studies,
fertiliser manufacturer disclosure
and/or farmer questionnaire
Appropriate
application of
fertiliser
Short term Farm Farmer’s ability to optimise
fertiliser application
Farmer and peer questionnaire
(peer with similar rainfall profile)
Long term Farm Impact of fertiliser application on
soil quality (e.g. monitoring PNB)
Soil samples (for nutrient
removal rate); farmer
questionnaire (for fertiliser
applied)
Fertiliser run-off Short and Farm and
surrounding
Adjacent water and soil
contamination from fertiliser run- Farmer questionnaire;
⊘ This is a preview!⊘
Do you want full access?
Subscribe today to unlock all pages.
Trusted by 1+ million students worldwide
1 out of 24


Your All-in-One AI-Powered Toolkit for Academic Success.
+13062052269
info@desklib.com
Available 24*7 on WhatsApp / Email
![[object Object]](/_next/static/media/star-bottom.7253800d.svg)
Unlock your academic potential
Copyright © 2020–2026 A2Z Services. All Rights Reserved. Developed and managed by ZUCOL.