OMGT2087 Assignment 1: Optimizing Navel Production and Distribution

Verified

Added on  2022/09/13

|4
|672
|33
Project
AI Summary
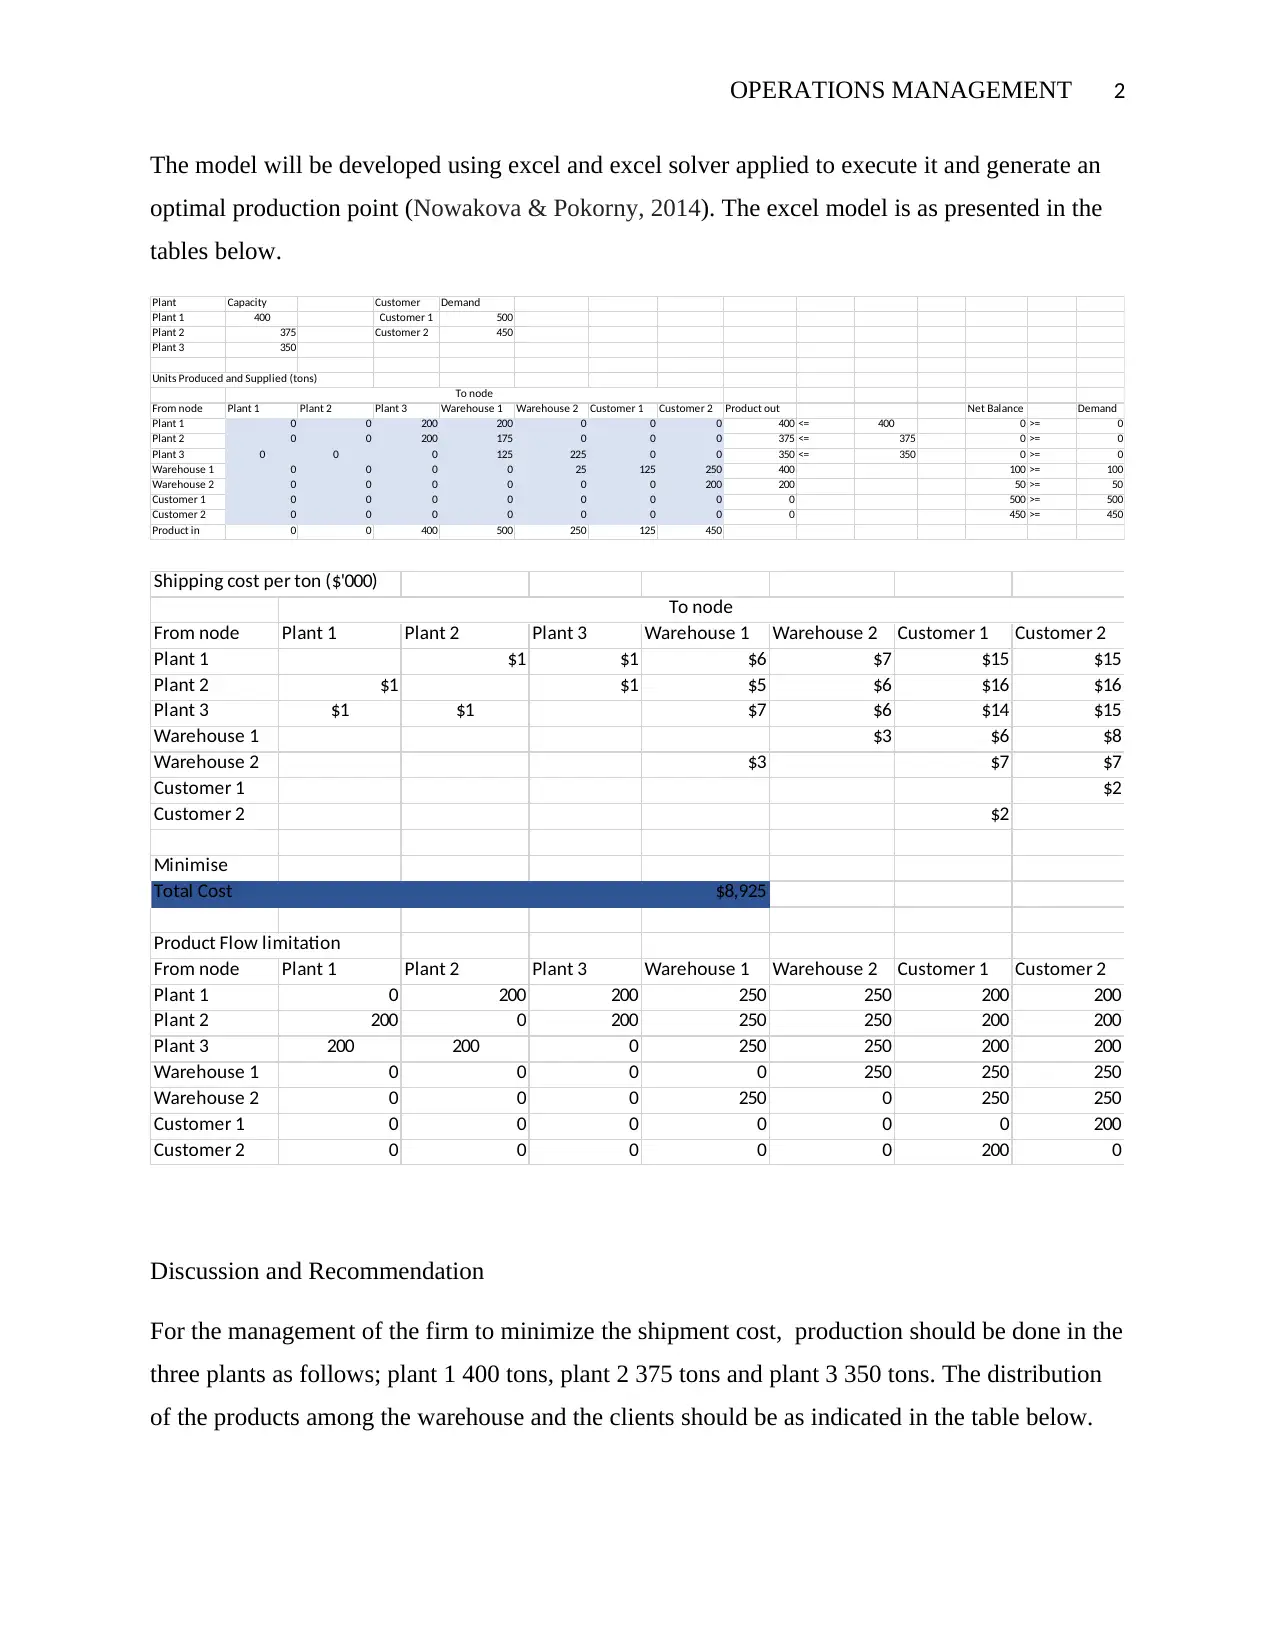
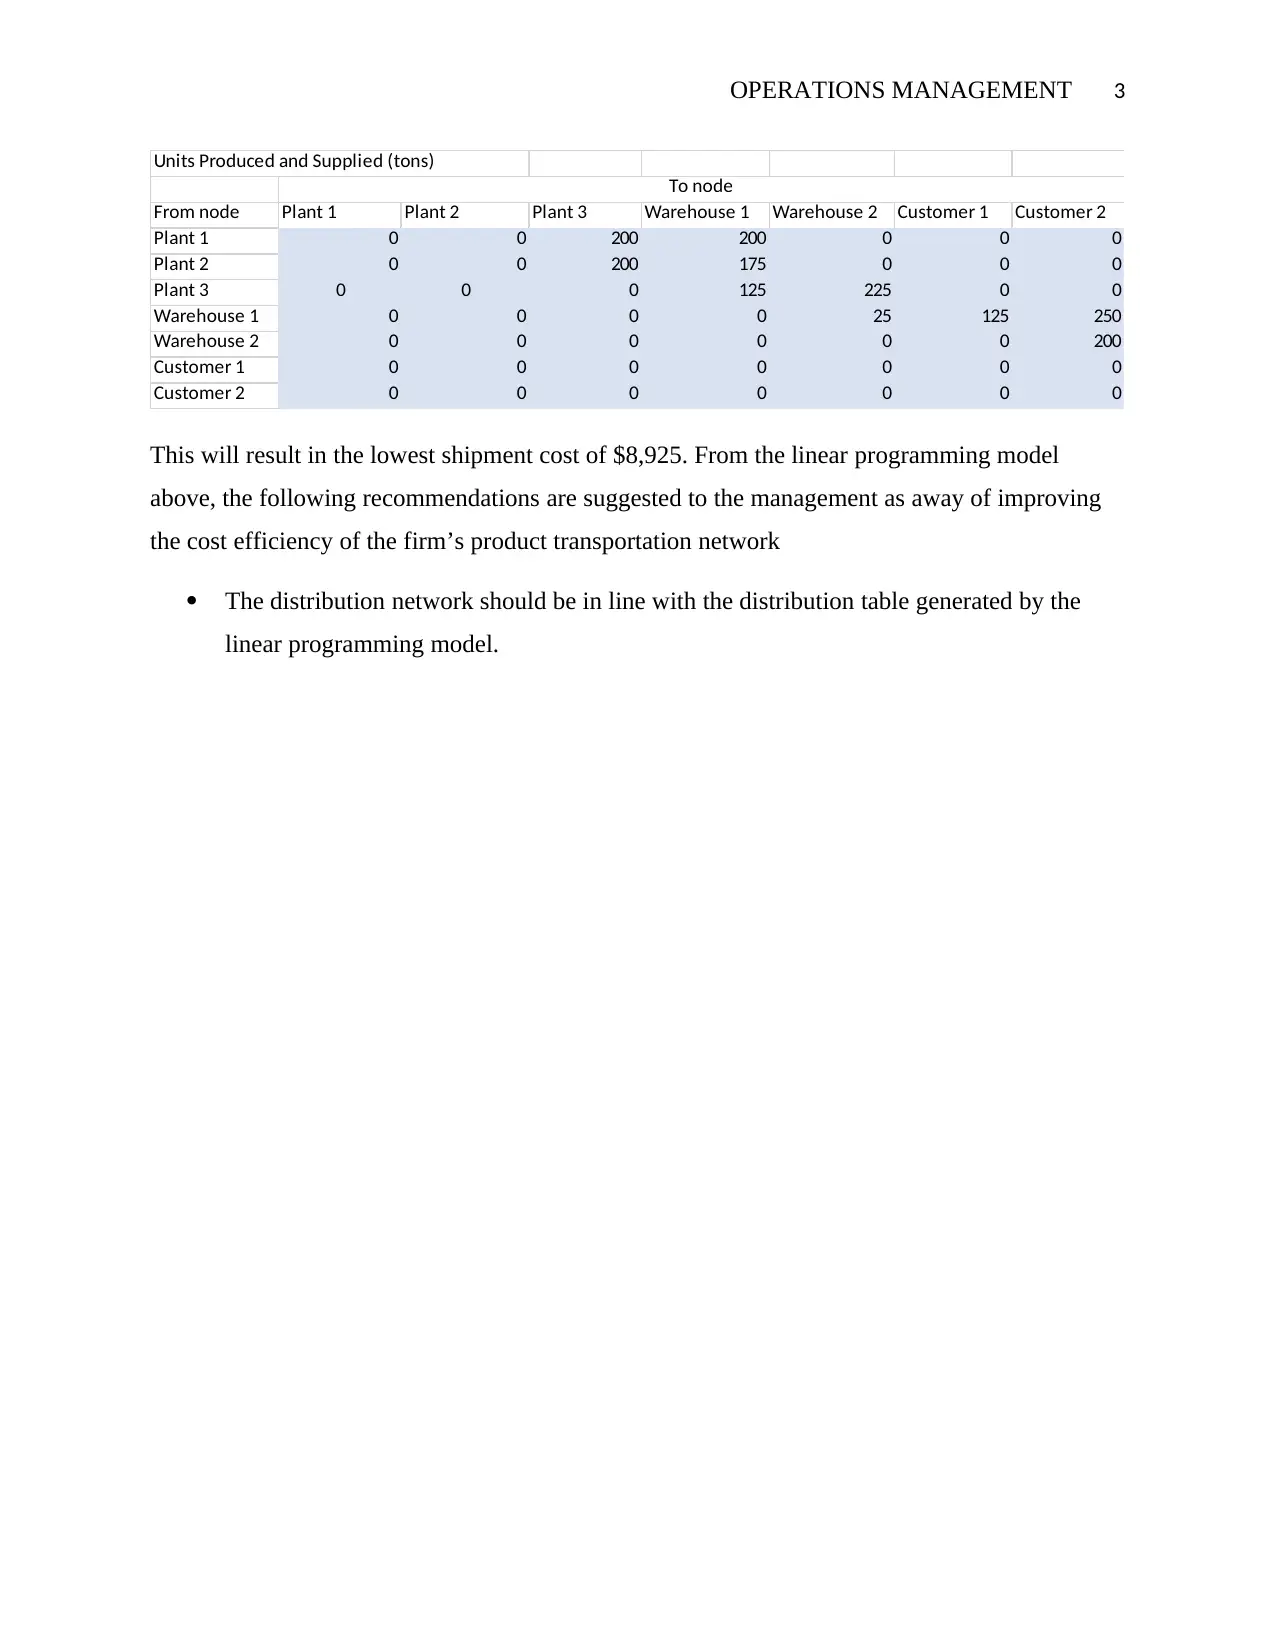
This project utilizes linear programming to optimize the production and distribution of navels for a company with three plants, two warehouses, and two customers. The objective is to minimize total shipping costs while meeting customer demand and considering plant capacities and warehouse safety stock levels. A mathematical model is formulated, incorporating decision variables for the quantity of navels shipped between nodes (plants, warehouses, and customers). The model is implemented using Excel and Excel Solver to generate an optimal production and distribution plan. The analysis recommends production levels for each plant and distribution routes to minimize costs, resulting in a total shipment cost of $8,925. The project concludes with recommendations for the management, emphasizing the importance of adhering to the distribution network generated by the linear programming model to improve the cost efficiency of the firm's product transportation.
Document Page
OPERATIONS MANAGEMENT 1
OMGT2087
Student Name
Institution Name
Date
Introduction
The entire supply chain can be represented using a linear programming formulation that assists
evaluate the quantity of raw materials consumed as well as the optimal distribution network for
the finished products (Tayur, Ganeshan and Magazine, 2012). The distribution network do take
into account delivery time, market demand and the distribution costs. The aim of the project is to
minimize the distribution cost of the firm. The report puts into practice the linear programming
principle in the decision-making process (Peidro, Mula, Jiménez and Botella, 2010). The task
will involve the application of the linear programming in making production and distribution
decision as a way to minimizes the total costs. In the case study, a navel production company
with a direct supply to two warehouse and two customers wishes to use the linear programming
technique to identify the optimal plant to use for production and the most cost-efficient supply
chain. The model will be discussed and afterwards recommendations made regarding the optimal
decision.
Mathematical model
To formulate the linear programming model, we take into consideration the 3 plants and their
capacity, the two customers and their demand quantity as well as the two warehouses with the
quantity of safety stock needed.
The decision variables are the quantity of navels that are produced and shipped from one node to
another (Anderson, Sweeney, Williams, Camm, and Cochran, 2012). The nodes are either the
plants, warehouse or customers. The objective of the linear model is to minimize the total
shipping cost that is incurred in the movements of products across the nodes. The production,
supply and demand limitations will also be taken into account. This includes; ensuring
production in each plant does not exceed plant capacity, supply of the navels meet the consumer
demand and each of the warehouse are stocked with a minimum of stock needed for safety stock.
tabler-icon-diamond-filled.svg

Secure Best Marks with AI Grader

Need help grading? Try our AI Grader for instant feedback on your assignments.
Document Page
OPERATIONS MANAGEMENT 2
The model will be developed using excel and excel solver applied to execute it and generate an
optimal production point (Nowakova & Pokorny, 2014). The excel model is as presented in the
tables below.
Plant Capacity Customer Demand
Plant 1 400 Customer 1 500
Plant 2 375 Customer 2 450
Plant 3 350
Units Produced and Supplied (tons)
From node Plant 1 Plant 2 Plant 3 Warehouse 1 Warehouse 2 Customer 1 Customer 2 Product out Net Balance Demand
Plant 1 0 0 200 200 0 0 0 400 <= 400 0 >= 0
Plant 2 0 0 200 175 0 0 0 375 <= 375 0 >= 0
Plant 3 0 0 0 125 225 0 0 350 <= 350 0 >= 0
Warehouse 1 0 0 0 0 25 125 250 400 100 >= 100
Warehouse 2 0 0 0 0 0 0 200 200 50 >= 50
Customer 1 0 0 0 0 0 0 0 0 500 >= 500
Customer 2 0 0 0 0 0 0 0 0 450 >= 450
Product in 0 0 400 500 250 125 450
To node
Shipping cost per ton ($'000)
From node Plant 1 Plant 2 Plant 3 Warehouse 1 Warehouse 2 Customer 1 Customer 2
Plant 1 $1 $1 $6 $7 $15 $15
Plant 2 $1 $1 $5 $6 $16 $16
Plant 3 $1 $1 $7 $6 $14 $15
Warehouse 1 $3 $6 $8
Warehouse 2 $3 $7 $7
Customer 1 $2
Customer 2 $2
Minimise
Total Cost $8,925
Product Flow limitation
From node Plant 1 Plant 2 Plant 3 Warehouse 1 Warehouse 2 Customer 1 Customer 2
Plant 1 0 200 200 250 250 200 200
Plant 2 200 0 200 250 250 200 200
Plant 3 200 200 0 250 250 200 200
Warehouse 1 0 0 0 0 250 250 250
Warehouse 2 0 0 0 250 0 250 250
Customer 1 0 0 0 0 0 0 200
Customer 2 0 0 0 0 0 200 0
To node
Discussion and Recommendation
For the management of the firm to minimize the shipment cost, production should be done in the
three plants as follows; plant 1 400 tons, plant 2 375 tons and plant 3 350 tons. The distribution
of the products among the warehouse and the clients should be as indicated in the table below.
Document Page
OPERATIONS MANAGEMENT 3
Units Produced and Supplied (tons)
From node Plant 1 Plant 2 Plant 3 Warehouse 1 Warehouse 2 Customer 1 Customer 2
Plant 1 0 0 200 200 0 0 0
Plant 2 0 0 200 175 0 0 0
Plant 3 0 0 0 125 225 0 0
Warehouse 1 0 0 0 0 25 125 250
Warehouse 2 0 0 0 0 0 0 200
Customer 1 0 0 0 0 0 0 0
Customer 2 0 0 0 0 0 0 0
To node
This will result in the lowest shipment cost of $8,925. From the linear programming model
above, the following recommendations are suggested to the management as away of improving
the cost efficiency of the firm’s product transportation network
The distribution network should be in line with the distribution table generated by the
linear programming model.
Document Page
OPERATIONS MANAGEMENT 4
References
Anderson, D.R., Sweeney, D.J., Williams, T.A., Camm, J.D. and Cochran, J.J.,
(2012). Quantitative Methods for Business (Book Only). Cengage Learning.
Nowakova, J. and Pokorny, M., (2014). On multidimensional linear modelling including real
uncertainty. Advances in Electrical and Electronic Engineering, 12(5), pp.511-517.
Peidro, D., Mula, J., Jiménez, M. and del Mar Botella, M., (2010). A fuzzy linear programming
based approach for tactical supply chain planning in an uncertainty environment. European
Journal of Operational Research, 205(1), pp.65-80.
Tayur, S., Ganeshan, R. and Magazine, M. eds., (2012). Quantitative models for supply chain
management (Vol. 17). Springer Science & Business Media.
chevron_up_icon
1 out of 4
circle_padding
hide_on_mobile
zoom_out_icon
logo.png

Your All-in-One AI-Powered Toolkit for Academic Success.

Available 24*7 on WhatsApp / Email

[object Object]