Excel Data Analysis: NBA Team Performance Prediction Project

Verified

Added on  2023/01/18

|5
|1360
|76
Project
AI Summary
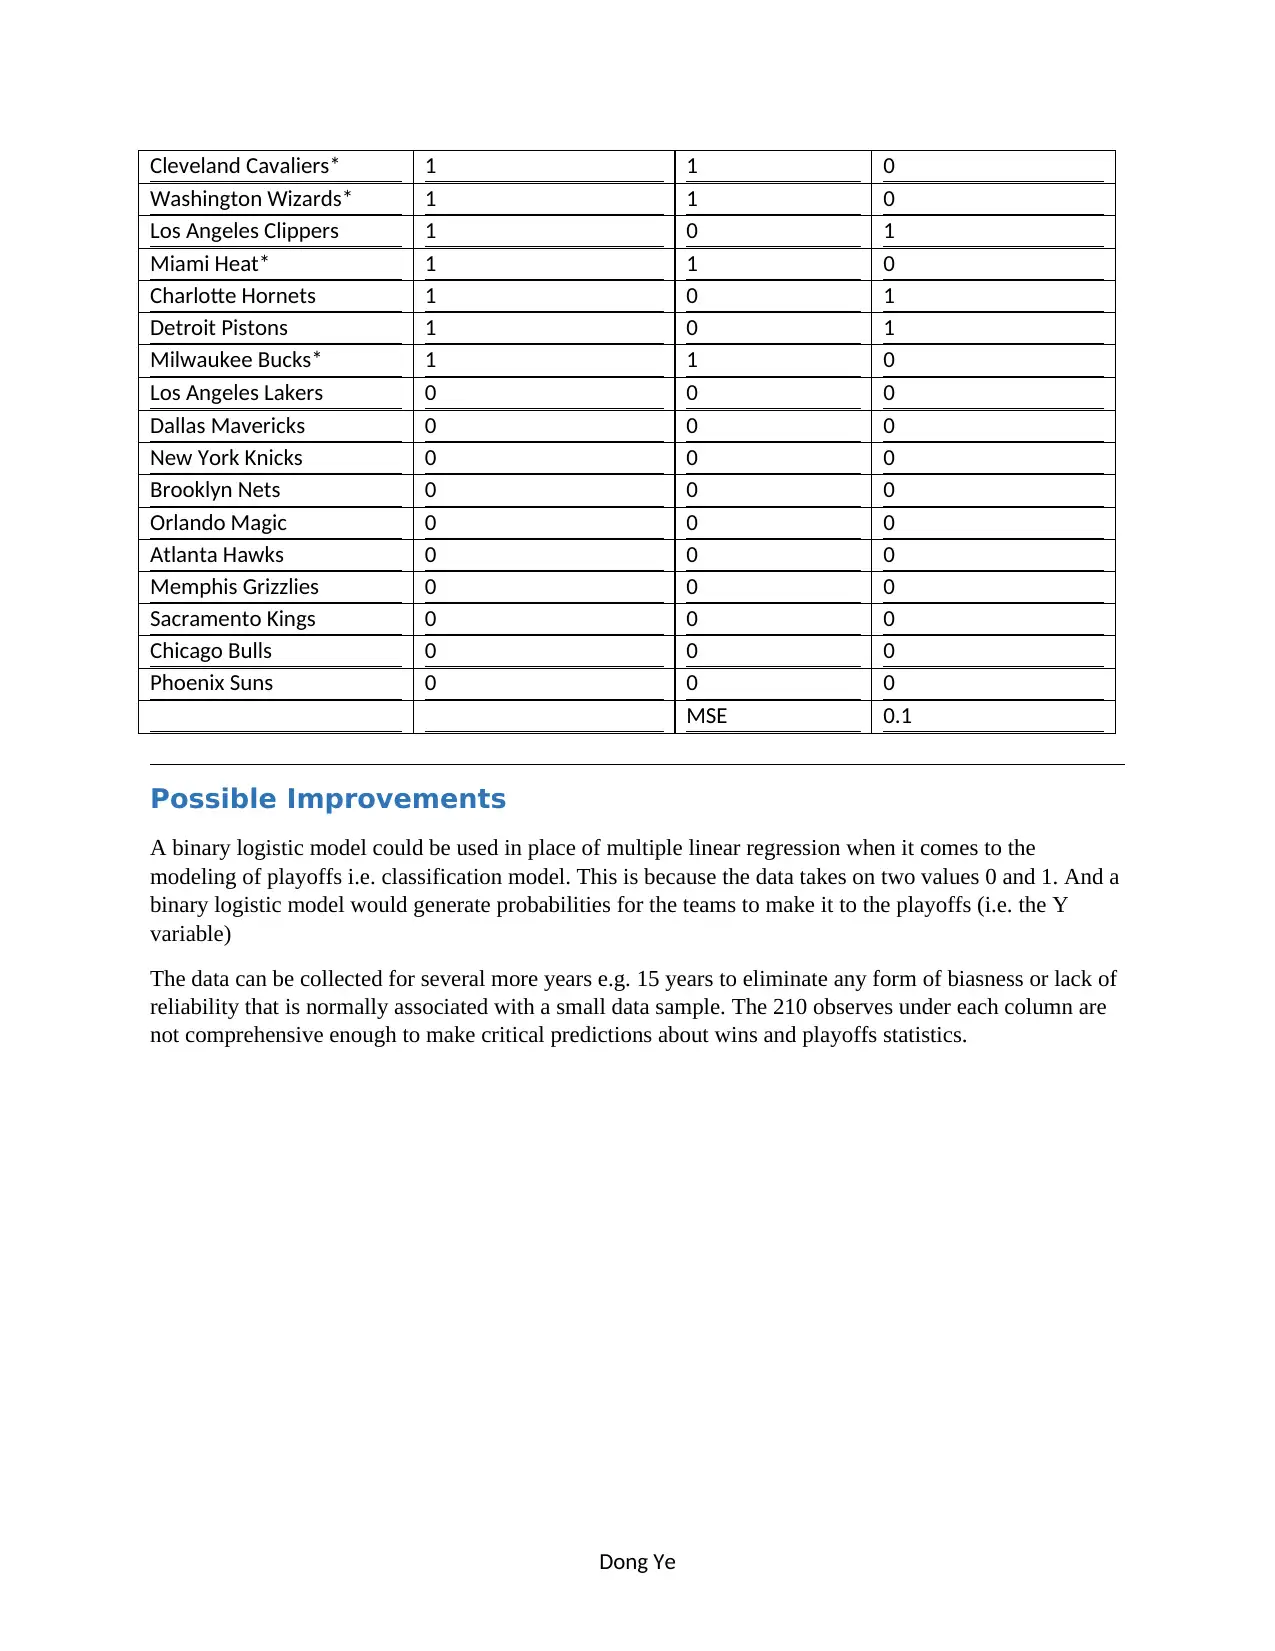
This project, prepared by Dong Ye for CMIS2250 at the Northern Alberta Institute of Technology, focuses on predicting NBA team performance. The project involves collecting and preparing data from 2010 to 2018, excluding 2017-2018 win-loss data, and building predictive and classification models using Excel. The process includes data cleaning, model selection (multiple linear regression), and result presentation, including a comparison of forecasted and actual results. The final models predict wins and playoff participation based on various offensive, defensive, and efficiency statistics. The project also includes a discussion of potential improvements, such as using a binary logistic model and expanding the data sample. The project demonstrates the application of data analysis techniques to forecast real-world outcomes.
Document Page
Term Project
Prepared by Dong Ye
Enter your Student ID in the Keywords Properties of this document
Prepared for Dong Ye
CMIS2250 Section XXX
Date of Submission: Friday, August 30, 2024
Northern Alberta Institute of Technology
tabler-icon-diamond-filled.svg

Secure Best Marks with AI Grader

Need help grading? Try our AI Grader for instant feedback on your assignments.
Document Page
Explanation of the Process
The miscellaneous data for each year between 2010 and 2018 was downloaded and compiled under one
excel workbook. The data for 2010 to 2017 was put in the worksheet source data while the data for
2017-2018 season was placed in the subject worksheet. Arena, L, PW, PL, MOV, SOS, and SRS data was
remove from both worksheets. The age and win columns were interchanged to allow the independent
variables to be placed together in a continuous manner. The playoffs column was inserted before the
win column in both worksheets. The assessment column provided in this document were copied and
pasted in the final predictive model and classification model worksheet. The playoffs data was gather
from the same website as the source and subject data using the following link Playoffs Data Source. The
data for playoffs was entered manually into source worksheet and the final classification model
worksheet.
Justification of Model Choice
Three models were created for predictive assessment as well as for classification assessment. The
models were assessed individuals with regard to (adjusted) R-squared, and the significance of the model
and coefficients at alpha =0.05. The first model format for both predictive and classification assessment
was a simple linear regression with a single independent variable age i.e. y=β0 + β1 x . Hence the two
models can be presented as follows:
Playoffs ( y)=β0+ β1 Age
Wins( y)= β0 + β1 Age
The second model format for both predictive and classification assessment was a multiple-linear
regression model with several independent variables i.e. y=β0 +βi xi where i=1,2 ,… . Hence the two
models can be presented as follows:
Playoffs ( y ) =β0 + β1 Age+ β2 ORtg+ β3 DRtg+ β4 NRtg+ β5 Pace+ β6 Ftrr+ β7 3 PAr
Wins ( y )=β0 + β1 Age+ β2 ORtg+ β3 DRtg+ β4 NRtg+ β5 Pace+β6 Ftrr+ β7 3 PAr
The third model format for both predictive and classification assessment was also a multiple-linear
regression model with several independent variables associated with TS%, defensive and offensive
statistics i.e. y=β0 + βi xi where i=1,2 ,… . Hence the two models can be presented as follows:
Where the subscripts O=offensive and D=Defensive
Playoffs ( y ) =β0 + β1 TS %+ β2 eFG %O + β3 TOV %O + β 4 ORB %O + β5
FT
FGA O
+β6 eF G %D + β7 TOV %D + β8 DRB %D
Wins ( y )=β0 + β1 TS %+β2 eFG%O+ β3 TOV %O +β4 ORB %O + β5
FT
FGA O
+ β6 eFG %D+ β7 TOV %D + β8 DRB %D+ β9
The third model was select to be final mode because it was superior to the other two model formats
with regard to r-squared value, and number of significant coefficients. The model was further modified
Dong Ye
Document Page
by removing the variables eFG %O and FT
FGA O
because they were not significant at an alpha level of
0.05
The final Predictive Model
Wins ( y )=β0 +β1 TS %+β2 TOV %O +β3 ORB %O + β4 eFG % D + β5 TOV %D + β6 DRB %D + β7
FT
FGA D
With coefficient the model is:
Wins ( y )=−124.14+443.63∗TS %−3.48 ¿ TOV %O +1.02¿ ORB %O −320.20∗eFG%D + 2.87∗TOV %D +1.10∗DR
The model above has an adjusted R-square of 0.8929 which means that 89.29% of the change in the
dependent variable (wins) can be explained by the independent variables
The final classification model
Playoffs ( y ) =β0 + β1 TS %+ β2 TOV %O + β3 ORB %O + β4 eFG %D +β5 TOV %D + β6 DRB % D +β7
FT
FGA D
With coefficient the model is:
Playoffs ( y ) =−2.397+11.98∗TS %−0.08∗TOV %O + 0.025∗ORB %O −12.25∗eFG %D+ 0.13∗TOV %D +0.03∗D
The model above has an adjusted R-square of 0.5612 which means that 56.12% of the change in the
dependent variable (wins) can be explained by the independent variables
Presentation of Results
(Please present the prediction result in a table format. And compare the results with the factual data.)
Predictive Model
Team Forecasting Result Results Error
Houston Rockets* 63 65 -2
Toronto Raptors* 60 59 1
Golden State Warriors* 61 58 3
Utah Jazz* 53 48 5
Philadelphia 76ers* 52 52 0
Oklahoma City Thunder* 49 48 1
Boston Celtics* 49 55 -6
San Antonio Spurs* 48 47 1
Portland Trail Blazers* 46 49 -3
Minnesota Timberwolves* 50 47 3
Dong Ye
Document Page
Denver Nuggets 45 46 -1
New Orleans Pelicans* 48 48 0
Indiana Pacers* 47 48 -1
Cleveland Cavaliers* 47 50 -3
Washington Wizards* 44 43 1
Los Angeles Clippers 43 42 1
Miami Heat* 43 44 -1
Charlotte Hornets 45 36 9
Detroit Pistons 43 39 4
Milwaukee Bucks* 45 44 1
Los Angeles Lakers 38 35 3
Dallas Mavericks 35 24 11
New York Knicks 33 29 4
Brooklyn Nets 31 28 3
Orlando Magic 30 25 5
Atlanta Hawks 29 24 5
Memphis Grizzlies 25 22 3
Sacramento Kings 24 27 -3
Chicago Bulls 25 27 -2
Phoenix Suns 19 21 -2
MSE 14.6
Classification Model
Team Forecasting Result Results Error
Houston Rockets* 1 1 0
Toronto Raptors* 1 1 0
Golden State Warriors* 1 1 0
Utah Jazz* 1 1 0
Philadelphia 76ers* 1 1 0
Oklahoma City Thunder* 1 1 0
Boston Celtics* 1 1 0
San Antonio Spurs* 1 1 0
Portland Trail Blazers* 1 1 0
Minnesota Timberwolves* 1 1 0
Denver Nuggets 1 0 1
New Orleans Pelicans* 1 1 0
Indiana Pacers* 1 1 0
Dong Ye
tabler-icon-diamond-filled.svg

Secure Best Marks with AI Grader

Need help grading? Try our AI Grader for instant feedback on your assignments.
Document Page
Cleveland Cavaliers* 1 1 0
Washington Wizards* 1 1 0
Los Angeles Clippers 1 0 1
Miami Heat* 1 1 0
Charlotte Hornets 1 0 1
Detroit Pistons 1 0 1
Milwaukee Bucks* 1 1 0
Los Angeles Lakers 0 0 0
Dallas Mavericks 0 0 0
New York Knicks 0 0 0
Brooklyn Nets 0 0 0
Orlando Magic 0 0 0
Atlanta Hawks 0 0 0
Memphis Grizzlies 0 0 0
Sacramento Kings 0 0 0
Chicago Bulls 0 0 0
Phoenix Suns 0 0 0
MSE 0.1
Possible Improvements
A binary logistic model could be used in place of multiple linear regression when it comes to the
modeling of playoffs i.e. classification model. This is because the data takes on two values 0 and 1. And a
binary logistic model would generate probabilities for the teams to make it to the playoffs (i.e. the Y
variable)
The data can be collected for several more years e.g. 15 years to eliminate any form of biasness or lack of
reliability that is normally associated with a small data sample. The 210 observes under each column are
not comprehensive enough to make critical predictions about wins and playoffs statistics.
Dong Ye
chevron_up_icon
1 out of 5
circle_padding
hide_on_mobile
zoom_out_icon
logo.png

Your All-in-One AI-Powered Toolkit for Academic Success.

Available 24*7 on WhatsApp / Email

[object Object]