MKTG2010: NBN Corp - Reality TV Show Impact & Attitude Report
VerifiedAdded on 2023/06/09
|24
|4181
|184
Report
AI Summary
This report investigates the impact of real-life television shows on viewers, prepared for NBN Corporation's potential launch of a new reality TV series. It includes both qualitative and quantitative explorations, examining the genuineness of reality TV programs and their societal consequences. The qualitative analysis, based on a focus group transcript, reveals concerns about the authenticity and potential negative effects of reality TV. The quantitative analysis, using data from 300 respondents, tests several hypotheses related to viewer attitudes, gender differences in enjoyment, the relationship between age and show preference, and the importance of attractive participants. Statistical tests such as Mann-Whitney U, Chi-Square, and Kruskal-Wallis are employed to analyze the data. The report concludes with a discussion of the findings and recommendations for NBN Corporation.
[1]
Impact of Real-Life Television Shows on Viewers:
An Investigation for Launch of a New Real-Life TV Series
Impact of Real-Life Television Shows on Viewers:
An Investigation for Launch of a New Real-Life TV Series
Paraphrase This Document
Need a fresh take? Get an instant paraphrase of this document with our AI Paraphraser
[2]
Table of Contents
1.0 Introduction.....................................................................................................................................3
2.0 Qualitative Exploration..........................................................................................................................3
2.1 Genuineness of the television live programs.....................................................................................3
2.2 Consequences of the live programs on the society...........................................................................4
2.3 Conceptual Model.............................................................................................................................5
3.0 Quantitative Exploration........................................................................................................................6
3.1 Sample Analysis.................................................................................................................................6
3.2 Hypotheses Testing............................................................................................................................8
A. First Hypothesis...........................................................................................................................8
B. Second Hypothesis.......................................................................................................................9
C. Third Hypothesis..........................................................................................................................9
D. Fourth Hypothesis......................................................................................................................10
E. Fifth Hypothesis.........................................................................................................................10
F. Sixth Hypothesis........................................................................................................................11
4.0 Discussion............................................................................................................................................12
5.0 Conclusion and Recommendation.......................................................................................................13
6.0 References...........................................................................................................................................14
7.0 Appendices..........................................................................................................................................15
7.1 Appendix: H1...................................................................................................................................15
7.2 Appendix: H2...................................................................................................................................17
7.3 Appendix: H3...................................................................................................................................19
7.4 Appendix: H4...................................................................................................................................20
7.5 Appendix: H5...................................................................................................................................21
7.6 Appendix: H6...................................................................................................................................23
[3]
1.0 Introduction
Effect of excessive and tortuous television viewing has always been associated with
adverse impact on behavior and health of the viewer. Negative impact on education and
psychological attributes amplifies the need of parental guidance based program viewing for the
teenagers. Long lasting adverse effect of continuous television viewing has long been discussed
by many researchers. The current study was to facilitate the NBN Corporation with the research
on the necessity of introduction of their real-life TV show.
2.0 Qualitative Exploration
2.1 Genuineness of the television live programs
Real-life TV programs have manifested its’ advantages of providing information
attainment for viewers but parallel controversies have also been created as well. The profile of
the participants includes good looking human beings who can entertain the audiences. Hence,
specific brand of acting performance becomes inevitable for these wisely selected candidates.
Impulsive decision making, impossible looking ventures, and enthusiasm are the elements of a
fascinating real life TV program. These physiognomies keep the viewers glued to the programs,
trying to predict the sequence of the show. These real life shows entirely follow the course of
set-up activities from the commencement day. Unfortunately, the focus of the programs slowly
shifts away from the real-life and the participants concentrate on the publicity from the show
markedly for a negative reason. The entertaining significance gets replaced by filthy
psychological hindrance, and the audience sometimes gets petrified due to their involvement
with the actions in the show. This particular strategy articulates to retain the viewers of the
program and influences to stay tuned to the shows. Alacritous participation reveals unpleasant
part of the participants, where they were familiar with the dreadful reality of the programs. The
characters of these shows possibly enter in some kind of monetary agreement with the producers,
and the influence of the characters of the shows captivates the viewer’s imagination. Invade into
their private life that way, unless they are moved with some lucrative rewards. Audiences gets
affected and confused by the ugly sides of television instead of watching real life experiences,
⊘ This is a preview!⊘
Do you want full access?
Subscribe today to unlock all pages.
Trusted by 1+ million students worldwide
[4]
which in turn affects the overall perspective of life. But, if the outcome does have any
implication on an individual and only the entertainment value is appreciated, then the affect
fizzes out. Viewers want TV shows drafted with skills & techniques, where the idea is to make it
interesting and close to the real life (Allen & Mendick, 2013).
2.2 Consequences of the live programs on the society
The authenticity of the shows does not matter too much if only the entertainment value is
apprehended. The negative impact of the shows becomes the primary objective instead of
focusing on the meaningful real-life constituent. The participants reveal impression about their
acknowledgement of the negative influence factors of the real-life TV shows. The confusion
between the reality and so-called realities should not be utilized by the TV stations. The
producers should bear in mind about the social responsibility issue and should not make the
power of mass media as a cliché. Every so often the audience gets involved with the episodes of
the shows which go far beyond the entertaining value. The emotions go with the development of
the reality show and the probability of staying till the end becomes very high. It is even very
hazardous for kids who can’t differentiate between fiction and reality (An & Lee, 2010).
Eventually they get too engaged in these shows and take them seriously. Guidance and control
over the demographics of the viewers, turns out to be difficult (Swinburn & Shelly, 2009).
Therefore, mentally immature people take the shows seriously and at some point of time in life,
they experience trouble differentiating fiction from reality. These viewers get emotionally
affected at the end of the show as they probably dedicate their time completely in the programs.
Sometimes, people try to make contacts with the real life show participants, causing gross
violation against privacy of the actors. Few real-life programs such as game shows or
educational talk provide entertainment and leisure to viewers. These programs should be
encouraged instead of the usual theatrical serials, which will promote moral ideologies for the
pleasure of entertainment. The controversial shows should be treated indifferently despite their
filthiness and should not take them too seriously.
Paraphrase This Document
Need a fresh take? Get an instant paraphrase of this document with our AI Paraphraser

[5]
2.3 Conceptual Model
Figure 1: Impact of Real life TV shows from multiple viewpoints
TVShowsImpactViewersPersonalityPessimisticvaluesAttitudeSensitivityTrustIssusesPerceptionArtificialParticipantsLossofprivacyPublicity
2.3 Conceptual Model
Figure 1: Impact of Real life TV shows from multiple viewpoints
TVShowsImpactViewersPersonalityPessimisticvaluesAttitudeSensitivityTrustIssusesPerceptionArtificialParticipantsLossofprivacyPublicity
[6]
3.0 Quantitative Exploration
3.1 Sample Analysis
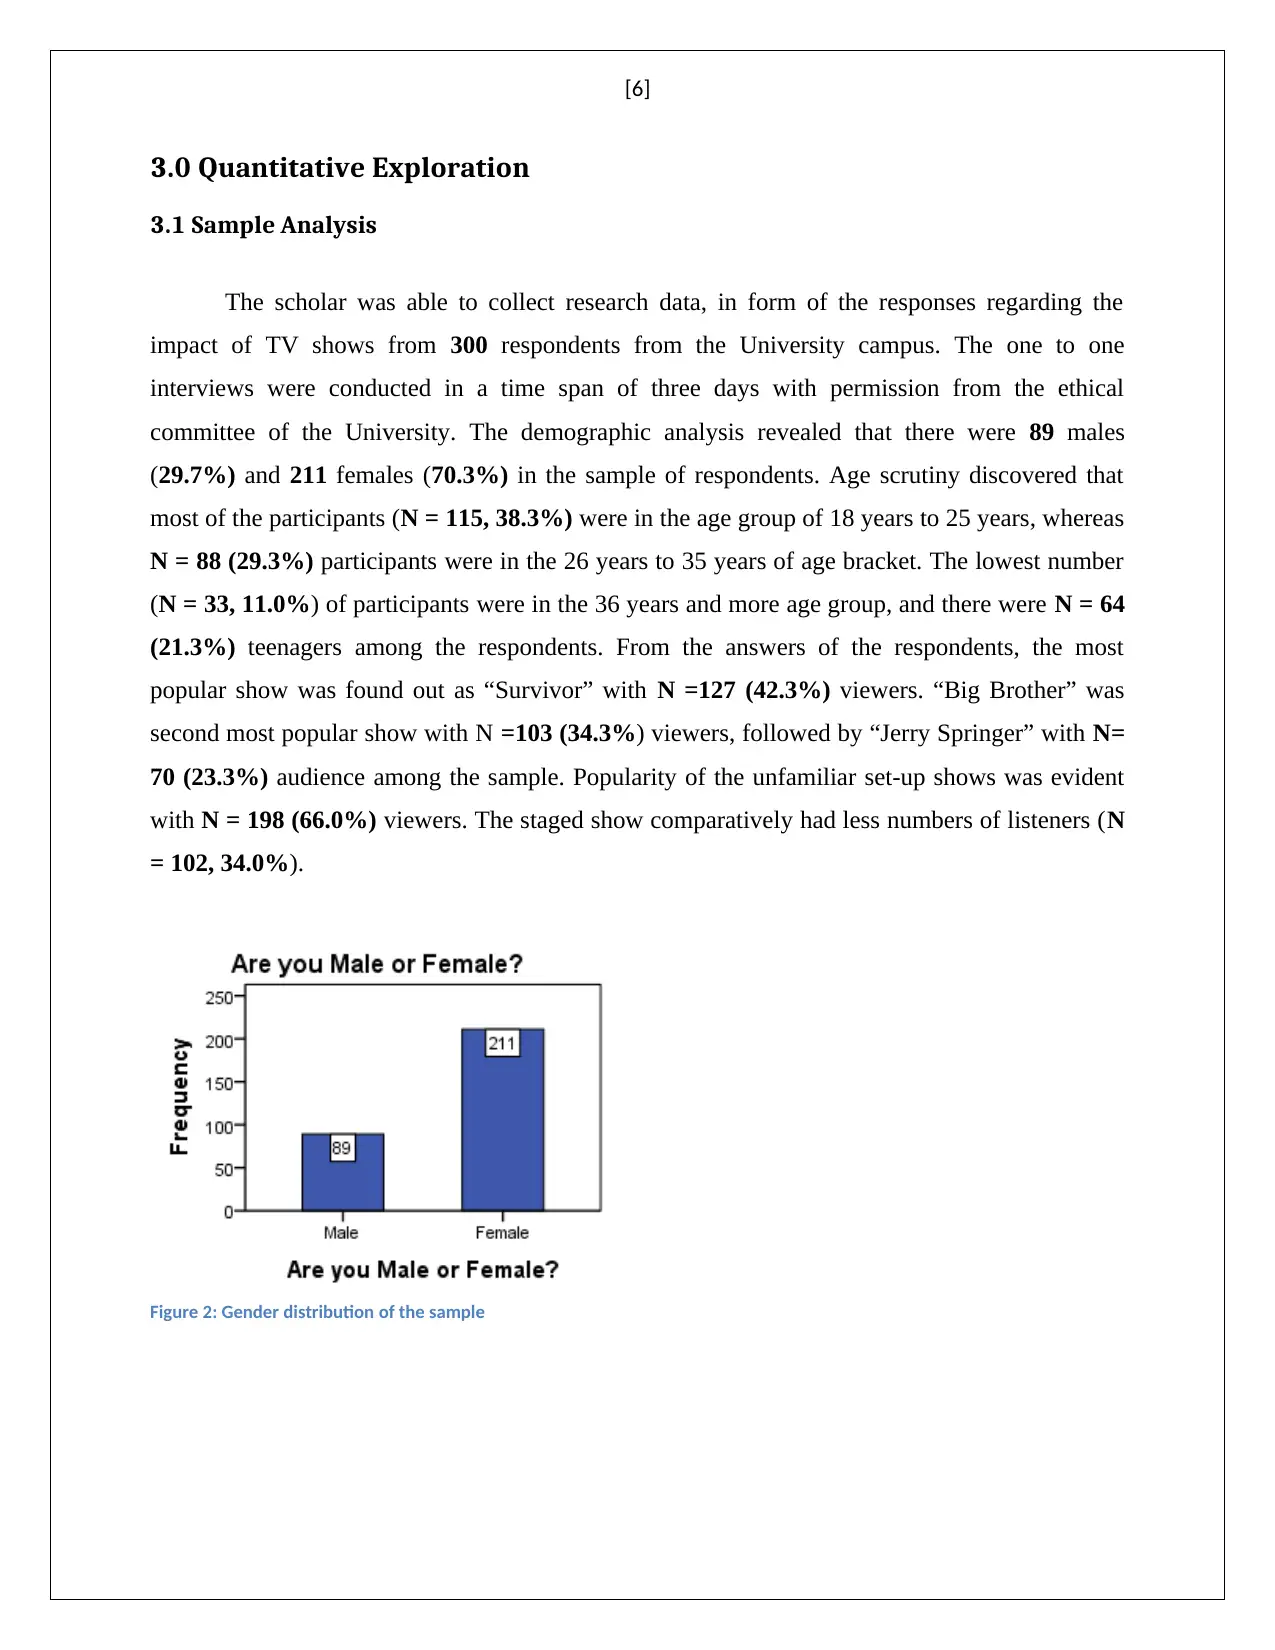
The scholar was able to collect research data, in form of the responses regarding the
impact of TV shows from 300 respondents from the University campus. The one to one
interviews were conducted in a time span of three days with permission from the ethical
committee of the University. The demographic analysis revealed that there were 89 males
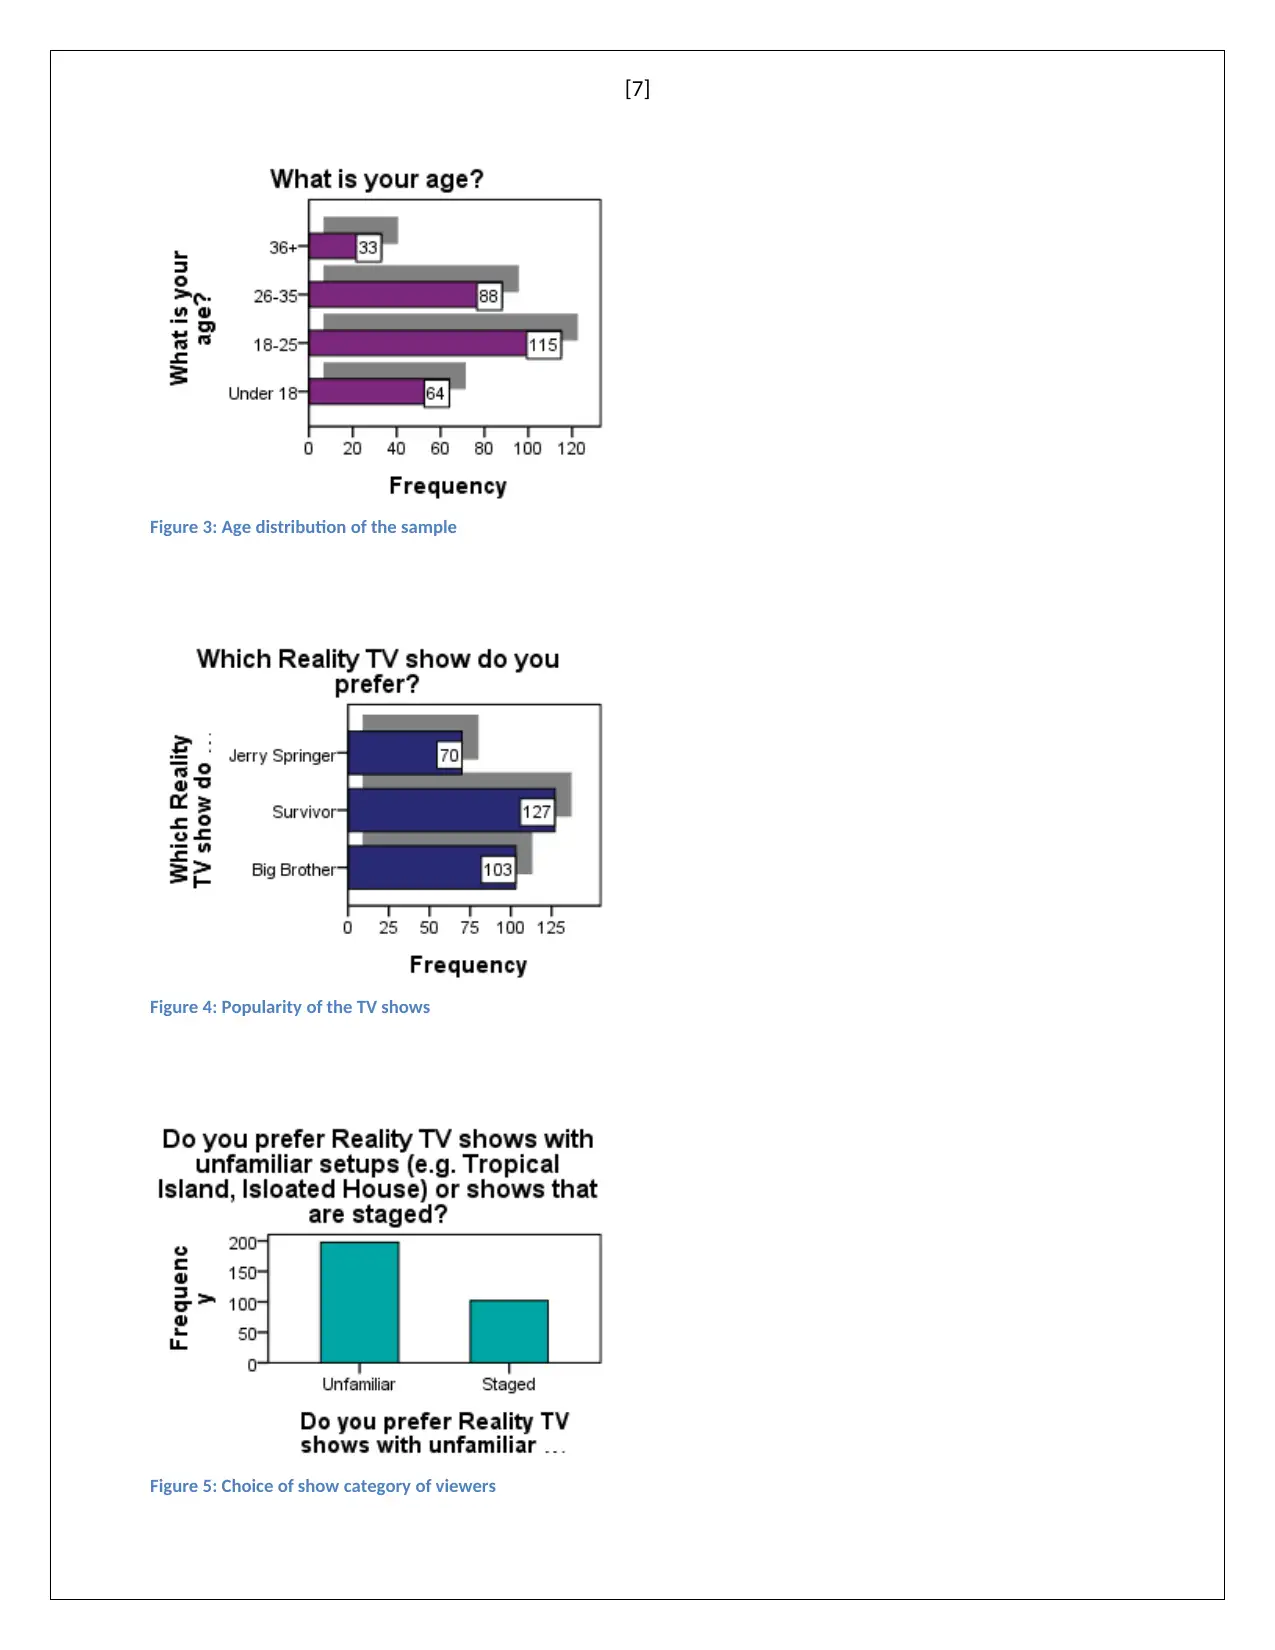
(29.7%) and 211 females (70.3%) in the sample of respondents. Age scrutiny discovered that
most of the participants (N = 115, 38.3%) were in the age group of 18 years to 25 years, whereas
N = 88 (29.3%) participants were in the 26 years to 35 years of age bracket. The lowest number
(N = 33, 11.0%) of participants were in the 36 years and more age group, and there were N = 64
(21.3%) teenagers among the respondents. From the answers of the respondents, the most
popular show was found out as “Survivor” with N =127 (42.3%) viewers. “Big Brother” was
second most popular show with N =103 (34.3%) viewers, followed by “Jerry Springer” with N=
70 (23.3%) audience among the sample. Popularity of the unfamiliar set-up shows was evident
with N = 198 (66.0%) viewers. The staged show comparatively had less numbers of listeners (N
= 102, 34.0%).
Figure 2: Gender distribution of the sample
3.0 Quantitative Exploration
3.1 Sample Analysis
The scholar was able to collect research data, in form of the responses regarding the
impact of TV shows from 300 respondents from the University campus. The one to one
interviews were conducted in a time span of three days with permission from the ethical
committee of the University. The demographic analysis revealed that there were 89 males
(29.7%) and 211 females (70.3%) in the sample of respondents. Age scrutiny discovered that
most of the participants (N = 115, 38.3%) were in the age group of 18 years to 25 years, whereas
N = 88 (29.3%) participants were in the 26 years to 35 years of age bracket. The lowest number
(N = 33, 11.0%) of participants were in the 36 years and more age group, and there were N = 64
(21.3%) teenagers among the respondents. From the answers of the respondents, the most
popular show was found out as “Survivor” with N =127 (42.3%) viewers. “Big Brother” was
second most popular show with N =103 (34.3%) viewers, followed by “Jerry Springer” with N=
70 (23.3%) audience among the sample. Popularity of the unfamiliar set-up shows was evident
with N = 198 (66.0%) viewers. The staged show comparatively had less numbers of listeners (N
= 102, 34.0%).
Figure 2: Gender distribution of the sample
⊘ This is a preview!⊘
Do you want full access?
Subscribe today to unlock all pages.
Trusted by 1+ million students worldwide
[7]
Figure 3: Age distribution of the sample
Figure 4: Popularity of the TV shows
Figure 5: Choice of show category of viewers
Figure 3: Age distribution of the sample
Figure 4: Popularity of the TV shows
Figure 5: Choice of show category of viewers
Paraphrase This Document
Need a fresh take? Get an instant paraphrase of this document with our AI Paraphraser
[8]
3.2 Hypotheses Testing
In the current analysis six hypotheses were tested using appropriate statistical measures
and statistics. The SPSS software environment was used for the statistical evaluation and the
calculated raw data has been provided in the appendices section of the present work.
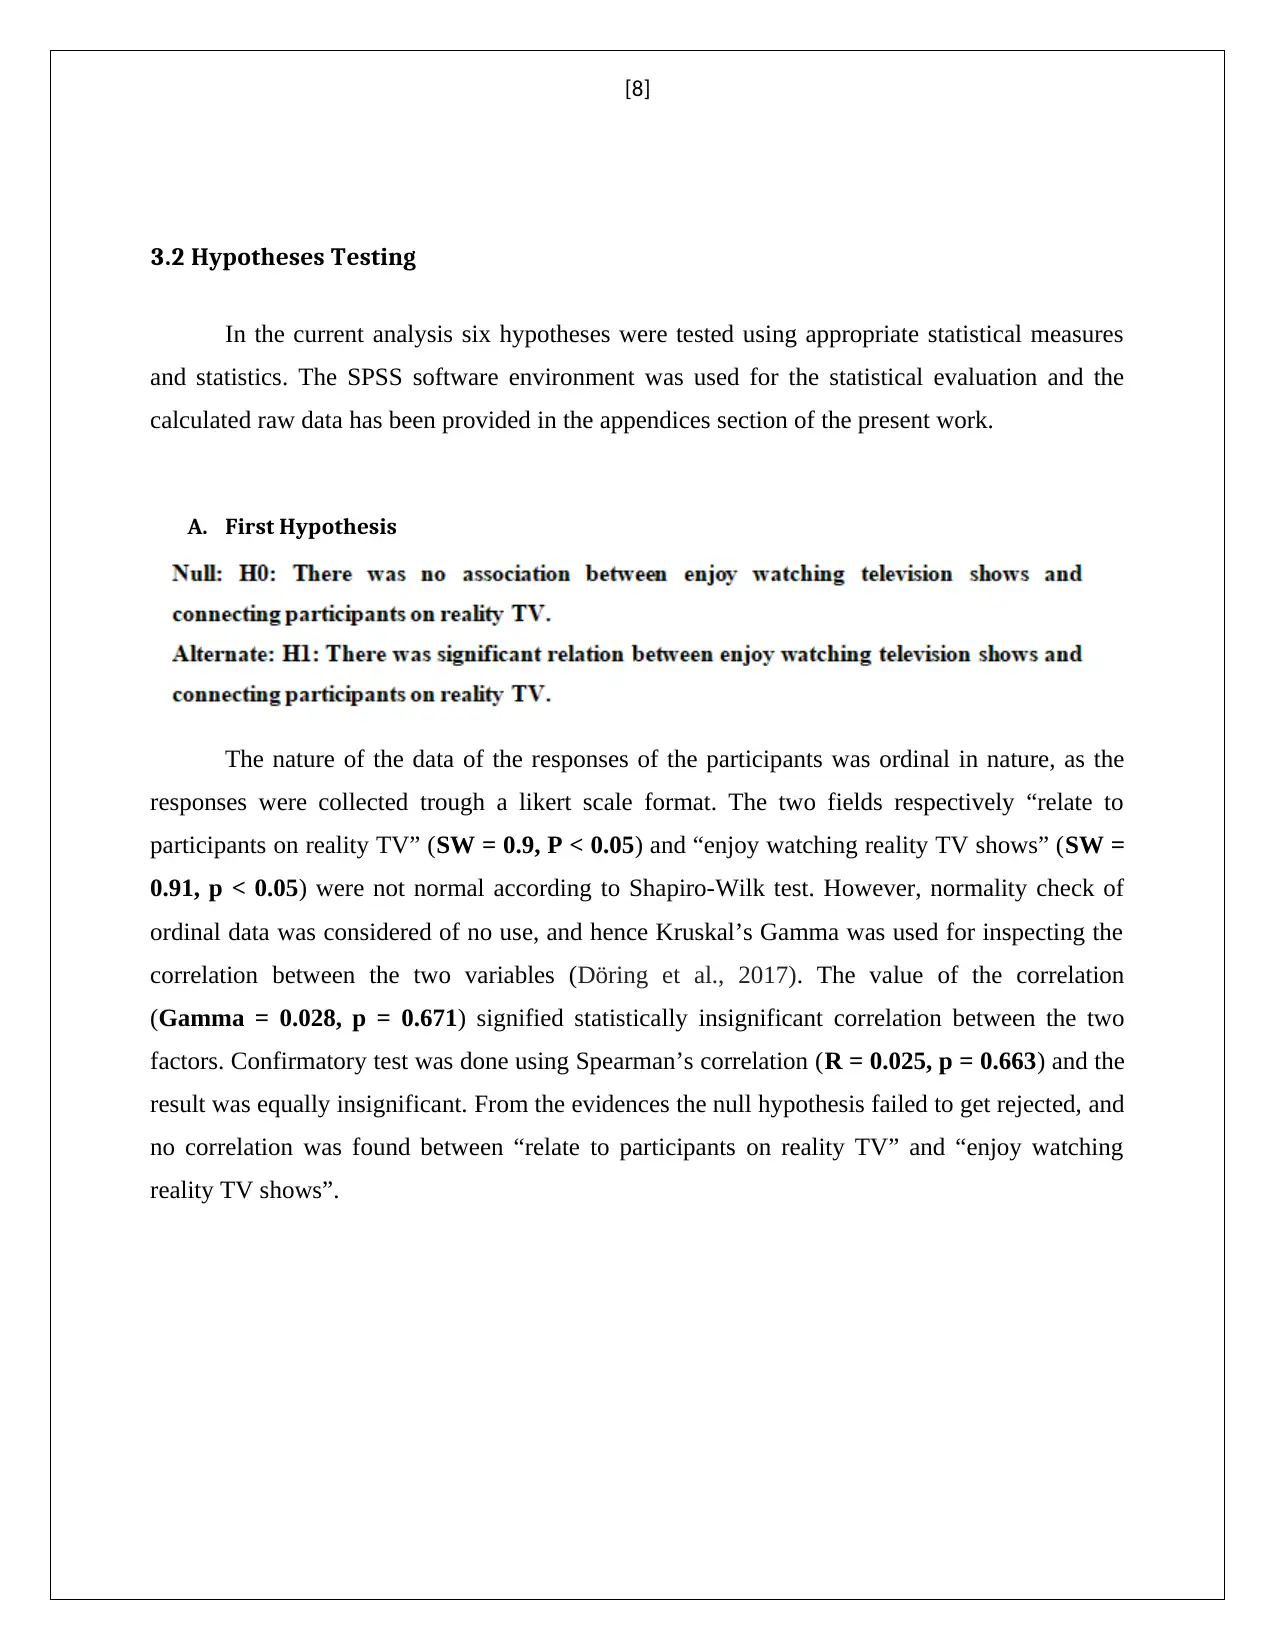
A. First Hypothesis
The nature of the data of the responses of the participants was ordinal in nature, as the
responses were collected trough a likert scale format. The two fields respectively “relate to
participants on reality TV” (SW = 0.9, P < 0.05) and “enjoy watching reality TV shows” (SW =
0.91, p < 0.05) were not normal according to Shapiro-Wilk test. However, normality check of
ordinal data was considered of no use, and hence Kruskal’s Gamma was used for inspecting the
correlation between the two variables (Döring et al., 2017). The value of the correlation
(Gamma = 0.028, p = 0.671) signified statistically insignificant correlation between the two
factors. Confirmatory test was done using Spearman’s correlation (R = 0.025, p = 0.663) and the
result was equally insignificant. From the evidences the null hypothesis failed to get rejected, and
no correlation was found between “relate to participants on reality TV” and “enjoy watching
reality TV shows”.
3.2 Hypotheses Testing
In the current analysis six hypotheses were tested using appropriate statistical measures
and statistics. The SPSS software environment was used for the statistical evaluation and the
calculated raw data has been provided in the appendices section of the present work.
A. First Hypothesis
The nature of the data of the responses of the participants was ordinal in nature, as the
responses were collected trough a likert scale format. The two fields respectively “relate to
participants on reality TV” (SW = 0.9, P < 0.05) and “enjoy watching reality TV shows” (SW =
0.91, p < 0.05) were not normal according to Shapiro-Wilk test. However, normality check of
ordinal data was considered of no use, and hence Kruskal’s Gamma was used for inspecting the
correlation between the two variables (Döring et al., 2017). The value of the correlation
(Gamma = 0.028, p = 0.671) signified statistically insignificant correlation between the two
factors. Confirmatory test was done using Spearman’s correlation (R = 0.025, p = 0.663) and the
result was equally insignificant. From the evidences the null hypothesis failed to get rejected, and
no correlation was found between “relate to participants on reality TV” and “enjoy watching
reality TV shows”.
[9]
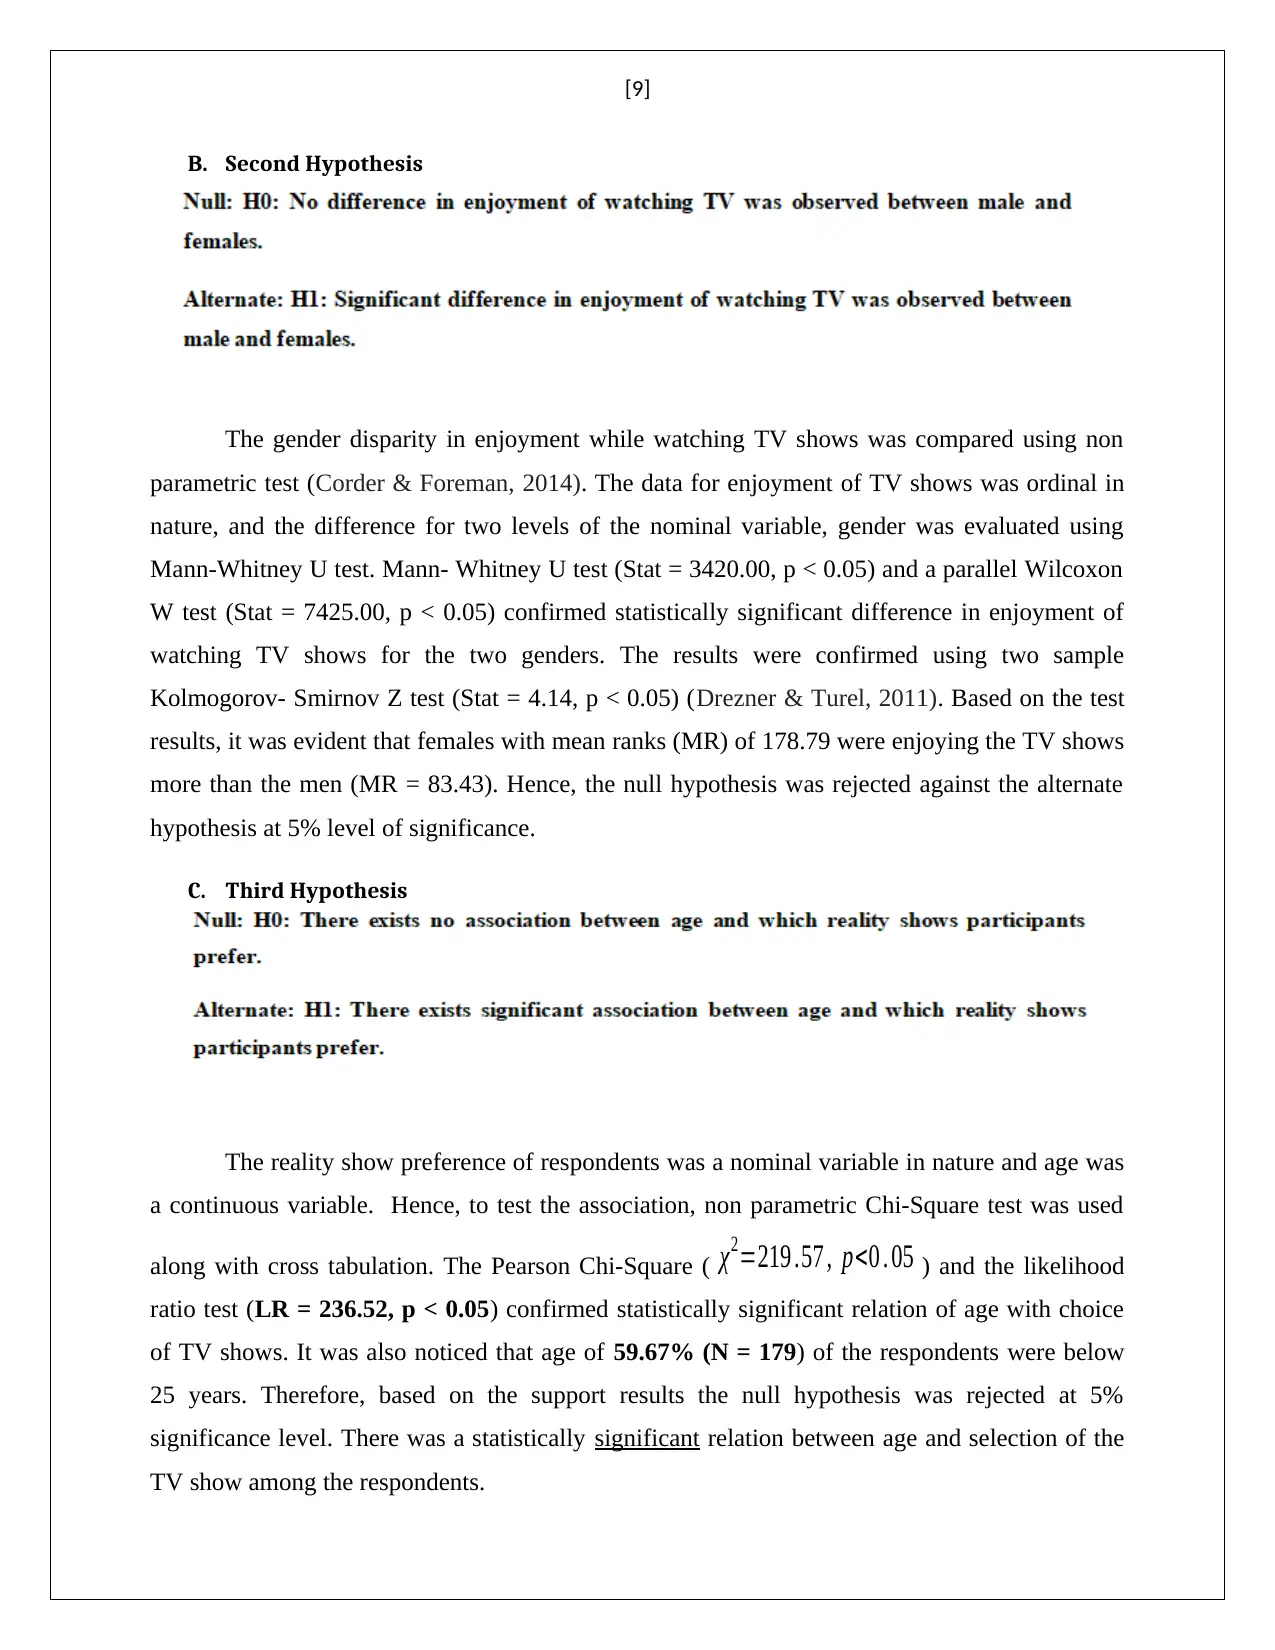
B. Second Hypothesis
The gender disparity in enjoyment while watching TV shows was compared using non
parametric test (Corder & Foreman, 2014). The data for enjoyment of TV shows was ordinal in
nature, and the difference for two levels of the nominal variable, gender was evaluated using
Mann-Whitney U test. Mann- Whitney U test (Stat = 3420.00, p < 0.05) and a parallel Wilcoxon
W test (Stat = 7425.00, p < 0.05) confirmed statistically significant difference in enjoyment of
watching TV shows for the two genders. The results were confirmed using two sample
Kolmogorov- Smirnov Z test (Stat = 4.14, p < 0.05) (Drezner & Turel, 2011). Based on the test
results, it was evident that females with mean ranks (MR) of 178.79 were enjoying the TV shows
more than the men (MR = 83.43). Hence, the null hypothesis was rejected against the alternate
hypothesis at 5% level of significance.
C. Third Hypothesis
The reality show preference of respondents was a nominal variable in nature and age was
a continuous variable. Hence, to test the association, non parametric Chi-Square test was used
along with cross tabulation. The Pearson Chi-Square ( χ2=219 .57 , p<0 . 05 ) and the likelihood
ratio test (LR = 236.52, p < 0.05) confirmed statistically significant relation of age with choice
of TV shows. It was also noticed that age of 59.67% (N = 179) of the respondents were below
25 years. Therefore, based on the support results the null hypothesis was rejected at 5%
significance level. There was a statistically significant relation between age and selection of the
TV show among the respondents.
⊘ This is a preview!⊘
Do you want full access?
Subscribe today to unlock all pages.
Trusted by 1+ million students worldwide
[10]
D. Fourth Hypothesis
Both the factors of the testing were ordinal in nature; hence, non-parametric test was
opted for establishing correlation between the variables (Mayers, 2013). The correlation was
measured by Kendall’s tau-b (Value = 0.016, p = 0.744), and Kruskal’s Gamma (Value = 0.022,
p = 0.744). Spearman correlation (R = 0.019, p = 0.912) also confirmed the results of the above
correlations. A very weak positive correlation was observed between the two ordinal factors, and
statistically the correlation was not significant at 5% level of significance. Hence, based on the
results, null hypothesis failed to get rejected. There was no significant correlation between
enjoyment of the TV shows and delineation of real life in a reality TV show.
E. Fifth Hypothesis
Testing of the above hypothesis at 5% level of significance was done using non-
parametric Wilcoxon Signed Ranks test for the two ordinal factors. Three test conditions were
evaluated for average ranks. The mean negative ranks between “Depicting real life behaviors on
reality TV” and “Having attractive participants on reality TV is important” was 89.45 (N = 92),
whereas the mean for positive ranks was 132.87 (N = 138). The Wilcox Signed Rank test
statistics (Z = -5.106, p < 0.05) established the alternate hypothesis. The null hypothesis was
rejected at 5% level of significance, and a statistically significant difference was observed
between the variables.
Paraphrase This Document
Need a fresh take? Get an instant paraphrase of this document with our AI Paraphraser
[11]
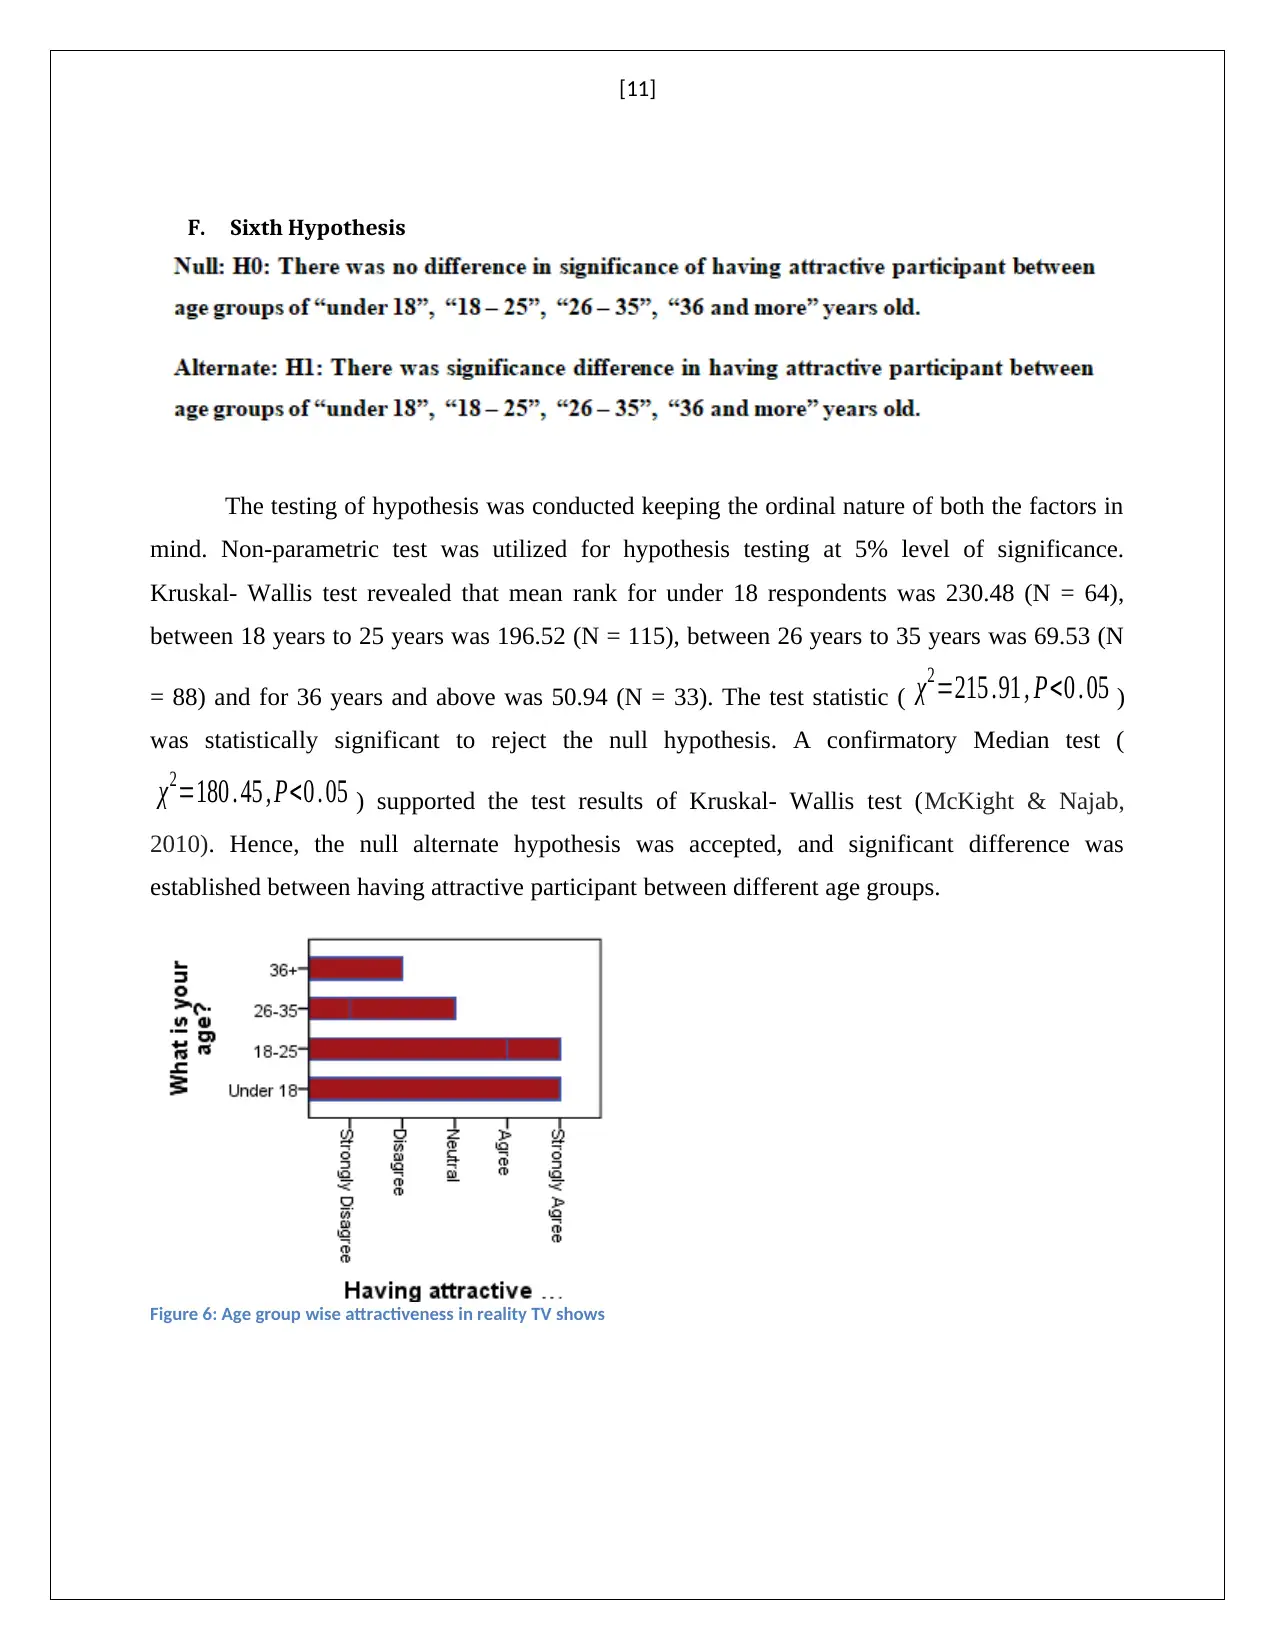
F. Sixth Hypothesis
The testing of hypothesis was conducted keeping the ordinal nature of both the factors in
mind. Non-parametric test was utilized for hypothesis testing at 5% level of significance.
Kruskal- Wallis test revealed that mean rank for under 18 respondents was 230.48 (N = 64),
between 18 years to 25 years was 196.52 (N = 115), between 26 years to 35 years was 69.53 (N
= 88) and for 36 years and above was 50.94 (N = 33). The test statistic ( χ2=215 .91 , P<0 . 05 )
was statistically significant to reject the null hypothesis. A confirmatory Median test (
χ2=180 . 45 , P<0 . 05 ) supported the test results of Kruskal- Wallis test (McKight & Najab,
2010). Hence, the null alternate hypothesis was accepted, and significant difference was
established between having attractive participant between different age groups.
Figure 6: Age group wise attractiveness in reality TV shows
[12]
4.0 Discussion
The qualitative and quantitative data analysis was in line with each other. The qualitative
analysis revealed that the respondents were disturbed about the genuineness of the content of the
shows. The “attitude” towards the “authenticity” of the reality shows was addressed based on the
transcript description of the respondents. The consequences of the real life TV programs were
addressed in the second half of the qualitative analysis, where the respondents’ views on
negative impact of the shows on the society, especially on the children got reflected. The general
awareness about the ways and programs of entertainment in television was eminent from the
discussion in the transcript.
The quantitative analysis sustained the outcome of the qualitative scrutiny. Hypothesis
wise elaboration revealed that, significant relation was missing between enjoyments of TV
viewing and relating participants of the TV shows (H1). Significant gender difference was
observed in enjoyment from TV programs (H2), whereas, no relation was found between
delineation of real life in a reality show and enjoyment of the TV programs (H4). The
noteworthy relation between age groups and reality TV show preference (H3) critically
acclaimed the transcript discussions of the respondents. Age group was an important factor in
importance of attractive participant (H6), and relation of importance of attractive participant with
enjoyment of reality TV shows (H5) was equally important (Lundy, Ruth & Park, 2008).
⊘ This is a preview!⊘
Do you want full access?
Subscribe today to unlock all pages.
Trusted by 1+ million students worldwide
1 out of 24


Your All-in-One AI-Powered Toolkit for Academic Success.
+13062052269
info@desklib.com
Available 24*7 on WhatsApp / Email
![[object Object]](/_next/static/media/star-bottom.7253800d.svg)
Unlock your academic potential
Copyright © 2020–2026 A2Z Services. All Rights Reserved. Developed and managed by ZUCOL.