Statistical Analysis of NBN Internet Speed: MAT10251 Project Report

Verified

Added on  2022/08/17

|9
|1207
|14
Report
AI Summary
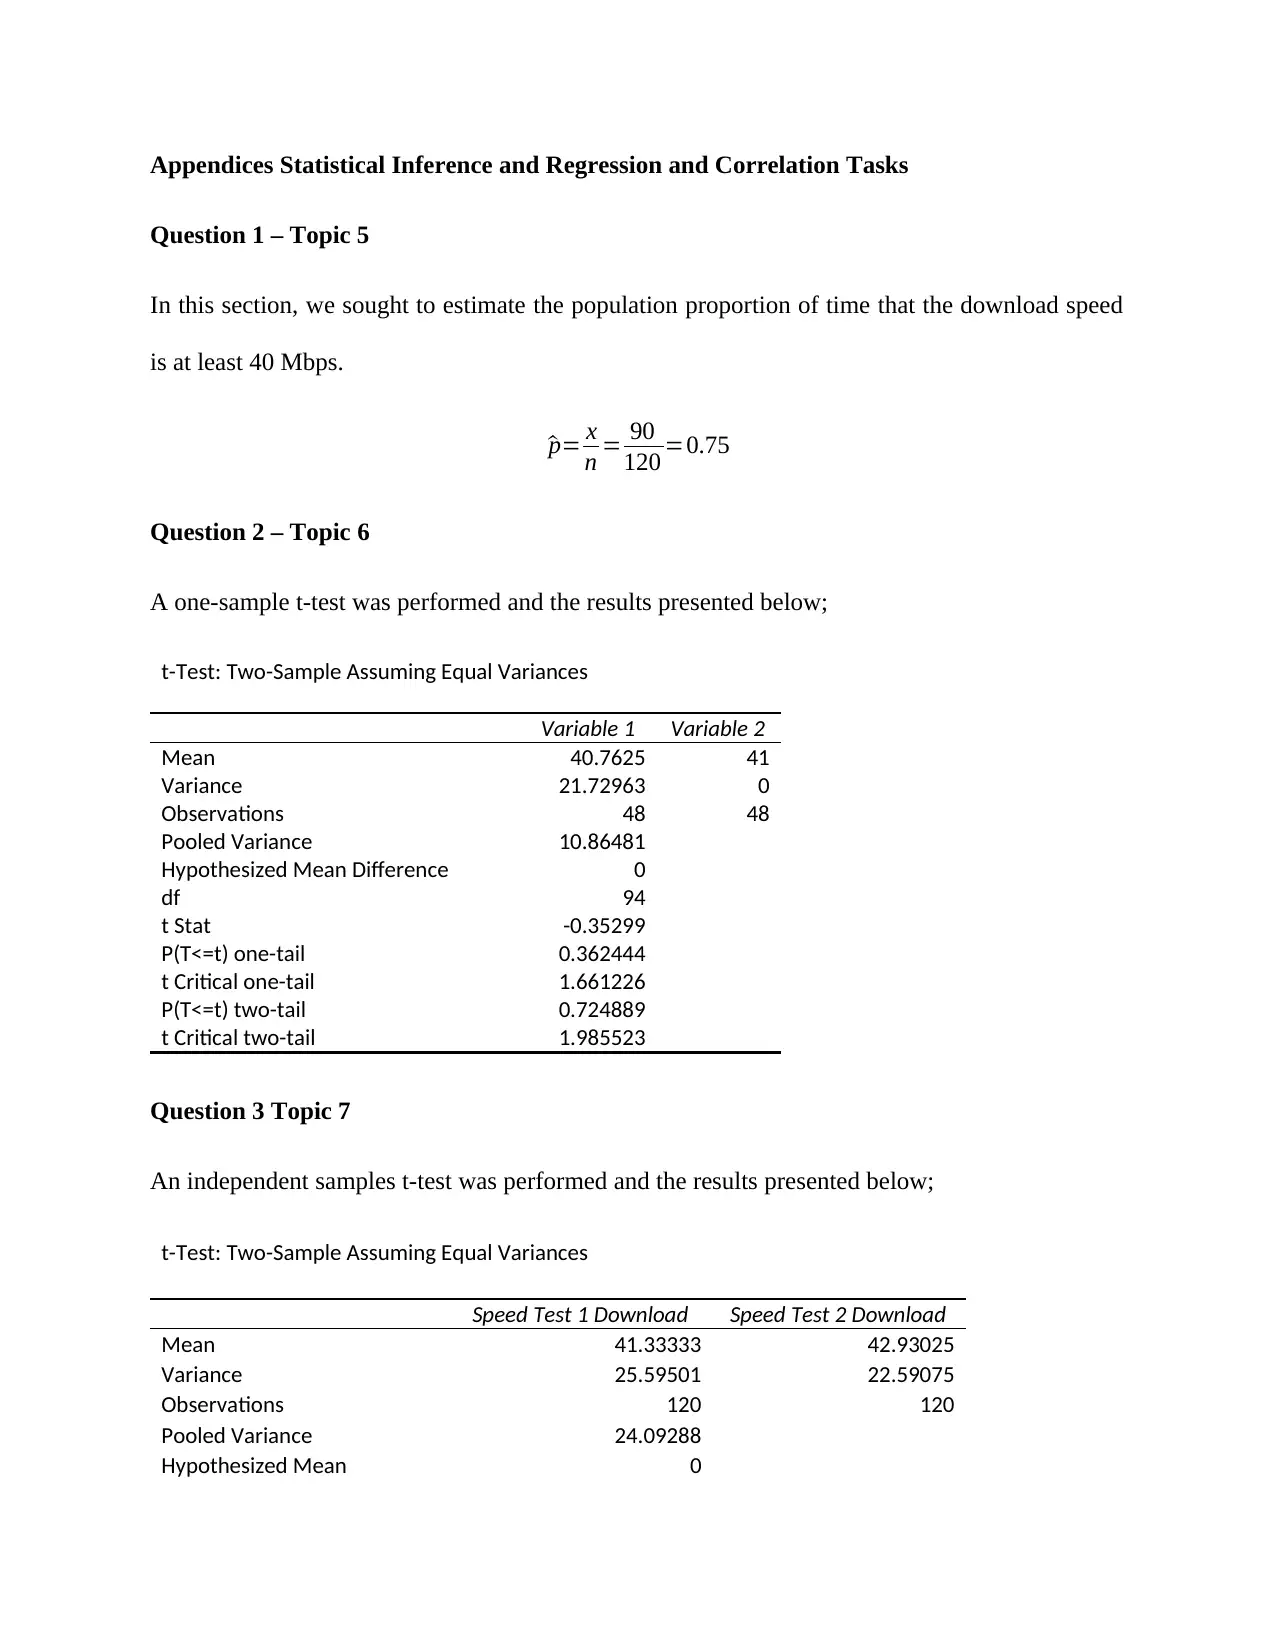
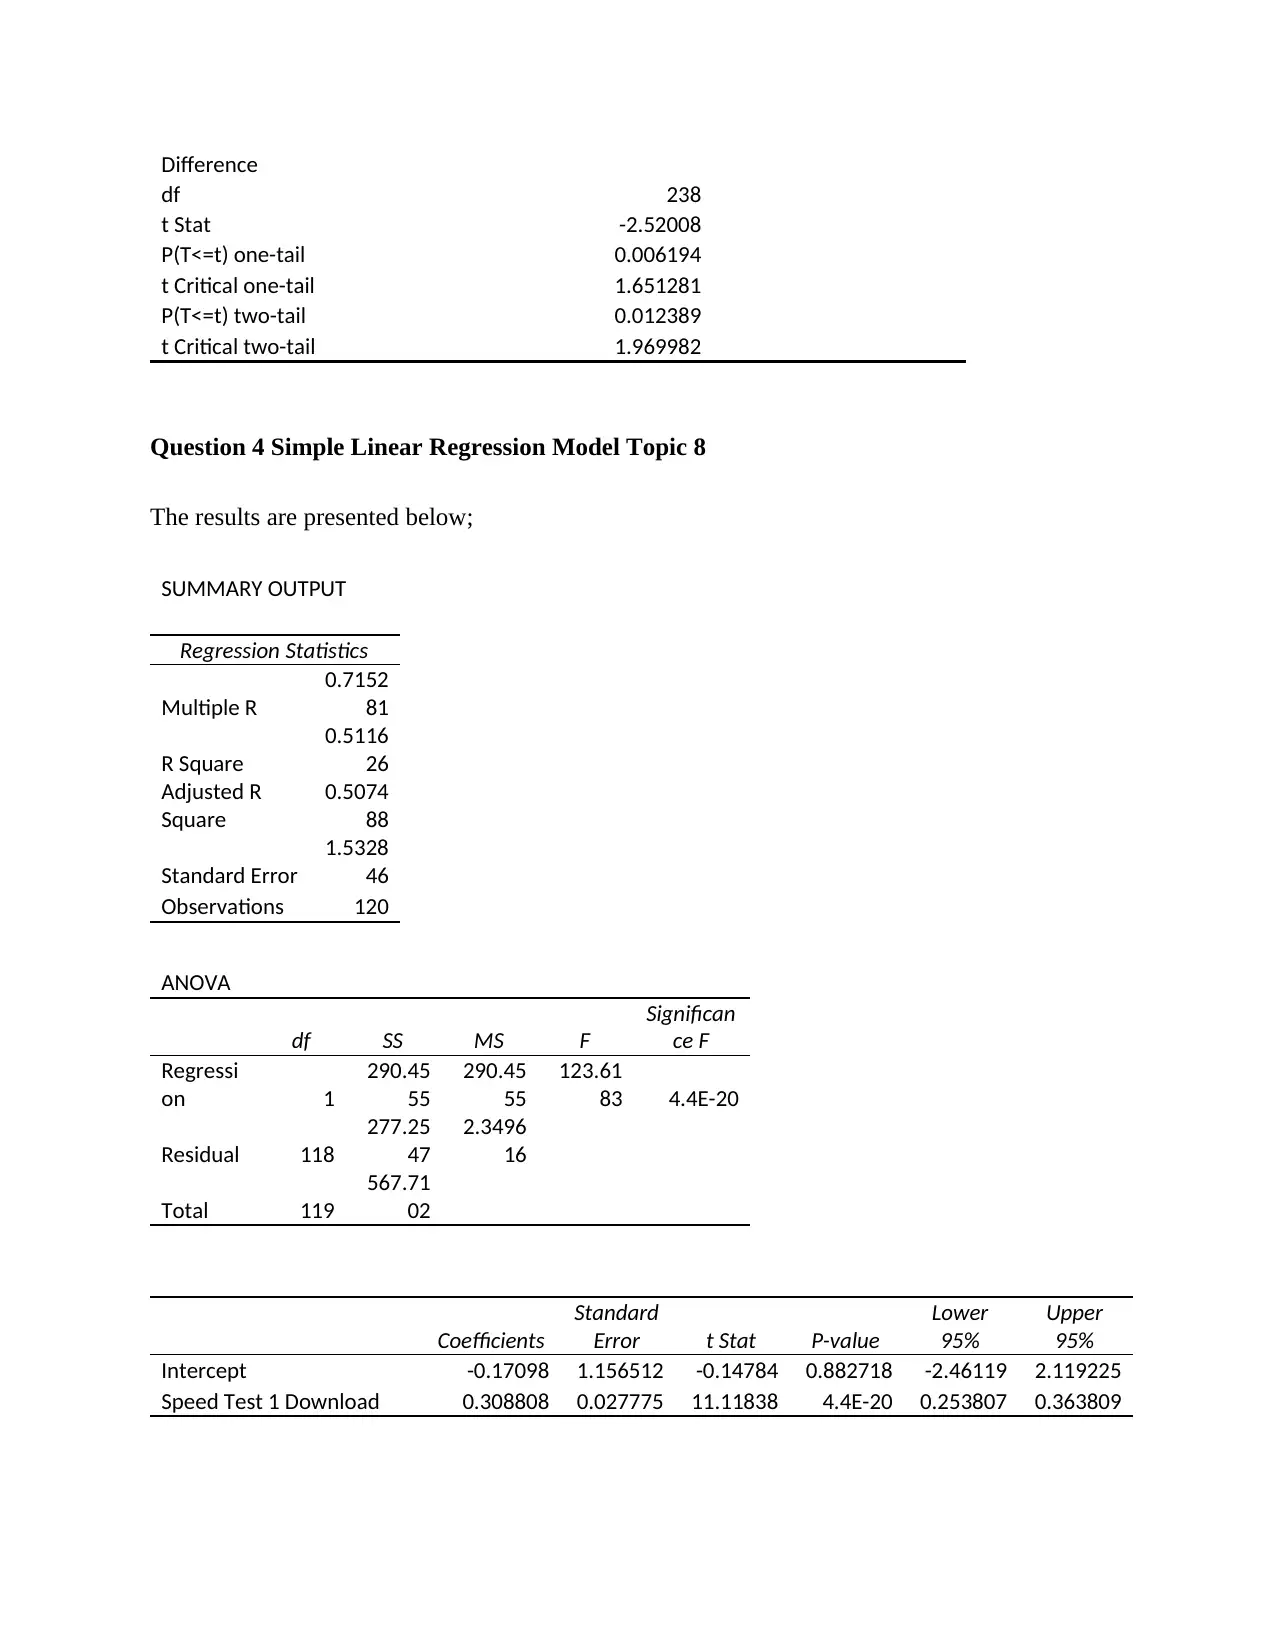
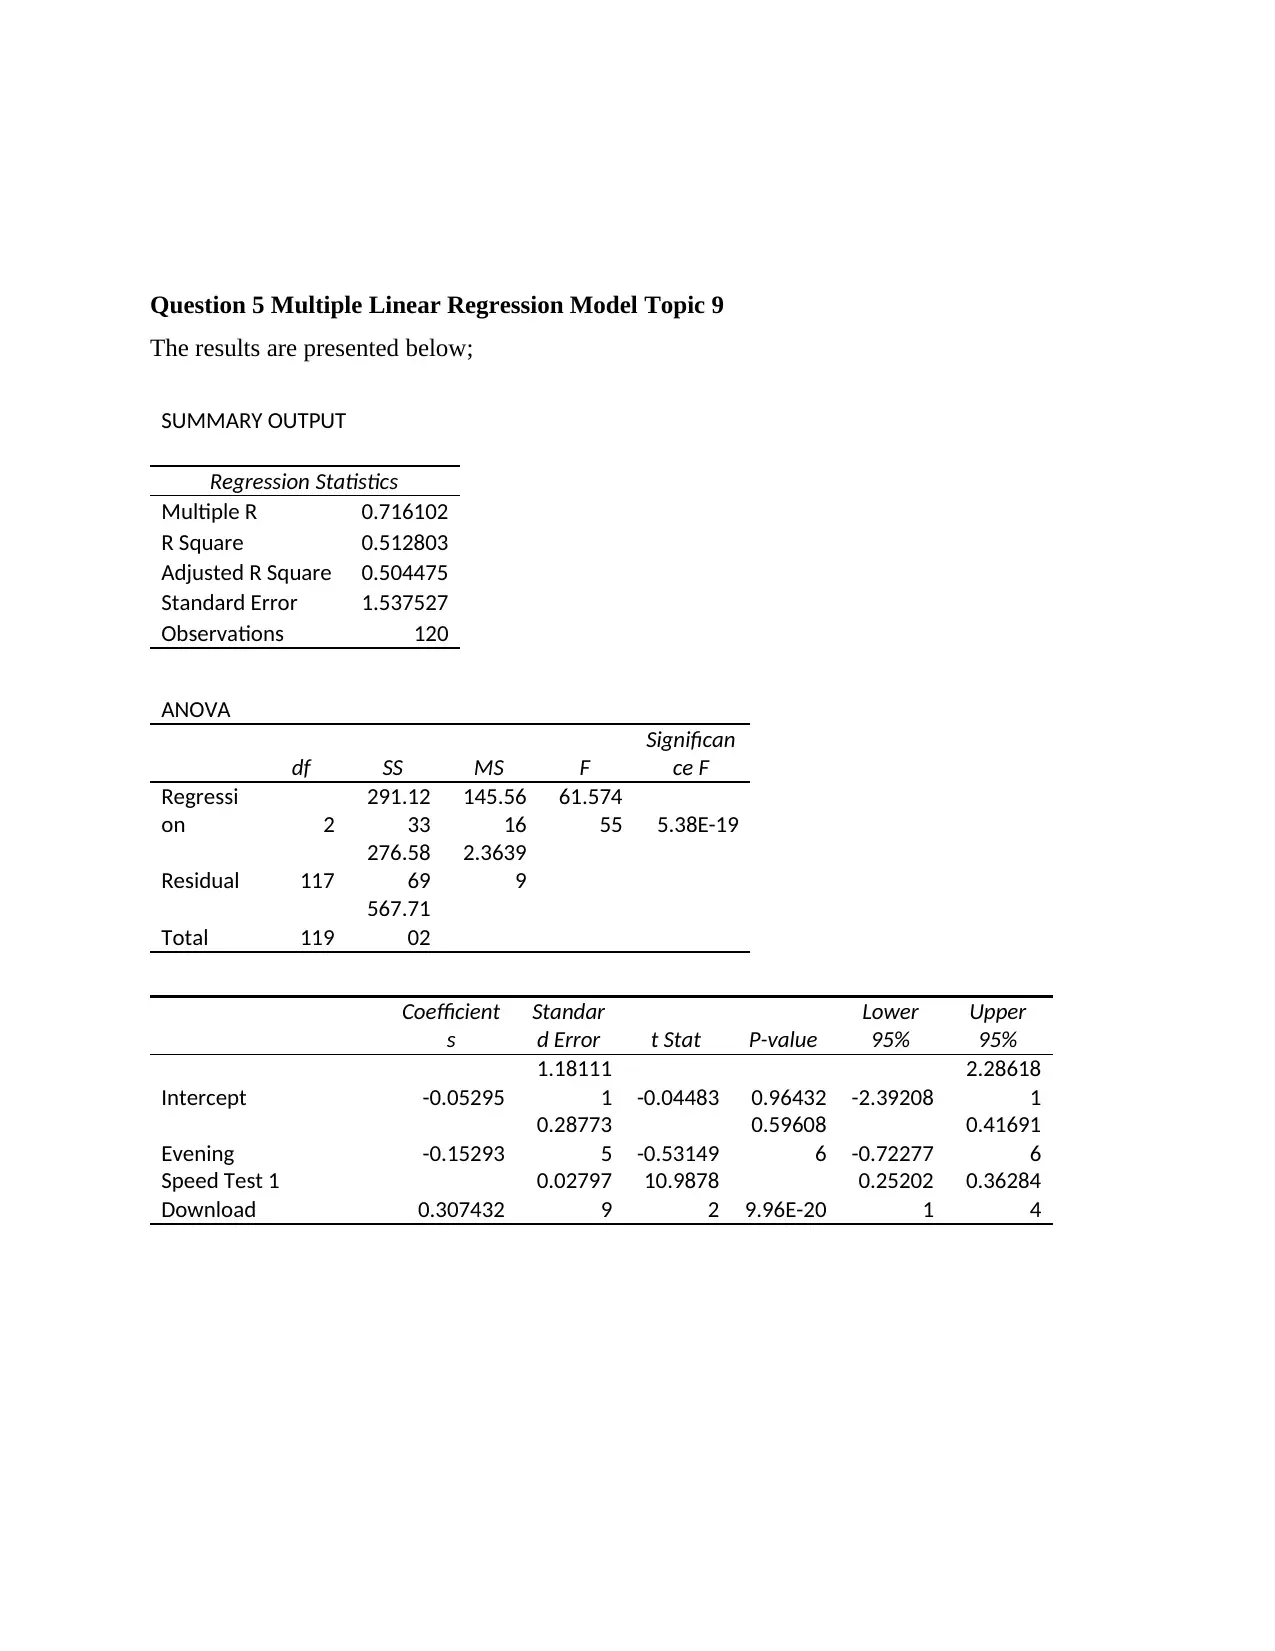
This report presents a statistical analysis of internet speed data for the National Broadband Network (NBN) 50 plan, focusing on download and upload speeds. The analysis addresses key questions through inferential statistics, including estimating the population proportion of download speeds exceeding 40 Mbps, and determining if average evening download speeds meet the advertised rate. Hypothesis testing is used to compare download speeds across different tests and to investigate the relationship between download and upload speeds using regression analysis. The report also examines the influence of evening hours on upload speeds, finding the dummy variable for evening to be insignificant. The results provide insights into the performance characteristics of the NBN 50 plan, with a detailed appendix including the statistical inference and regression and correlation tasks with their respective results.
Document Page
MAT10251 STATISTICAL ANALYSIS
PROJECT – PART B
tabler-icon-diamond-filled.svg

Paraphrase This Document

Need a fresh take? Get an instant paraphrase of this document with our AI Paraphraser
Document Page
Task 2 - Written Answer – Email or letter
5th February 2020
Managing Director,
National Broadband Network (NBN),
Dear Sir/Madam,
RE: REPORT ON INTERNET SPEED
I am writing to present to you the results of the study that sought to analyze the internet speed.
This report presents statistical analysis of internet speed data with an aim of answering critical
questions on internet speed. The analysis focusses on a 50 plan by National Broadband Network
(NBN). The plan gives a maximum download speed of 50 Mbps (megabits per second) and a
maximum upload speed of 20 Mbps. We ran inferential analysis to determine how the download
and upload speeds compares and relates.
The first question sought to estimate the population proportion of time that the download speed
is at least 40 Mbps. Results showed that 75% of the samples had download speed equal to or
more than 40 Mbps.
The second question sought to find out if on average the evening download speed exceeds the
advertised typical evening download speed of 41 Mbps.
The hypothesis to be tested as follows;
H0 : μ=41
H A : μ> 41
Document Page
The results showed that the average speed download for the evening was 40.76 (SD = 4.66). The
p-value was found to be 1-0.362=0.638 (a value greater than 5% level of significance), we
therefore fail to reject the null hypothesis and conclude that the average evening download speed
does not exceed the advertised typical evening download speed of 41 Mbps.
The third question sought to investigate whether there is a difference in the average download
speed by the Speed Test 1 Download and Speed Test 2 Download. The hypothesis that we
sought to test is as follows;
H0 : μ1=μ2
H A : μ1 μ2
The results showed that the average download speed for test 1 was 41.33 (SD = 5.06) while the
average download speed for test 2 was 42.93 (SD = 4.75). The p-value was found to be 0.012 (a
value less than 5% level of significance), we therefore reject the null hypothesis and conclude
that the average Speed Test 1 Download and Speed Test 2 Download are statistically different.
The average Speed Test 1 Download was significantly less than the average Speed Test 2
Download.
The forth question sought to explore the relationship between download and upload speed use
Speed Test 1 Download as the independent variable with Speed Test 1 Upload as the dependent
variable for all 120 observations.
The estimated equation was estimated as follows;
Speed Test 1 Upload=0.171+0.3088( Speed Test 2 Download)
From the above results, the coefficient of determination is given as 0.511626; this implies that
51.16% of the variation in the speed test 1 upload is explained by the speed test 1 download.
Document Page
The gradient intercept is given as -0.171; this implies that holding speed test 1 download
constant we would expect the speed test 1 download to be -0.171.
The vertical intercept is given as 0.3088; this implies that a unit increase in the speed test 1
download would result in an increase in the speed test 1 upload by 0.3088. Similarly, a unit
decrease in the speed test 1 download would result in a decrease in the speed test 1 upload by
0.3088.
The fifth and the last question sought to whether being evening (7 pm to 11 pm) or not also
influences upload speed by adding Evening as a second independent variable for all 120
observations.
The estimated equation is given as follows;
Speed Test 1 Upload=0.053+0.3074 ( Speed Test 2 Download ) 0.153( Evening)
From the above results, the coefficient of determination is given as 0.5128; this implies that
51.28% of the variation in the speed test 1 upload is explained by the two independent variables
(speed test 1 download and the dummy variable evening) in the model.
The gradient intercept is given as -0.053; this implies that holding speed test 1 download and the
dummy variable for evening constant we would expect the speed test 1 download to be -0.053.
The coefficient of speed test 1 download is given as 0.3074; this implies that a unit increase in
the speed test 1 download would result in an increase in the speed test 1 upload by 0.3074.
Similarly, a unit decrease in the speed test 1 download would result in a decrease in the speed
test 1 upload by 0.3074.
The coefficient of evening is given as -0.153; this implies that being evening would be expected
to have a lower speed test 1 upload by 0.153.
tabler-icon-diamond-filled.svg

Paraphrase This Document

Need a fresh take? Get an instant paraphrase of this document with our AI Paraphraser
Document Page
It was observed that the dummy variable for evening was insignificant in the model (p > 0.05)
while the speed test 1 download was significant in the model (p < 0.05).
Based on the results, the simple equation was found to be the best fit.
Yours faithfully
SDA
Senior Data Analyst
Document Page
Appendices Statistical Inference and Regression and Correlation Tasks
Question 1 – Topic 5
In this section, we sought to estimate the population proportion of time that the download speed
is at least 40 Mbps.
^p= x
n = 90
120 =0.75
Question 2 – Topic 6
A one-sample t-test was performed and the results presented below;
t-Test: Two-Sample Assuming Equal Variances
Variable 1 Variable 2
Mean 40.7625 41
Variance 21.72963 0
Observations 48 48
Pooled Variance 10.86481
Hypothesized Mean Difference 0
df 94
t Stat -0.35299
P(T<=t) one-tail 0.362444
t Critical one-tail 1.661226
P(T<=t) two-tail 0.724889
t Critical two-tail 1.985523
Question 3 Topic 7
An independent samples t-test was performed and the results presented below;
t-Test: Two-Sample Assuming Equal Variances
Speed Test 1 Download Speed Test 2 Download
Mean 41.33333 42.93025
Variance 25.59501 22.59075
Observations 120 120
Pooled Variance 24.09288
Hypothesized Mean 0
Document Page
Difference
df 238
t Stat -2.52008
P(T<=t) one-tail 0.006194
t Critical one-tail 1.651281
P(T<=t) two-tail 0.012389
t Critical two-tail 1.969982
Question 4 Simple Linear Regression Model Topic 8
The results are presented below;
SUMMARY OUTPUT
Regression Statistics
Multiple R
0.7152
81
R Square
0.5116
26
Adjusted R
Square
0.5074
88
Standard Error
1.5328
46
Observations 120
ANOVA
df SS MS F
Significan
ce F
Regressi
on 1
290.45
55
290.45
55
123.61
83 4.4E-20
Residual 118
277.25
47
2.3496
16
Total 119
567.71
02
Coefficients
Standard
Error t Stat P-value
Lower
95%
Upper
95%
Intercept -0.17098 1.156512 -0.14784 0.882718 -2.46119 2.119225
Speed Test 1 Download 0.308808 0.027775 11.11838 4.4E-20 0.253807 0.363809
tabler-icon-diamond-filled.svg

Paraphrase This Document

Need a fresh take? Get an instant paraphrase of this document with our AI Paraphraser
Document Page
Question 5 Multiple Linear Regression Model Topic 9
The results are presented below;
SUMMARY OUTPUT
Regression Statistics
Multiple R 0.716102
R Square 0.512803
Adjusted R Square 0.504475
Standard Error 1.537527
Observations 120
ANOVA
df SS MS F
Significan
ce F
Regressi
on 2
291.12
33
145.56
16
61.574
55 5.38E-19
Residual 117
276.58
69
2.3639
9
Total 119
567.71
02
Coefficient
s
Standar
d Error t Stat P-value
Lower
95%
Upper
95%
Intercept -0.05295
1.18111
1 -0.04483 0.96432 -2.39208
2.28618
1
Evening -0.15293
0.28773
5 -0.53149
0.59608
6 -0.72277
0.41691
6
Speed Test 1
Download 0.307432
0.02797
9
10.9878
2 9.96E-20
0.25202
1
0.36284
4
Document Page
chevron_up_icon
1 out of 9
circle_padding
hide_on_mobile
zoom_out_icon
[object Object]