Interpreting Negative Values in Velocity-Time Graphs
VerifiedAdded on 2020/05/28
|10
|573
|30
AI Summary
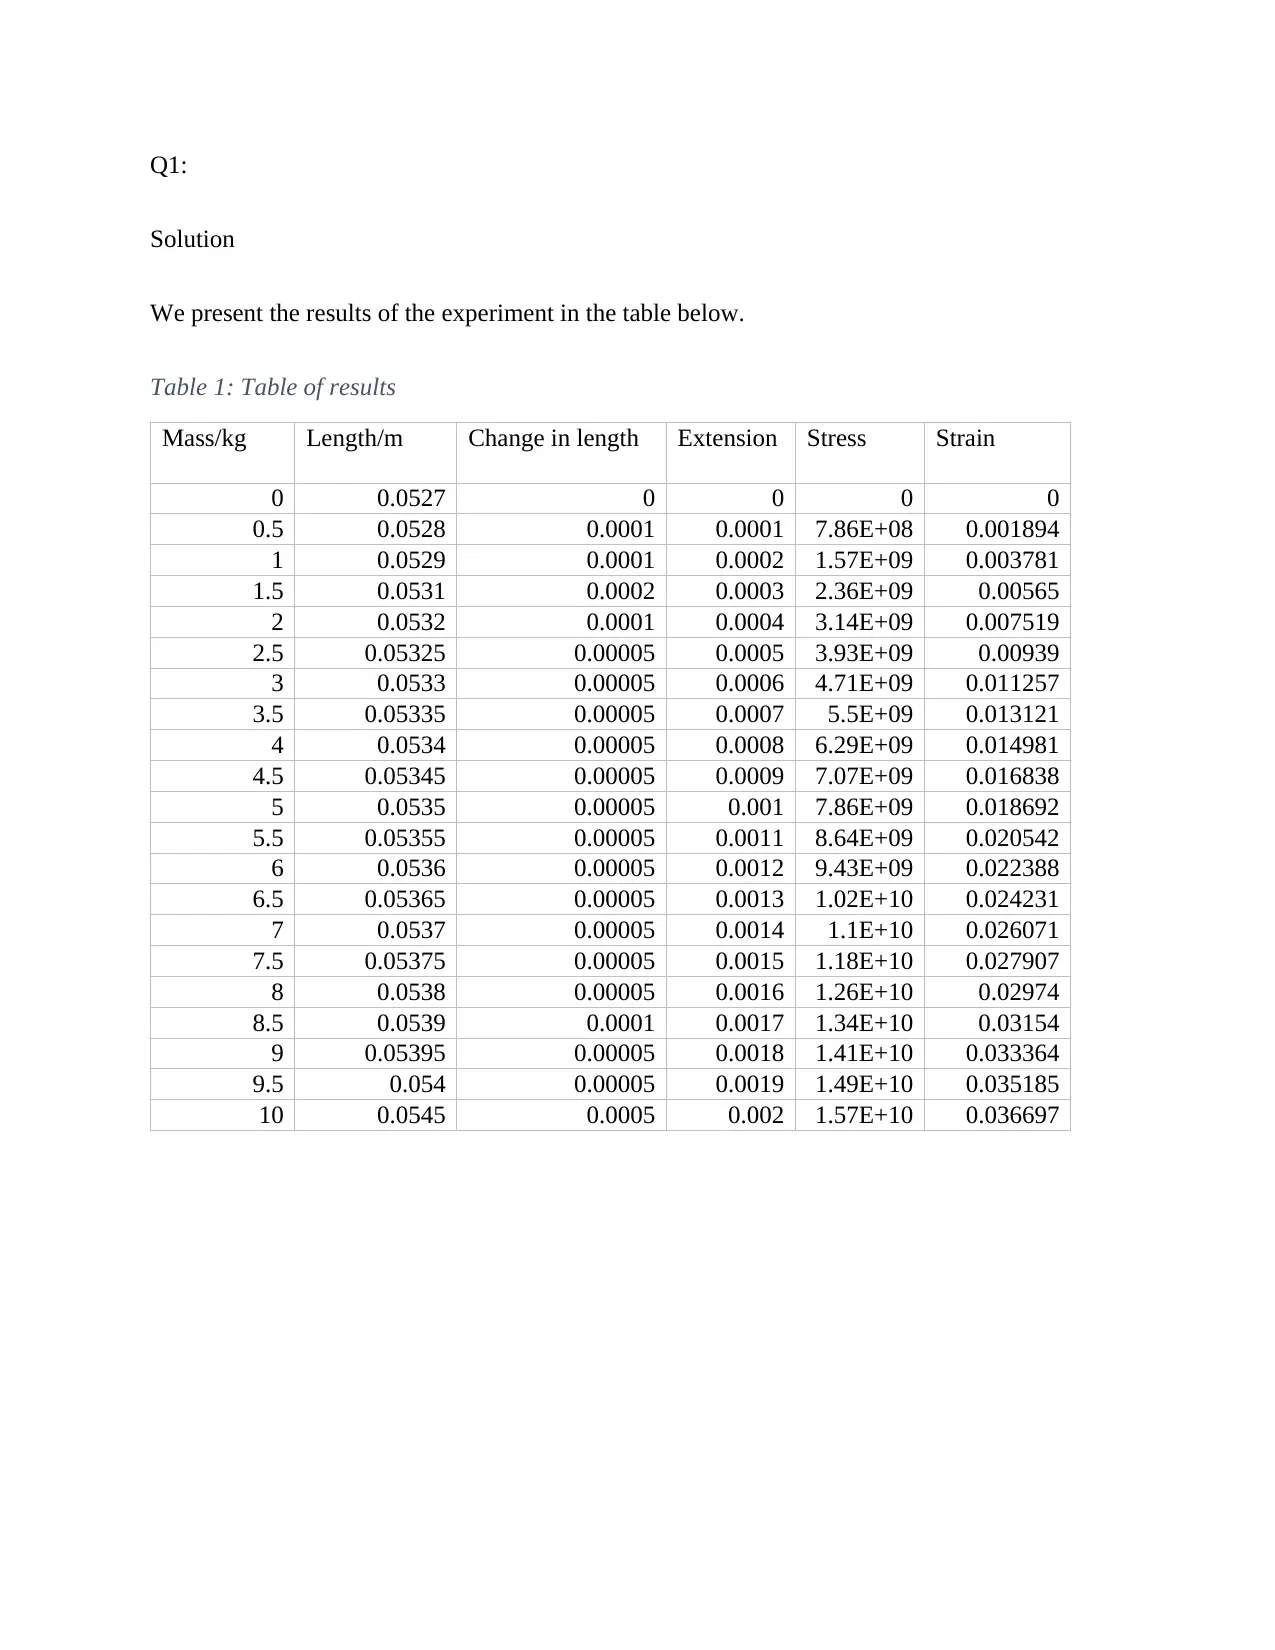
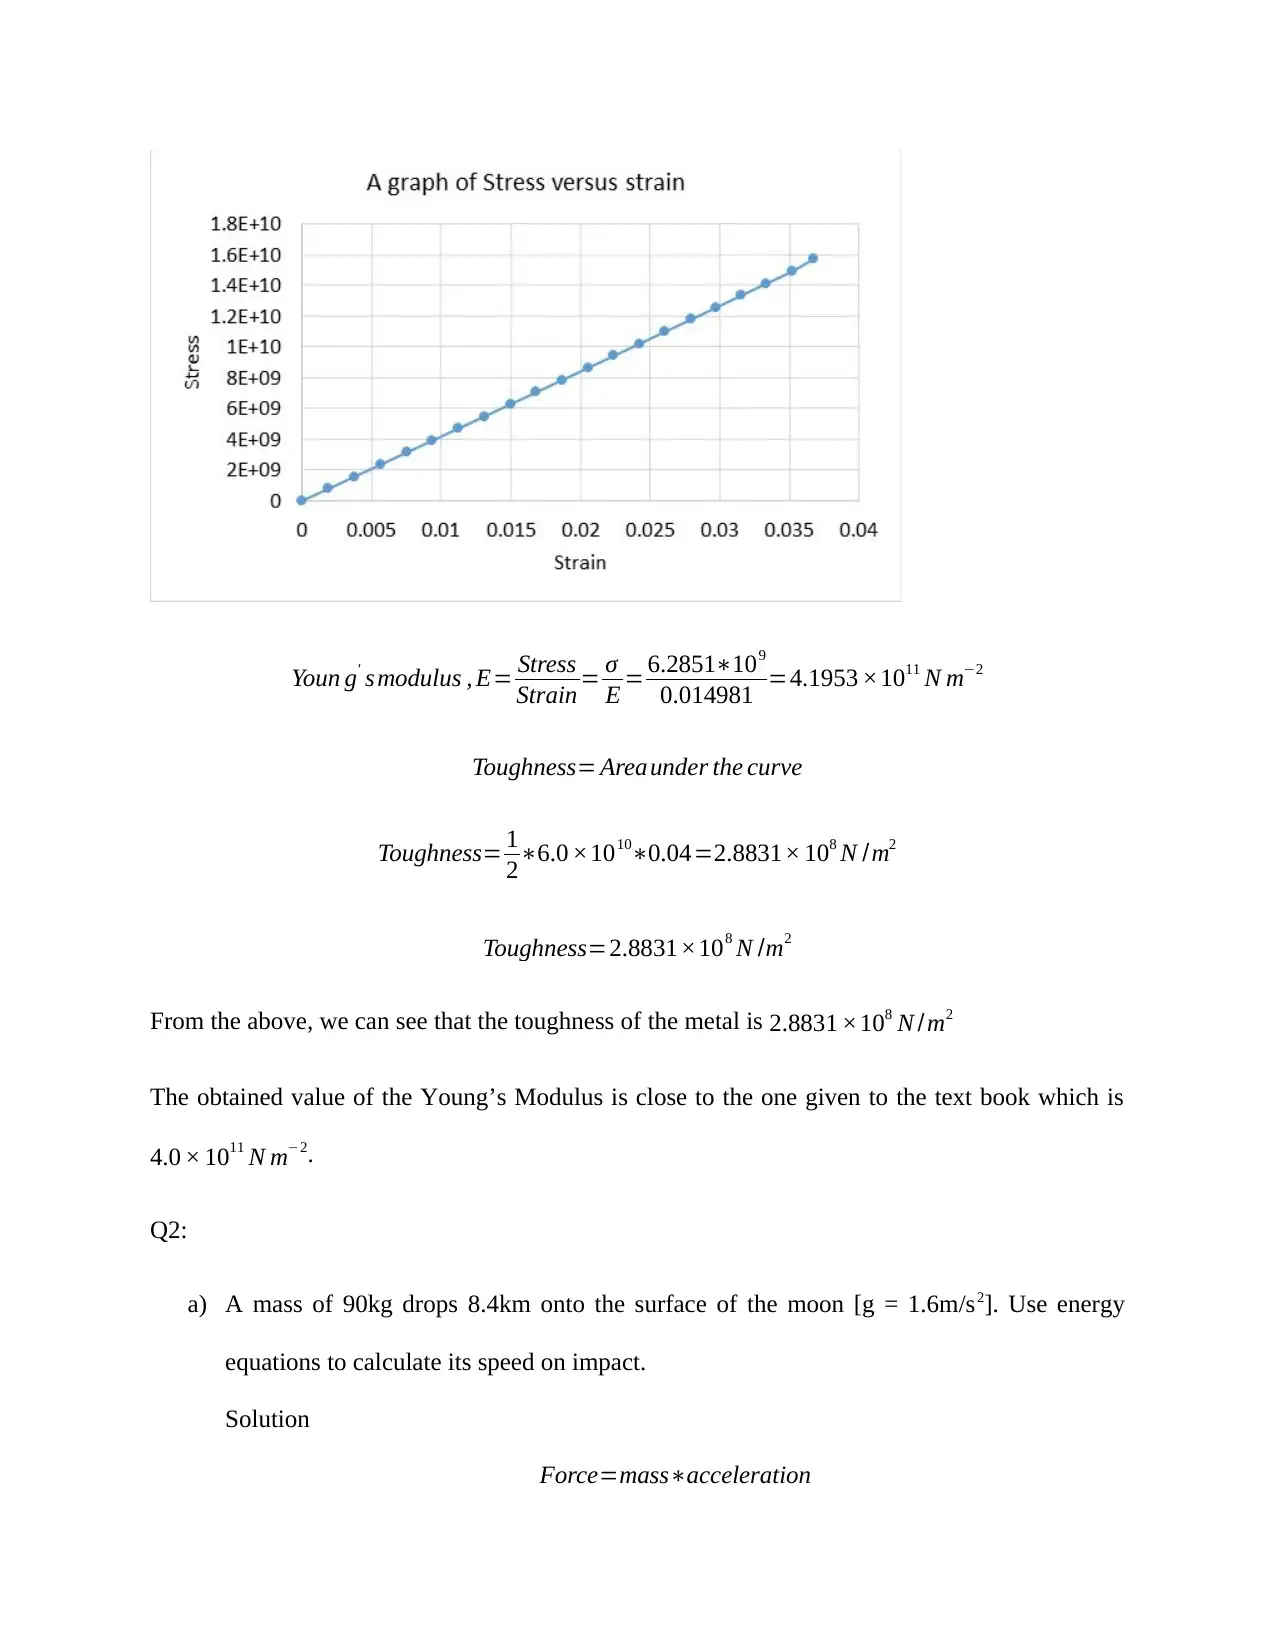
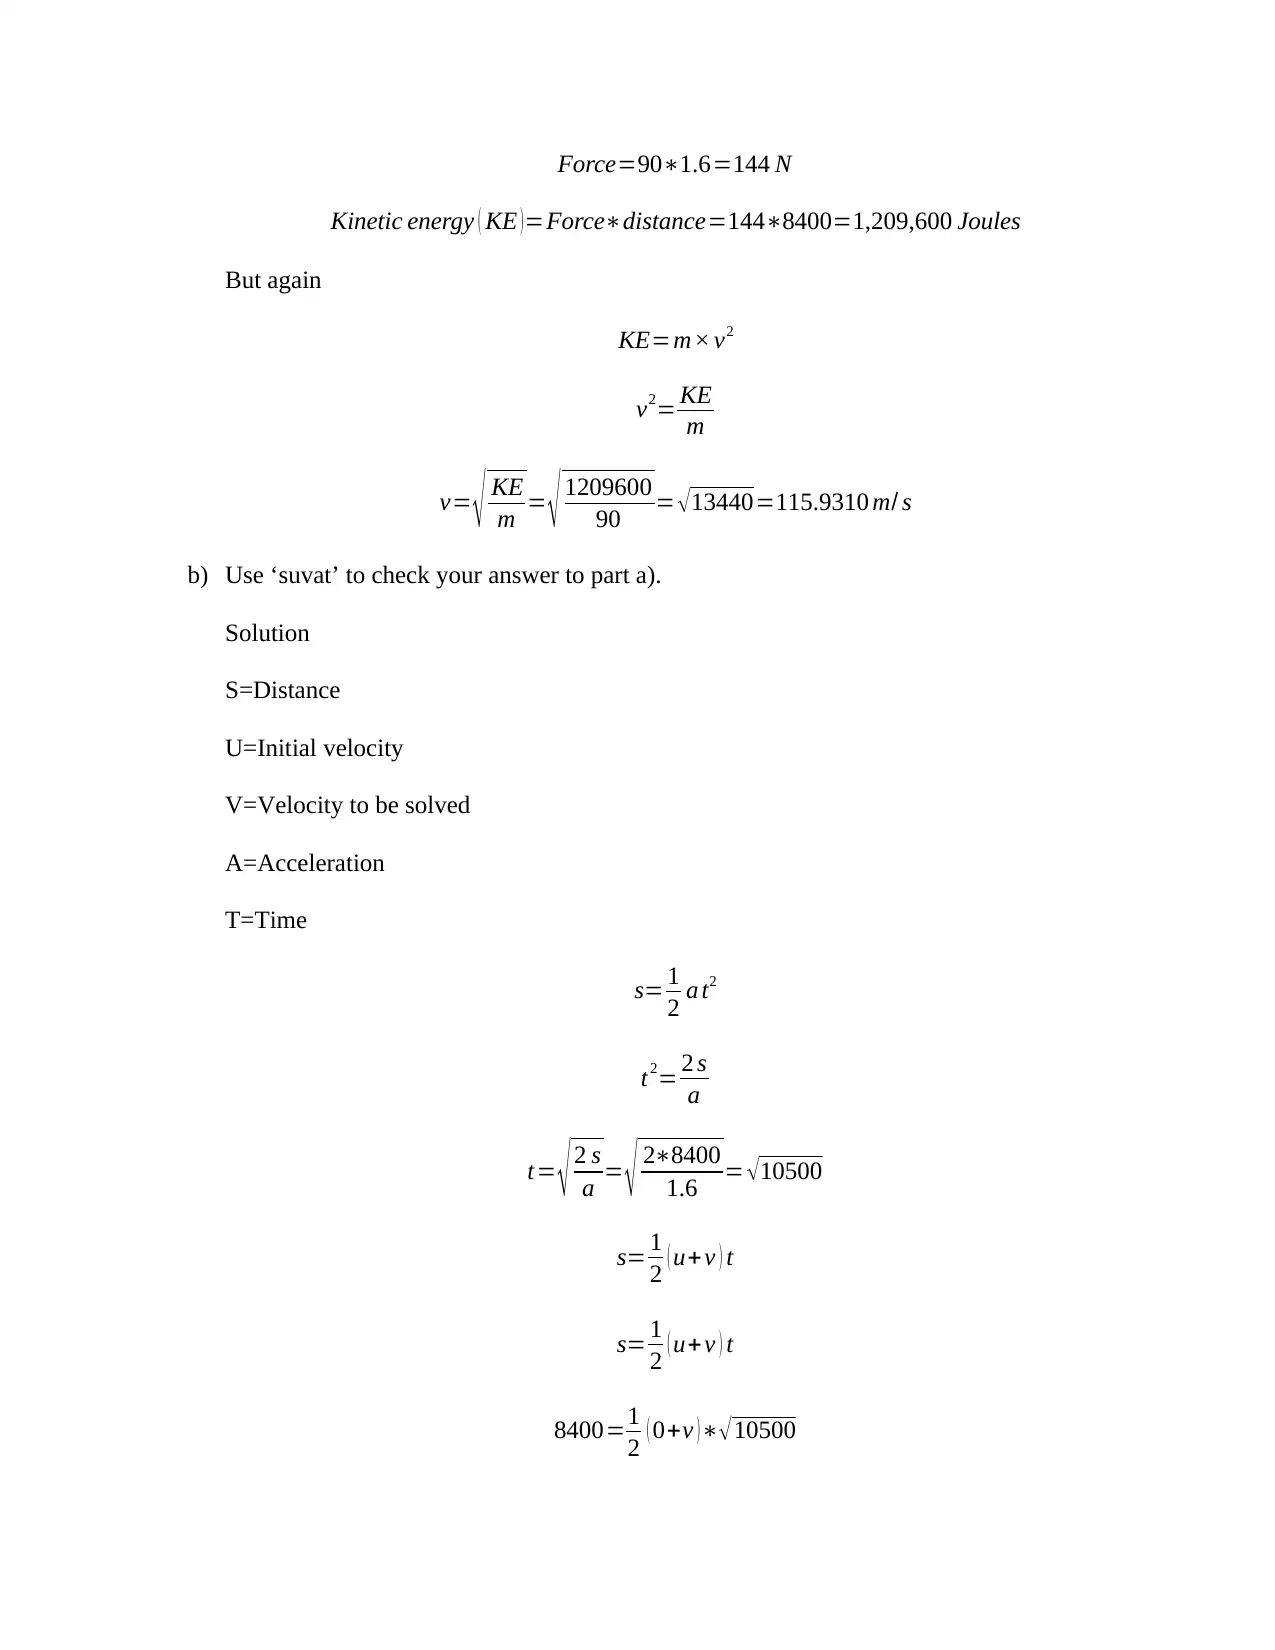
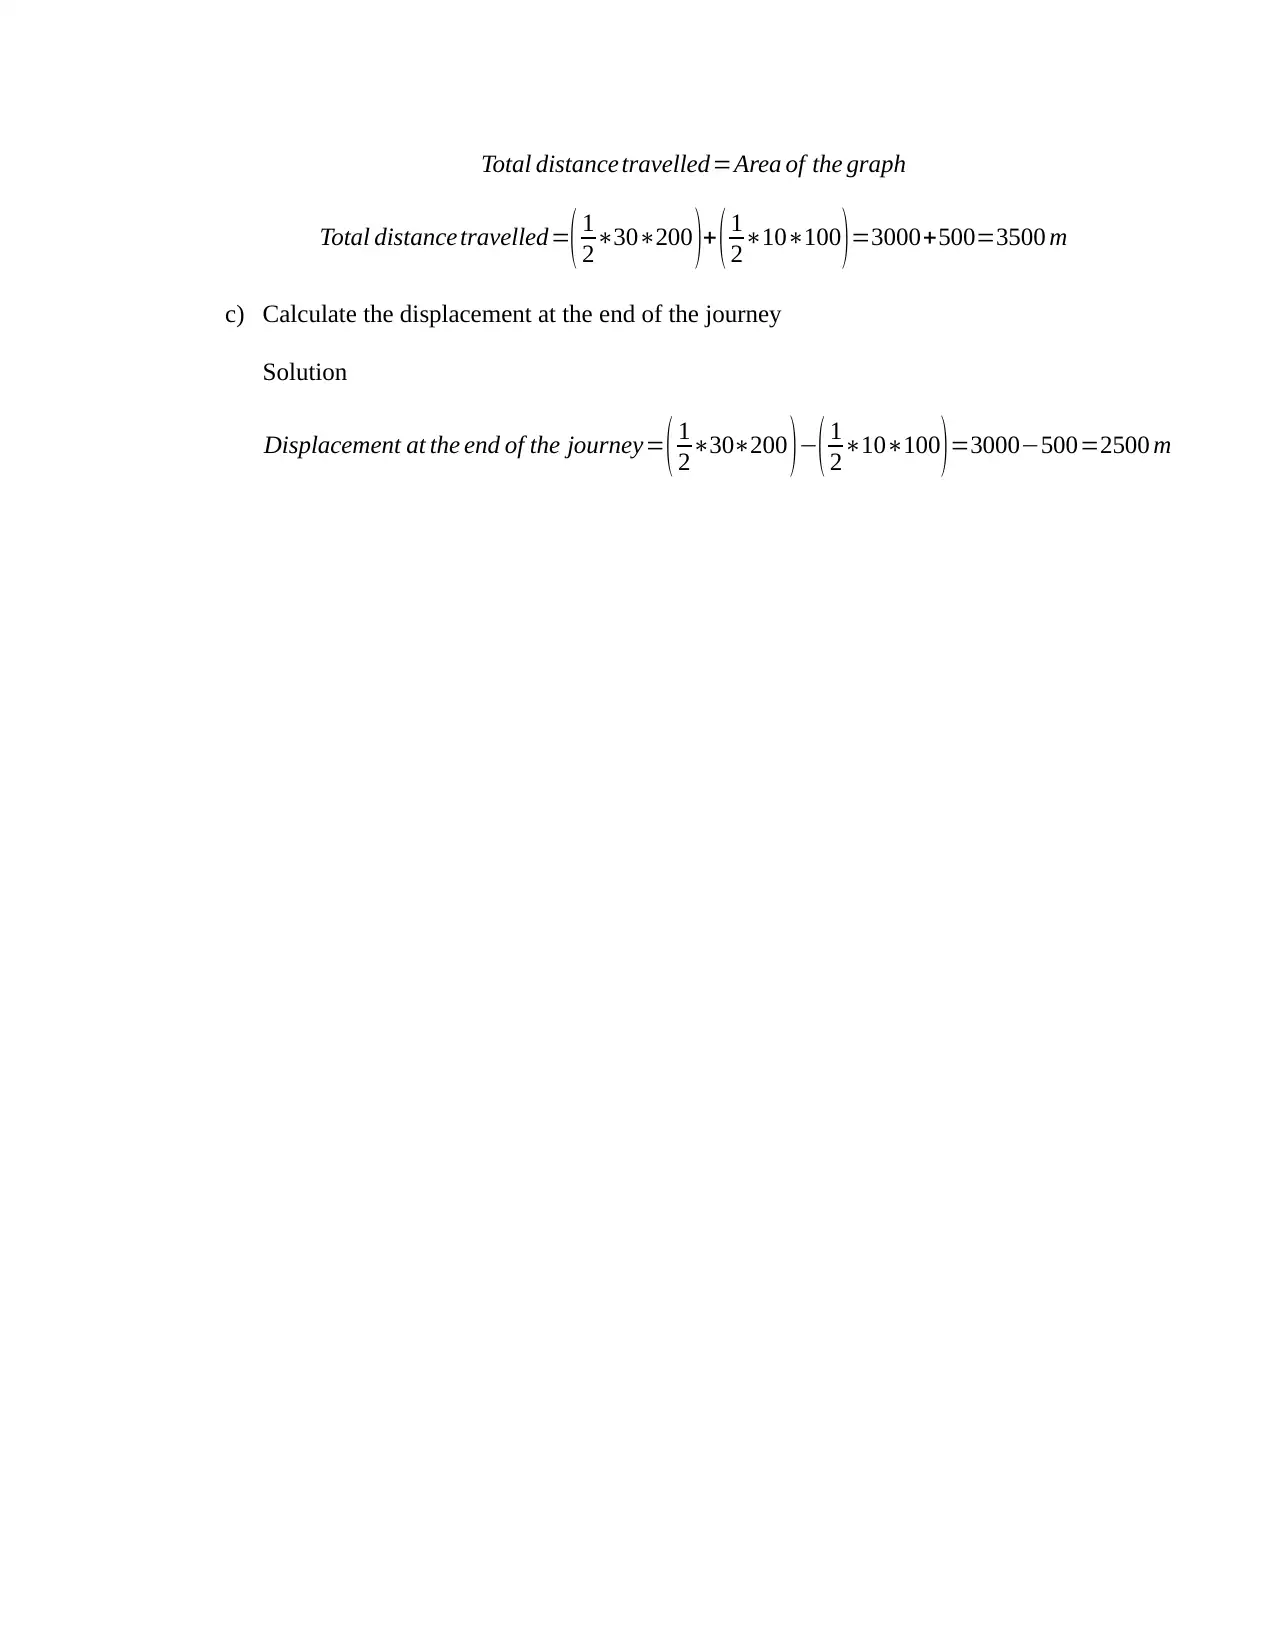
The physics assignment involves multiple sections focusing on different aspects of physical principles. The first section presents experimental results for determining the metal's toughness and compares the Young’s Modulus to textbook values. In the second part, calculations are carried out to find the impact speed of a mass dropped onto the moon's surface using energy equations and 'suvat' formulas. Errors in measurements such as zero error and human error are discussed. The third section involves an experiment to determine the shear modulus from load-deflection data. The fourth examines a velocity-time graph to identify when a car achieves its greatest acceleration, calculates distances during deceleration, and computes total displacement. Finally, negative y-values on a velocity-time graph are interpreted in terms of direction, and both total distance traveled and final displacement for a different car journey are calculated.

1 out of 10
Your All-in-One AI-Powered Toolkit for Academic Success.
+13062052269
info@desklib.com
Available 24*7 on WhatsApp / Email
![[object Object]](/_next/static/media/star-bottom.7253800d.svg)
Copyright © 2020–2026 A2Z Services. All Rights Reserved. Developed and managed by ZUCOL.