Analysis of NEO Cryptocurrency Price for One Year (2018-2019)
VerifiedAdded on 2023/01/23
|25
|4528
|79
Report
AI Summary
This report presents a comprehensive analysis of the price of NEO cryptocurrency over a one-year period, from April 22, 2018, to April 21, 2019. The study investigates the price trends, aiming to determine whether prices were increasing or decreasing, and develops a model for price prediction. The methodology includes descriptive statistics, graphical analysis (line graphs of daily prices, volume, and circulation), correlation analysis to examine the relationship between price and circulation, and regression analysis to determine the influence of volume and circulation on price. The findings reveal a volatile market with a general downward trend in prices, volume, and circulation. Descriptive statistics provide insights into the mean, standard deviation, and range of the variables. The report is significant for NEO management, business analysts, investors, researchers, and the public, offering valuable insights for decision-making and further research.

Running Head: NEO CRYPTOCURRENCY
1
ANALYSIS OF THE PRICE OF NEO CRYPTOCURRENCY FOR A PERIOD OF ONE
YEAR (22ND APRIL, 2018 TO 21ST APRIL 2019)
Money and Banking
Name of Student:
Name of Student:
Date:
1
ANALYSIS OF THE PRICE OF NEO CRYPTOCURRENCY FOR A PERIOD OF ONE
YEAR (22ND APRIL, 2018 TO 21ST APRIL 2019)
Money and Banking
Name of Student:
Name of Student:
Date:
Paraphrase This Document
Need a fresh take? Get an instant paraphrase of this document with our AI Paraphraser
NEO CRYPTOCURRENCY
2
Contents
Introduction.................................................................................................................................................3
Importance of the Study..............................................................................................................................5
Analysis.......................................................................................................................................................6
Descriptive Analysis................................................................................................................................8
Graphical Analysis..................................................................................................................................9
Correlation Analysis..............................................................................................................................11
Regression Analysis..............................................................................................................................11
Conclusion.................................................................................................................................................12
References.................................................................................................................................................14
Appendix...................................................................................................................................................15
Predicted Neo Cryptocurrency Prices....................................................................................................15
Regression Plots....................................................................................................................................24
NEO CRYPTOCURRENCY
3
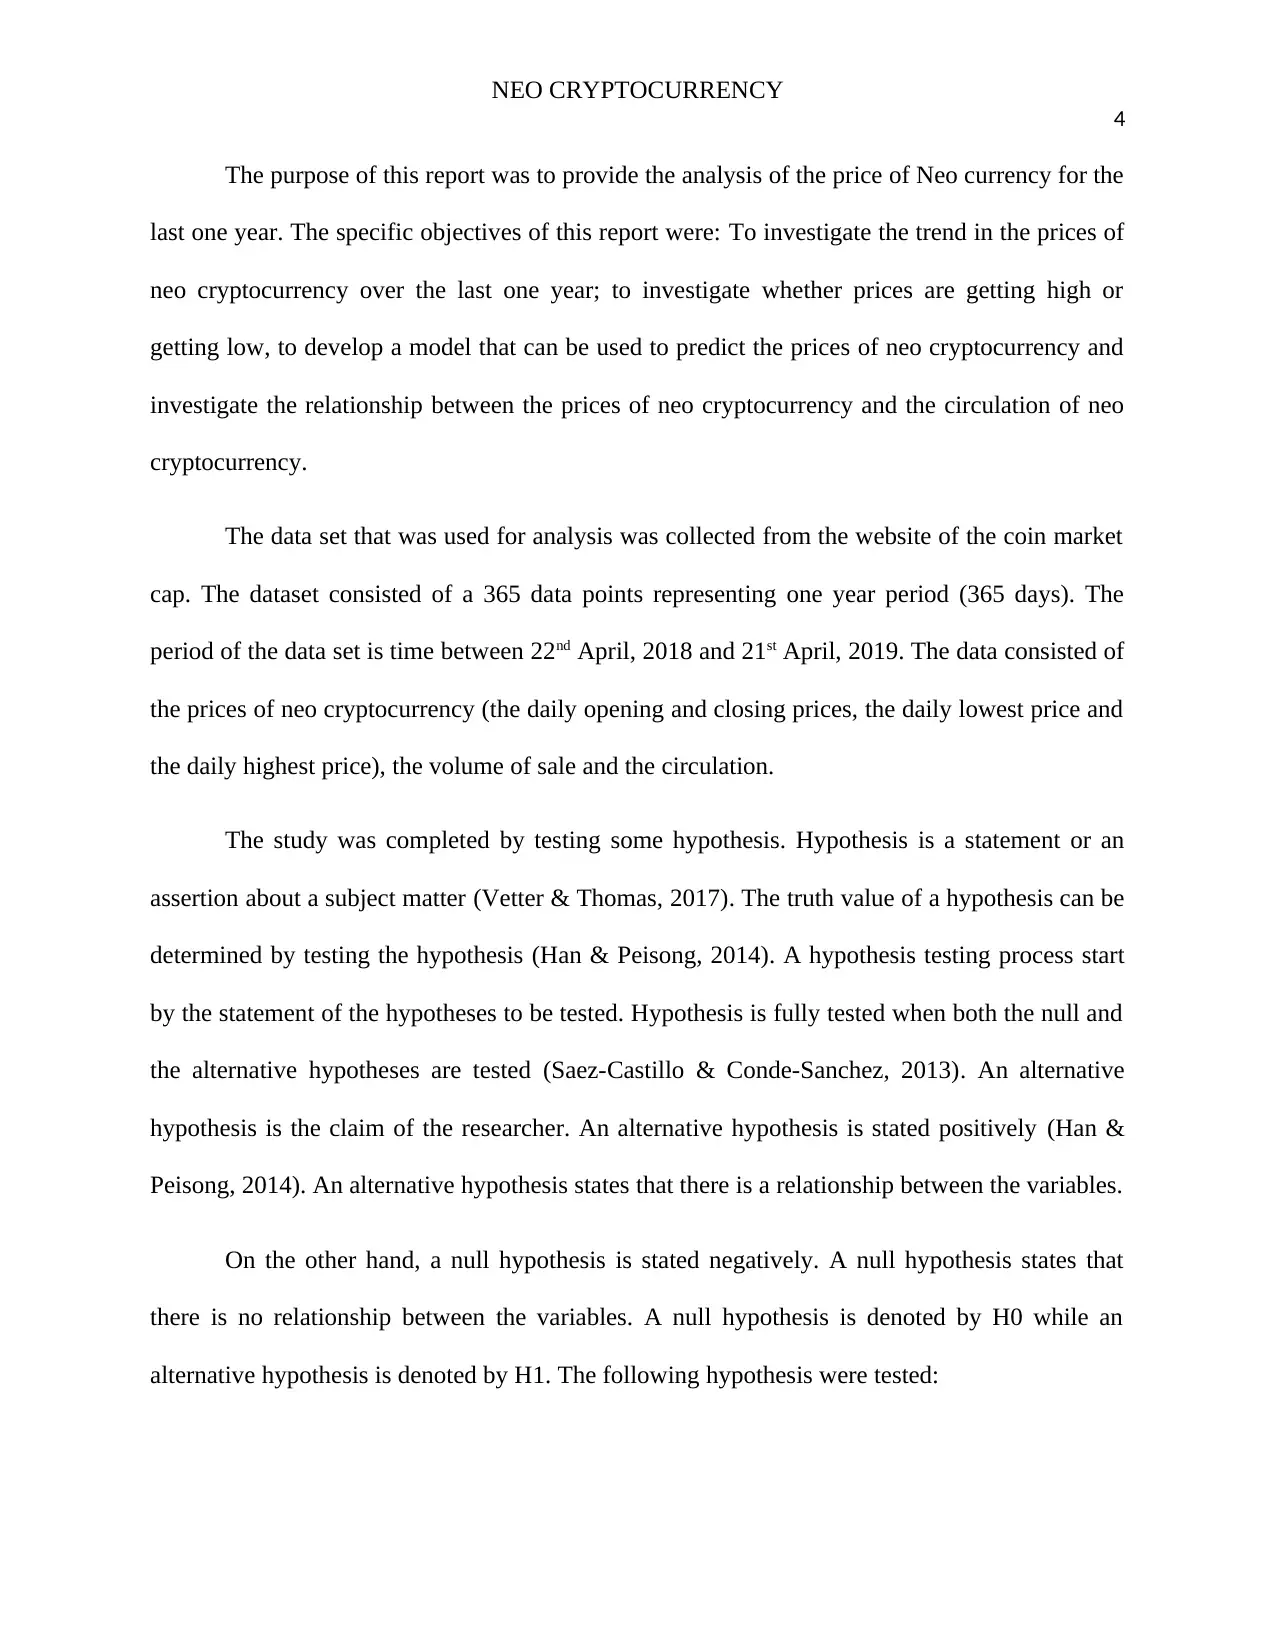
Introduction
A cryptocurrency is a digital medium that is used for the exchange of goods and services
over the internet (Blakstad, Sofie, Allen, & Robert, 2018). There are several cryptocurrencies
that exists over the internet. The cryptocurrencies have universal prices that are accessible
publicly to everyone. The value of a cryptocurrency is measured by its current price. Therefore,
it is possible to investigate the price movement of any cryptocurrency over any given time
periods (Furneaux & Nick, 2018).
The price or value of a cryptocurrency changes like the prices of shares in the market.
The price of a cryptocurrency is determined by forces of the market; demand and supply.
Therefore, the prices of cryptocurrencies are as volatile as that of a stock; the prices of
cryptocurrencies change every second (Catalini & Christin, 2018). However, it is possible to get
a daily price of a cryptocurrency. The daily price of a cryptocurrency can be obtained by getting
the average of the lowest and the highest price in a day (Hattori, Takahiro, Ishida, & Ryo, 2018).
The daily lowest and highest cryptocurrency prices are available in the internet.
The analysis of in this report focused on neo cryptocurrency. The neo cryptocurrency was
formerly known as Ant shares. The aim of neo cryptocurrency is to build a ‘smart economy’.
Neo cryptocurrency aims to build a ‘smart economy’ by incorporating digital assets, digital
identities and enhancing smart contracts. Neo cryptocurrency was developed by Onchain DNA,
Neo's dual-token ecosystem can be used for creating Apps and ICOs. Neo cryptocurrency’s
delegated Byzantine Fault Tolerance (dBFT) consensus algorithm is purportedly faster than the
POW used by Ethereum and Bitcoin.
3
Introduction
A cryptocurrency is a digital medium that is used for the exchange of goods and services
over the internet (Blakstad, Sofie, Allen, & Robert, 2018). There are several cryptocurrencies
that exists over the internet. The cryptocurrencies have universal prices that are accessible
publicly to everyone. The value of a cryptocurrency is measured by its current price. Therefore,
it is possible to investigate the price movement of any cryptocurrency over any given time
periods (Furneaux & Nick, 2018).
The price or value of a cryptocurrency changes like the prices of shares in the market.
The price of a cryptocurrency is determined by forces of the market; demand and supply.
Therefore, the prices of cryptocurrencies are as volatile as that of a stock; the prices of
cryptocurrencies change every second (Catalini & Christin, 2018). However, it is possible to get
a daily price of a cryptocurrency. The daily price of a cryptocurrency can be obtained by getting
the average of the lowest and the highest price in a day (Hattori, Takahiro, Ishida, & Ryo, 2018).
The daily lowest and highest cryptocurrency prices are available in the internet.
The analysis of in this report focused on neo cryptocurrency. The neo cryptocurrency was
formerly known as Ant shares. The aim of neo cryptocurrency is to build a ‘smart economy’.
Neo cryptocurrency aims to build a ‘smart economy’ by incorporating digital assets, digital
identities and enhancing smart contracts. Neo cryptocurrency was developed by Onchain DNA,
Neo's dual-token ecosystem can be used for creating Apps and ICOs. Neo cryptocurrency’s
delegated Byzantine Fault Tolerance (dBFT) consensus algorithm is purportedly faster than the
POW used by Ethereum and Bitcoin.
⊘ This is a preview!⊘
Do you want full access?
Subscribe today to unlock all pages.
Trusted by 1+ million students worldwide
NEO CRYPTOCURRENCY
4
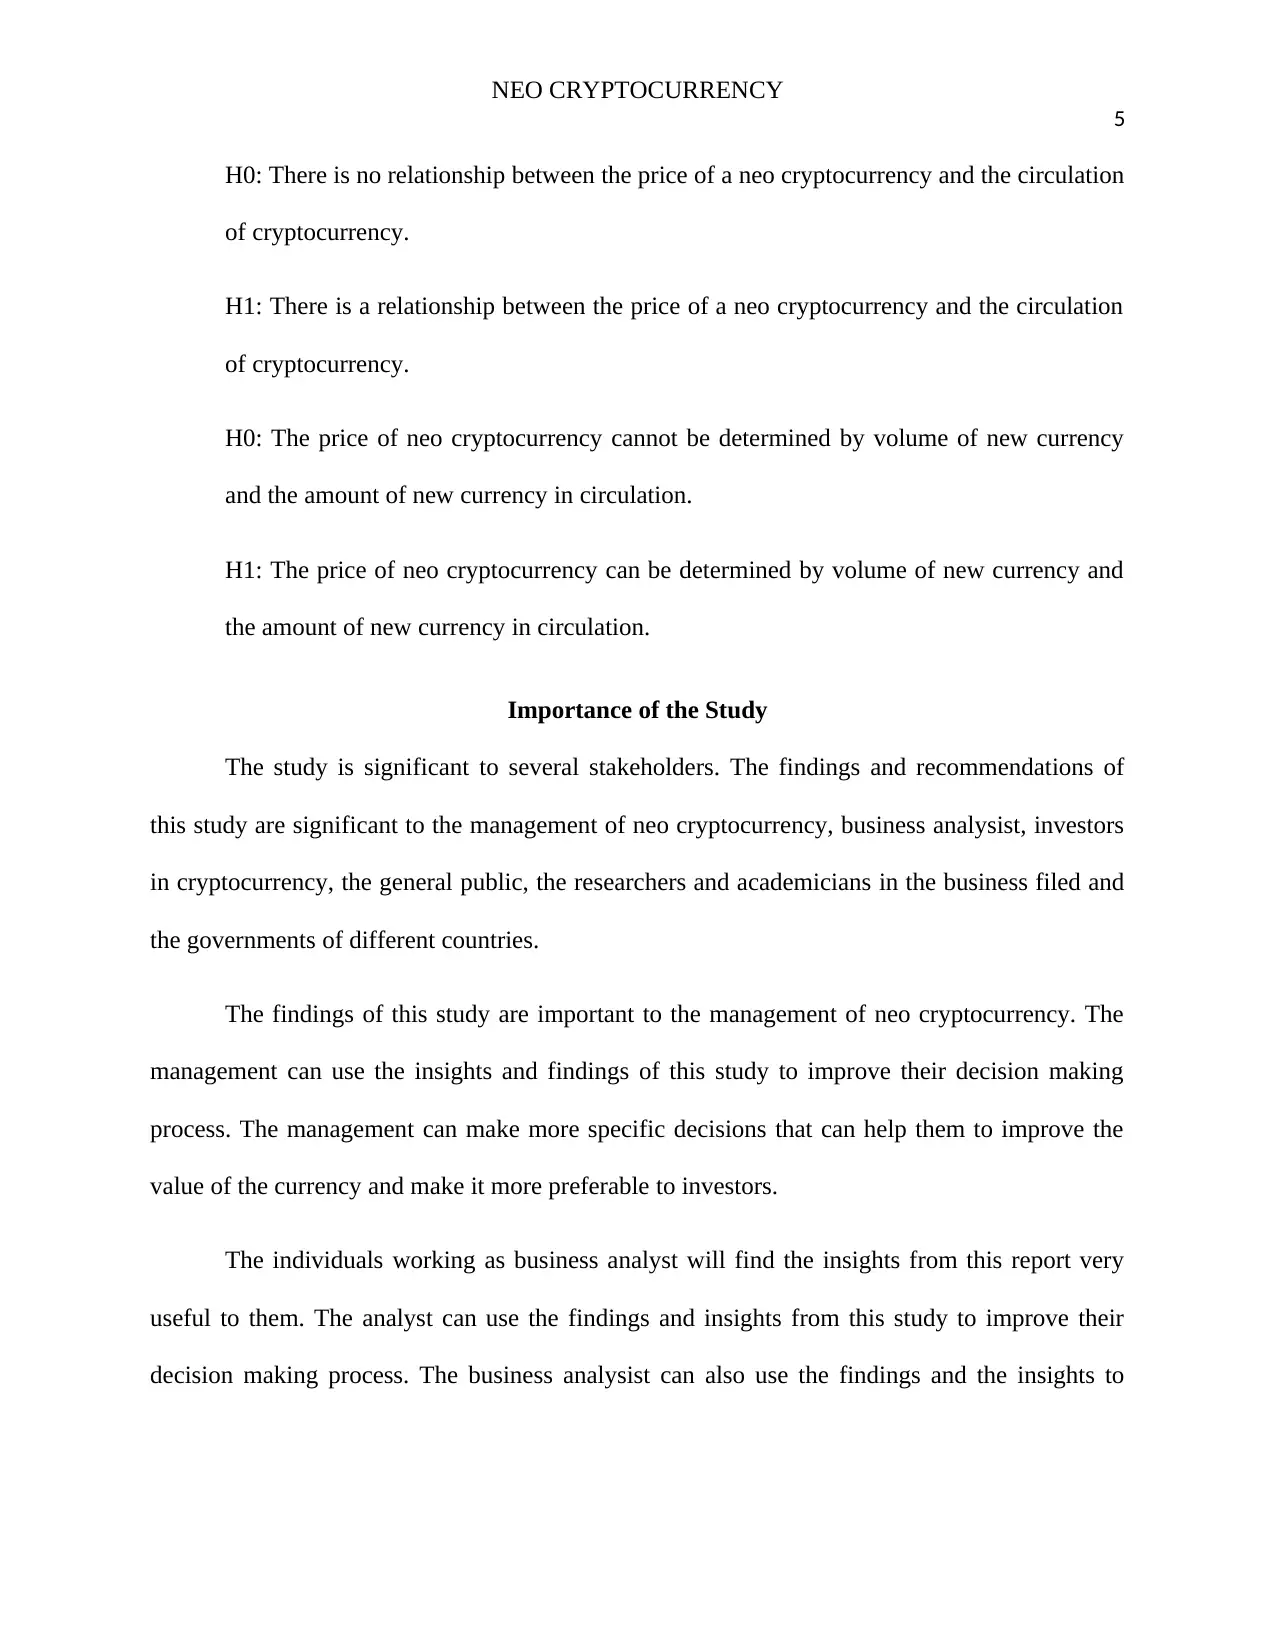
The purpose of this report was to provide the analysis of the price of Neo currency for the
last one year. The specific objectives of this report were: To investigate the trend in the prices of
neo cryptocurrency over the last one year; to investigate whether prices are getting high or
getting low, to develop a model that can be used to predict the prices of neo cryptocurrency and
investigate the relationship between the prices of neo cryptocurrency and the circulation of neo
cryptocurrency.
The data set that was used for analysis was collected from the website of the coin market
cap. The dataset consisted of a 365 data points representing one year period (365 days). The
period of the data set is time between 22nd April, 2018 and 21st April, 2019. The data consisted of
the prices of neo cryptocurrency (the daily opening and closing prices, the daily lowest price and
the daily highest price), the volume of sale and the circulation.
The study was completed by testing some hypothesis. Hypothesis is a statement or an
assertion about a subject matter (Vetter & Thomas, 2017). The truth value of a hypothesis can be
determined by testing the hypothesis (Han & Peisong, 2014). A hypothesis testing process start
by the statement of the hypotheses to be tested. Hypothesis is fully tested when both the null and
the alternative hypotheses are tested (Saez-Castillo & Conde-Sanchez, 2013). An alternative
hypothesis is the claim of the researcher. An alternative hypothesis is stated positively (Han &
Peisong, 2014). An alternative hypothesis states that there is a relationship between the variables.
On the other hand, a null hypothesis is stated negatively. A null hypothesis states that
there is no relationship between the variables. A null hypothesis is denoted by H0 while an
alternative hypothesis is denoted by H1. The following hypothesis were tested:
4
The purpose of this report was to provide the analysis of the price of Neo currency for the
last one year. The specific objectives of this report were: To investigate the trend in the prices of
neo cryptocurrency over the last one year; to investigate whether prices are getting high or
getting low, to develop a model that can be used to predict the prices of neo cryptocurrency and
investigate the relationship between the prices of neo cryptocurrency and the circulation of neo
cryptocurrency.
The data set that was used for analysis was collected from the website of the coin market
cap. The dataset consisted of a 365 data points representing one year period (365 days). The
period of the data set is time between 22nd April, 2018 and 21st April, 2019. The data consisted of
the prices of neo cryptocurrency (the daily opening and closing prices, the daily lowest price and
the daily highest price), the volume of sale and the circulation.
The study was completed by testing some hypothesis. Hypothesis is a statement or an
assertion about a subject matter (Vetter & Thomas, 2017). The truth value of a hypothesis can be
determined by testing the hypothesis (Han & Peisong, 2014). A hypothesis testing process start
by the statement of the hypotheses to be tested. Hypothesis is fully tested when both the null and
the alternative hypotheses are tested (Saez-Castillo & Conde-Sanchez, 2013). An alternative
hypothesis is the claim of the researcher. An alternative hypothesis is stated positively (Han &
Peisong, 2014). An alternative hypothesis states that there is a relationship between the variables.
On the other hand, a null hypothesis is stated negatively. A null hypothesis states that
there is no relationship between the variables. A null hypothesis is denoted by H0 while an
alternative hypothesis is denoted by H1. The following hypothesis were tested:
Paraphrase This Document
Need a fresh take? Get an instant paraphrase of this document with our AI Paraphraser
NEO CRYPTOCURRENCY
5
H0: There is no relationship between the price of a neo cryptocurrency and the circulation
of cryptocurrency.
H1: There is a relationship between the price of a neo cryptocurrency and the circulation
of cryptocurrency.
H0: The price of neo cryptocurrency cannot be determined by volume of new currency
and the amount of new currency in circulation.
H1: The price of neo cryptocurrency can be determined by volume of new currency and
the amount of new currency in circulation.
Importance of the Study
The study is significant to several stakeholders. The findings and recommendations of
this study are significant to the management of neo cryptocurrency, business analysist, investors
in cryptocurrency, the general public, the researchers and academicians in the business filed and
the governments of different countries.
The findings of this study are important to the management of neo cryptocurrency. The
management can use the insights and findings of this study to improve their decision making
process. The management can make more specific decisions that can help them to improve the
value of the currency and make it more preferable to investors.
The individuals working as business analyst will find the insights from this report very
useful to them. The analyst can use the findings and insights from this study to improve their
decision making process. The business analysist can also use the findings and the insights to
NEO CRYPTOCURRENCY
6
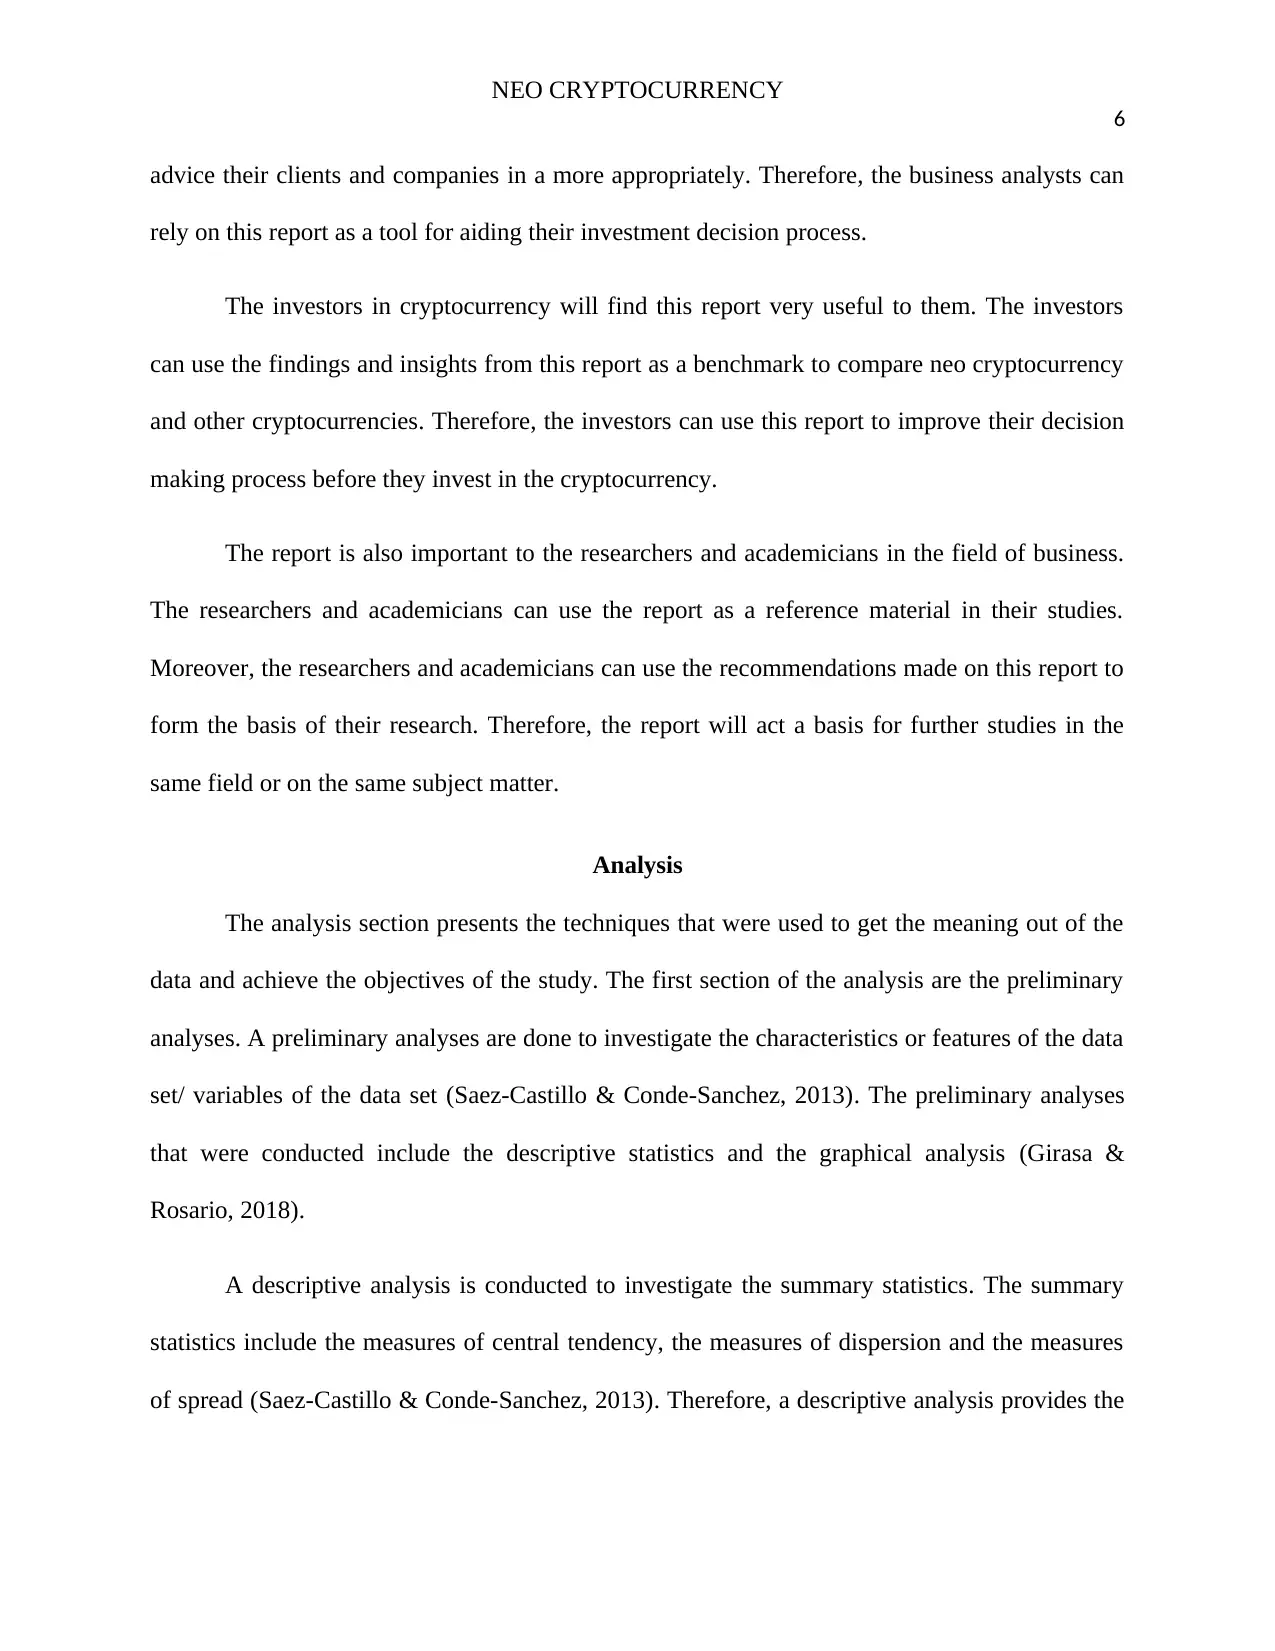
advice their clients and companies in a more appropriately. Therefore, the business analysts can
rely on this report as a tool for aiding their investment decision process.
The investors in cryptocurrency will find this report very useful to them. The investors
can use the findings and insights from this report as a benchmark to compare neo cryptocurrency
and other cryptocurrencies. Therefore, the investors can use this report to improve their decision
making process before they invest in the cryptocurrency.
The report is also important to the researchers and academicians in the field of business.
The researchers and academicians can use the report as a reference material in their studies.
Moreover, the researchers and academicians can use the recommendations made on this report to
form the basis of their research. Therefore, the report will act a basis for further studies in the
same field or on the same subject matter.
Analysis
The analysis section presents the techniques that were used to get the meaning out of the
data and achieve the objectives of the study. The first section of the analysis are the preliminary
analyses. A preliminary analyses are done to investigate the characteristics or features of the data
set/ variables of the data set (Saez-Castillo & Conde-Sanchez, 2013). The preliminary analyses
that were conducted include the descriptive statistics and the graphical analysis (Girasa &
Rosario, 2018).
A descriptive analysis is conducted to investigate the summary statistics. The summary
statistics include the measures of central tendency, the measures of dispersion and the measures
of spread (Saez-Castillo & Conde-Sanchez, 2013). Therefore, a descriptive analysis provides the
6
advice their clients and companies in a more appropriately. Therefore, the business analysts can
rely on this report as a tool for aiding their investment decision process.
The investors in cryptocurrency will find this report very useful to them. The investors
can use the findings and insights from this report as a benchmark to compare neo cryptocurrency
and other cryptocurrencies. Therefore, the investors can use this report to improve their decision
making process before they invest in the cryptocurrency.
The report is also important to the researchers and academicians in the field of business.
The researchers and academicians can use the report as a reference material in their studies.
Moreover, the researchers and academicians can use the recommendations made on this report to
form the basis of their research. Therefore, the report will act a basis for further studies in the
same field or on the same subject matter.
Analysis
The analysis section presents the techniques that were used to get the meaning out of the
data and achieve the objectives of the study. The first section of the analysis are the preliminary
analyses. A preliminary analyses are done to investigate the characteristics or features of the data
set/ variables of the data set (Saez-Castillo & Conde-Sanchez, 2013). The preliminary analyses
that were conducted include the descriptive statistics and the graphical analysis (Girasa &
Rosario, 2018).
A descriptive analysis is conducted to investigate the summary statistics. The summary
statistics include the measures of central tendency, the measures of dispersion and the measures
of spread (Saez-Castillo & Conde-Sanchez, 2013). Therefore, a descriptive analysis provides the
⊘ This is a preview!⊘
Do you want full access?
Subscribe today to unlock all pages.
Trusted by 1+ million students worldwide
NEO CRYPTOCURRENCY
7
features like the mean, the variance, the standard deviation, the mode, the maximum value, the
minimum value, the skewness and kurtosis (Richard, 2009).
A graphical analysis is a way of providing the pictorial display of the observations. A
graphical representation was used in the report to provide a picture of how the prices and the
other variables of neo cryptocurrency have behaved over the past one year. A line graph was
used to represent the daily prices of neo cryptocurrency over the past one year. The line graph
help in obtaining the trend of the daily prices over the past one year. The trend help in
determining whether the prices have going up or going down over the past one year.
Correlation analysis was used to test hypothesis 1 that there is no relationship between
the price of a neo cryptocurrency and the circulation of cryptocurrency versus the alternative
hypothesis that there is a relationship between the price of a neo cryptocurrency and the
circulation of cryptocurrency. Correlation analysis is a statistical technique that is used to
investigate the strength and the nature of the relationship that exists between variables (Vetter &
Thomas, 2017). The strength and nature of the relationship between variables can be determined
by the correlation coefficient between the variables (Vetter & Thomas, 2017).
A correlation coefficient ranges between 1 and -1. A correlation coefficient of 1 is a
perfect positive relationship while a correlation coefficient of -1 is a perfect negative correlation
(Vetter & Thomas, 2017). A correlation coefficient with a value in the range of 0 and 0.5 is a
weak positive relationship while a correlation coefficient of a value in the range of 0.5 and 1 is a
strong positive relationship (Vetter & Thomas, 2017). On the other hand, a correlation
coefficient of the value between 0 and -0.5 is a weak negative correlation while a correlation
Paraphrase This Document
Need a fresh take? Get an instant paraphrase of this document with our AI Paraphraser
NEO CRYPTOCURRENCY
8
coefficient with a value in the range of 0.5 and -1 is a strong negative relationship (Vetter &
Thomas, 2017).
Regression analysis was used to test hypothesis 2. Regression analysis was to test the null
hypothesis that the price of neo cryptocurrency cannot be determined by volume of new currency
and the amount of new currency in circulation versus the alternative hypothesis that the price of
neo cryptocurrency can be determined by volume of new currency and the amount of new
currency in circulation. Regression analysis is a statistical technique that is used to predict one
variable (dependent variable) using two or more variables (independent variables) (Vetter &
Thomas, 2017). The output of regression analysis provides the specification of the model that
can be used for prediction.
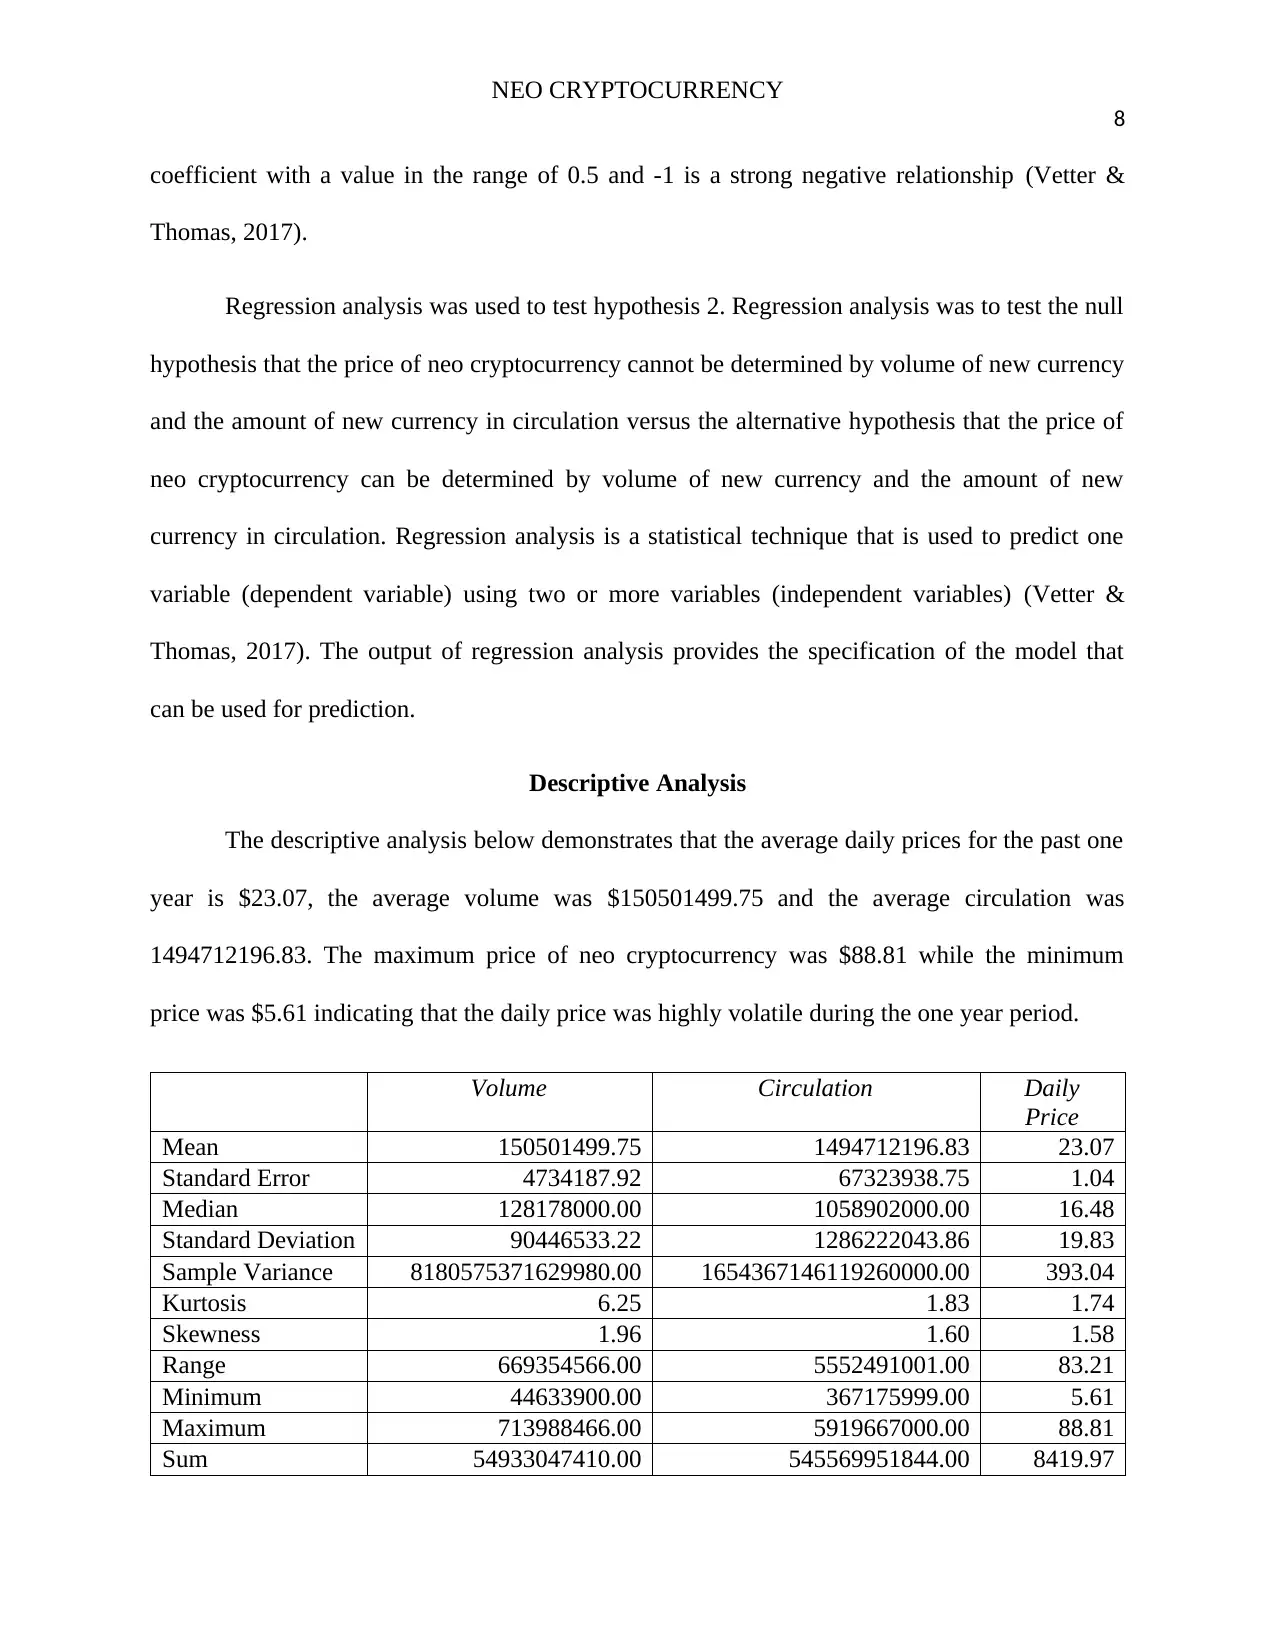
Descriptive Analysis
The descriptive analysis below demonstrates that the average daily prices for the past one
year is $23.07, the average volume was $150501499.75 and the average circulation was
1494712196.83. The maximum price of neo cryptocurrency was $88.81 while the minimum
price was $5.61 indicating that the daily price was highly volatile during the one year period.
Volume Circulation Daily
Price
Mean 150501499.75 1494712196.83 23.07
Standard Error 4734187.92 67323938.75 1.04
Median 128178000.00 1058902000.00 16.48
Standard Deviation 90446533.22 1286222043.86 19.83
Sample Variance 8180575371629980.00 1654367146119260000.00 393.04
Kurtosis 6.25 1.83 1.74
Skewness 1.96 1.60 1.58
Range 669354566.00 5552491001.00 83.21
Minimum 44633900.00 367175999.00 5.61
Maximum 713988466.00 5919667000.00 88.81
Sum 54933047410.00 545569951844.00 8419.97
8
coefficient with a value in the range of 0.5 and -1 is a strong negative relationship (Vetter &
Thomas, 2017).
Regression analysis was used to test hypothesis 2. Regression analysis was to test the null
hypothesis that the price of neo cryptocurrency cannot be determined by volume of new currency
and the amount of new currency in circulation versus the alternative hypothesis that the price of
neo cryptocurrency can be determined by volume of new currency and the amount of new
currency in circulation. Regression analysis is a statistical technique that is used to predict one
variable (dependent variable) using two or more variables (independent variables) (Vetter &
Thomas, 2017). The output of regression analysis provides the specification of the model that
can be used for prediction.
Descriptive Analysis
The descriptive analysis below demonstrates that the average daily prices for the past one
year is $23.07, the average volume was $150501499.75 and the average circulation was
1494712196.83. The maximum price of neo cryptocurrency was $88.81 while the minimum
price was $5.61 indicating that the daily price was highly volatile during the one year period.
Volume Circulation Daily
Price
Mean 150501499.75 1494712196.83 23.07
Standard Error 4734187.92 67323938.75 1.04
Median 128178000.00 1058902000.00 16.48
Standard Deviation 90446533.22 1286222043.86 19.83
Sample Variance 8180575371629980.00 1654367146119260000.00 393.04
Kurtosis 6.25 1.83 1.74
Skewness 1.96 1.60 1.58
Range 669354566.00 5552491001.00 83.21
Minimum 44633900.00 367175999.00 5.61
Maximum 713988466.00 5919667000.00 88.81
Sum 54933047410.00 545569951844.00 8419.97
NEO CRYPTOCURRENCY
9
Count 365.00 365.00 365.00
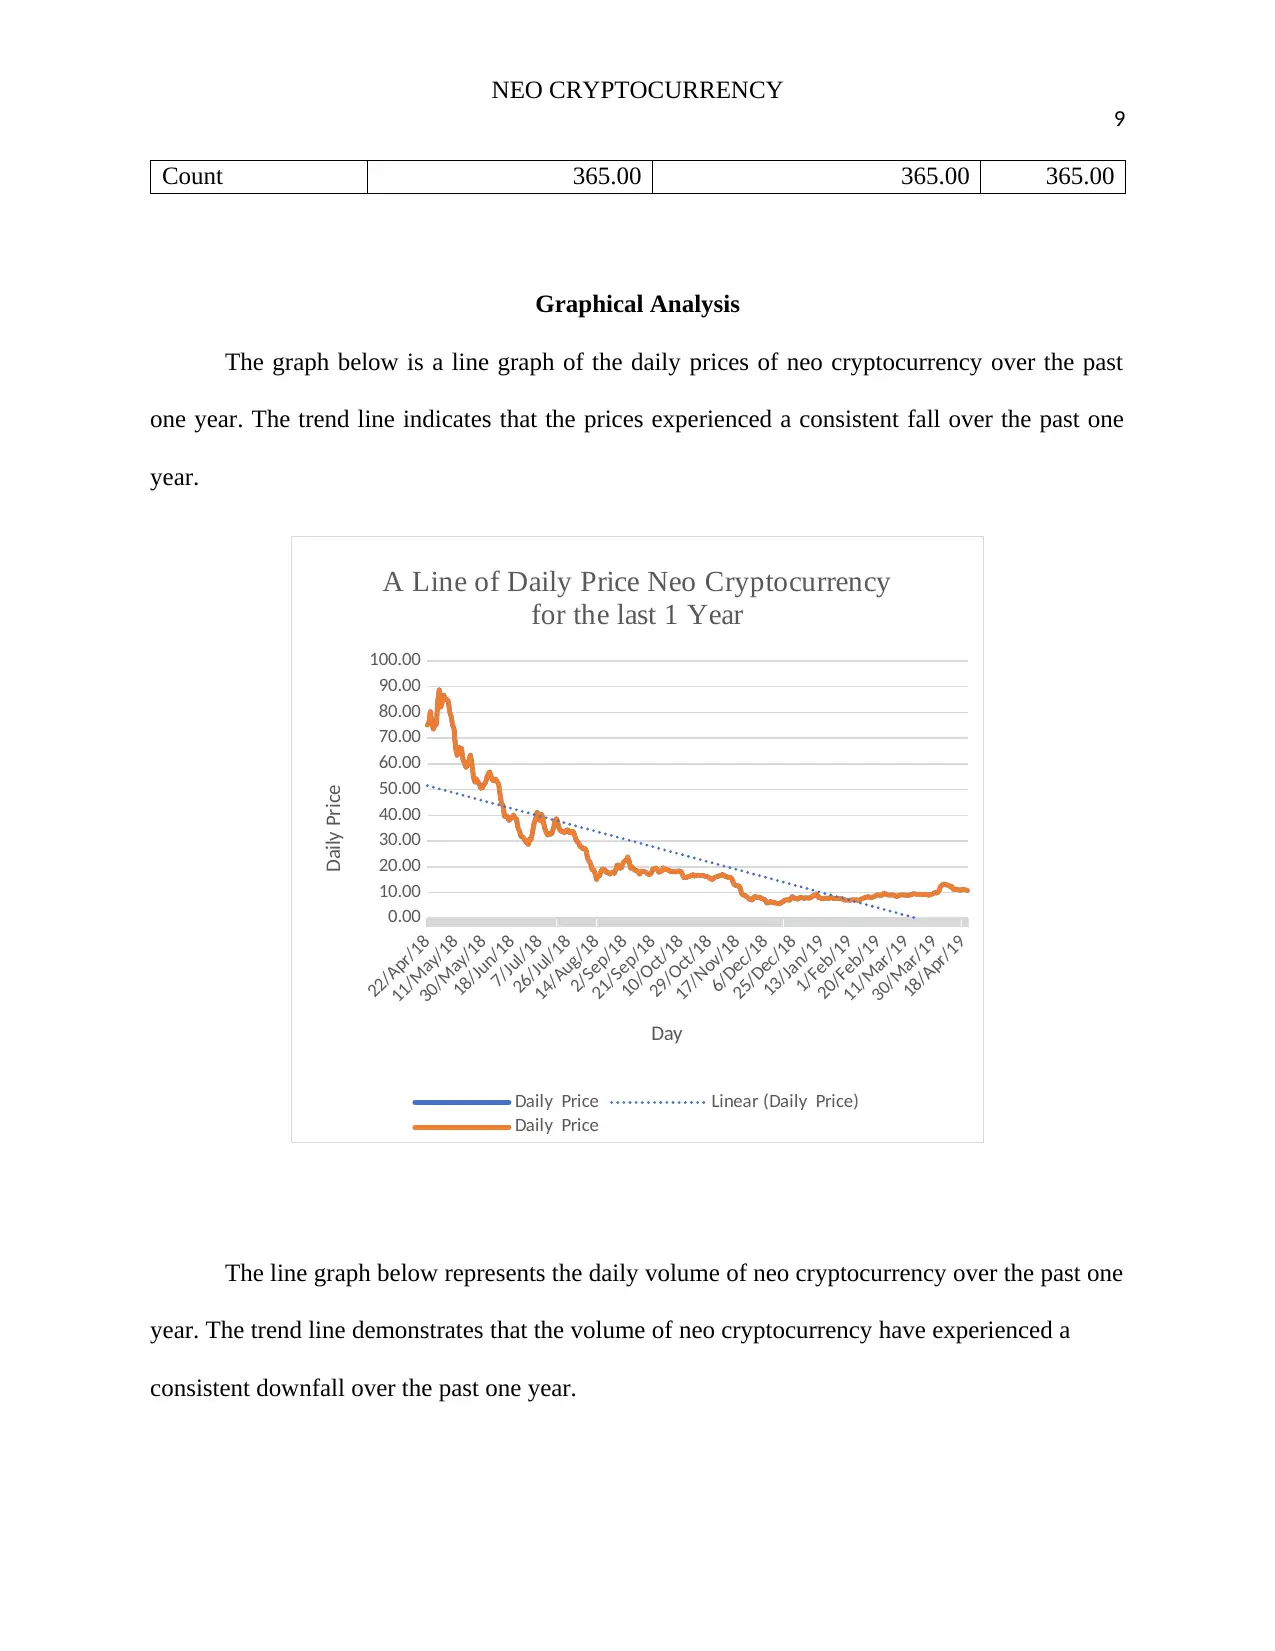
Graphical Analysis
The graph below is a line graph of the daily prices of neo cryptocurrency over the past
one year. The trend line indicates that the prices experienced a consistent fall over the past one
year.
22/Apr/18
11/May/18
30/May/18
18/Jun/18
7/Jul/18
26/Jul/18
14/Aug/18
2/Sep/18
21/Sep/18
10/Oct/18
29/Oct/18
17/Nov/18
6/Dec/18
25/Dec/18
13/Jan/19
1/Feb/19
20/Feb/19
11/Mar/19
30/Mar/19
18/Apr/19
0.00
10.00
20.00
30.00
40.00
50.00
60.00
70.00
80.00
90.00
100.00
A Line of Daily Price Neo Cryptocurrency
for the last 1 Year
Daily Price Linear (Daily Price)
Daily Price
Day
Daily Price
The line graph below represents the daily volume of neo cryptocurrency over the past one
year. The trend line demonstrates that the volume of neo cryptocurrency have experienced a
consistent downfall over the past one year.
9
Count 365.00 365.00 365.00
Graphical Analysis
The graph below is a line graph of the daily prices of neo cryptocurrency over the past
one year. The trend line indicates that the prices experienced a consistent fall over the past one
year.
22/Apr/18
11/May/18
30/May/18
18/Jun/18
7/Jul/18
26/Jul/18
14/Aug/18
2/Sep/18
21/Sep/18
10/Oct/18
29/Oct/18
17/Nov/18
6/Dec/18
25/Dec/18
13/Jan/19
1/Feb/19
20/Feb/19
11/Mar/19
30/Mar/19
18/Apr/19
0.00
10.00
20.00
30.00
40.00
50.00
60.00
70.00
80.00
90.00
100.00
A Line of Daily Price Neo Cryptocurrency
for the last 1 Year
Daily Price Linear (Daily Price)
Daily Price
Day
Daily Price
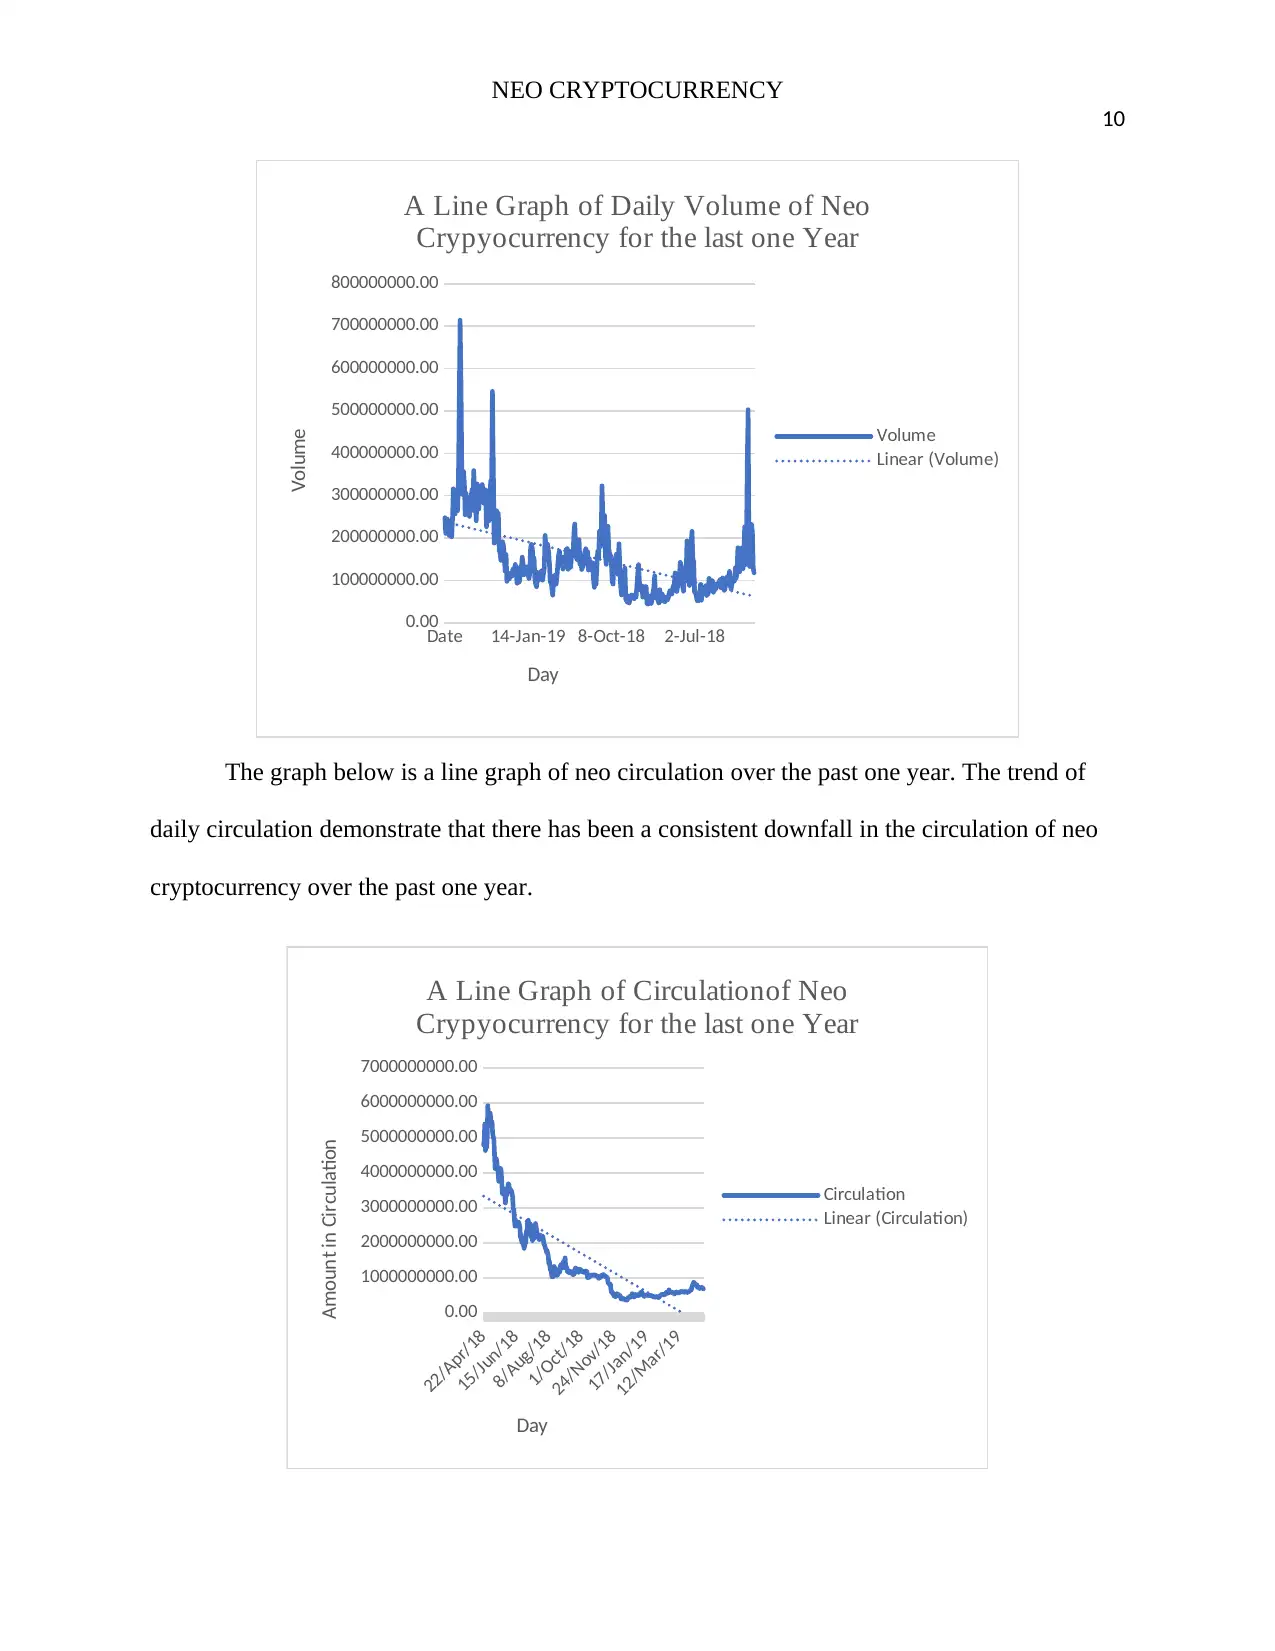
The line graph below represents the daily volume of neo cryptocurrency over the past one
year. The trend line demonstrates that the volume of neo cryptocurrency have experienced a
consistent downfall over the past one year.
⊘ This is a preview!⊘
Do you want full access?
Subscribe today to unlock all pages.
Trusted by 1+ million students worldwide
NEO CRYPTOCURRENCY
10
Date 14-Jan-19 8-Oct-18 2-Jul-18
0.00
100000000.00
200000000.00
300000000.00
400000000.00
500000000.00
600000000.00
700000000.00
800000000.00
A Line Graph of Daily Volume of Neo
Crypyocurrency for the last one Year
Volume
Linear (Volume)
Day
Volume
The graph below is a line graph of neo circulation over the past one year. The trend of
daily circulation demonstrate that there has been a consistent downfall in the circulation of neo
cryptocurrency over the past one year.
22/Apr/18
15/Jun/18
8/Aug/18
1/Oct/18
24/Nov/18
17/Jan/19
12/Mar/19
0.00
1000000000.00
2000000000.00
3000000000.00
4000000000.00
5000000000.00
6000000000.00
7000000000.00
A Line Graph of Circulationof Neo
Crypyocurrency for the last one Year
Circulation
Linear (Circulation)
Day
Amount in Circulation
Paraphrase This Document
Need a fresh take? Get an instant paraphrase of this document with our AI Paraphraser
NEO CRYPTOCURRENCY
11
Correlation Analysis
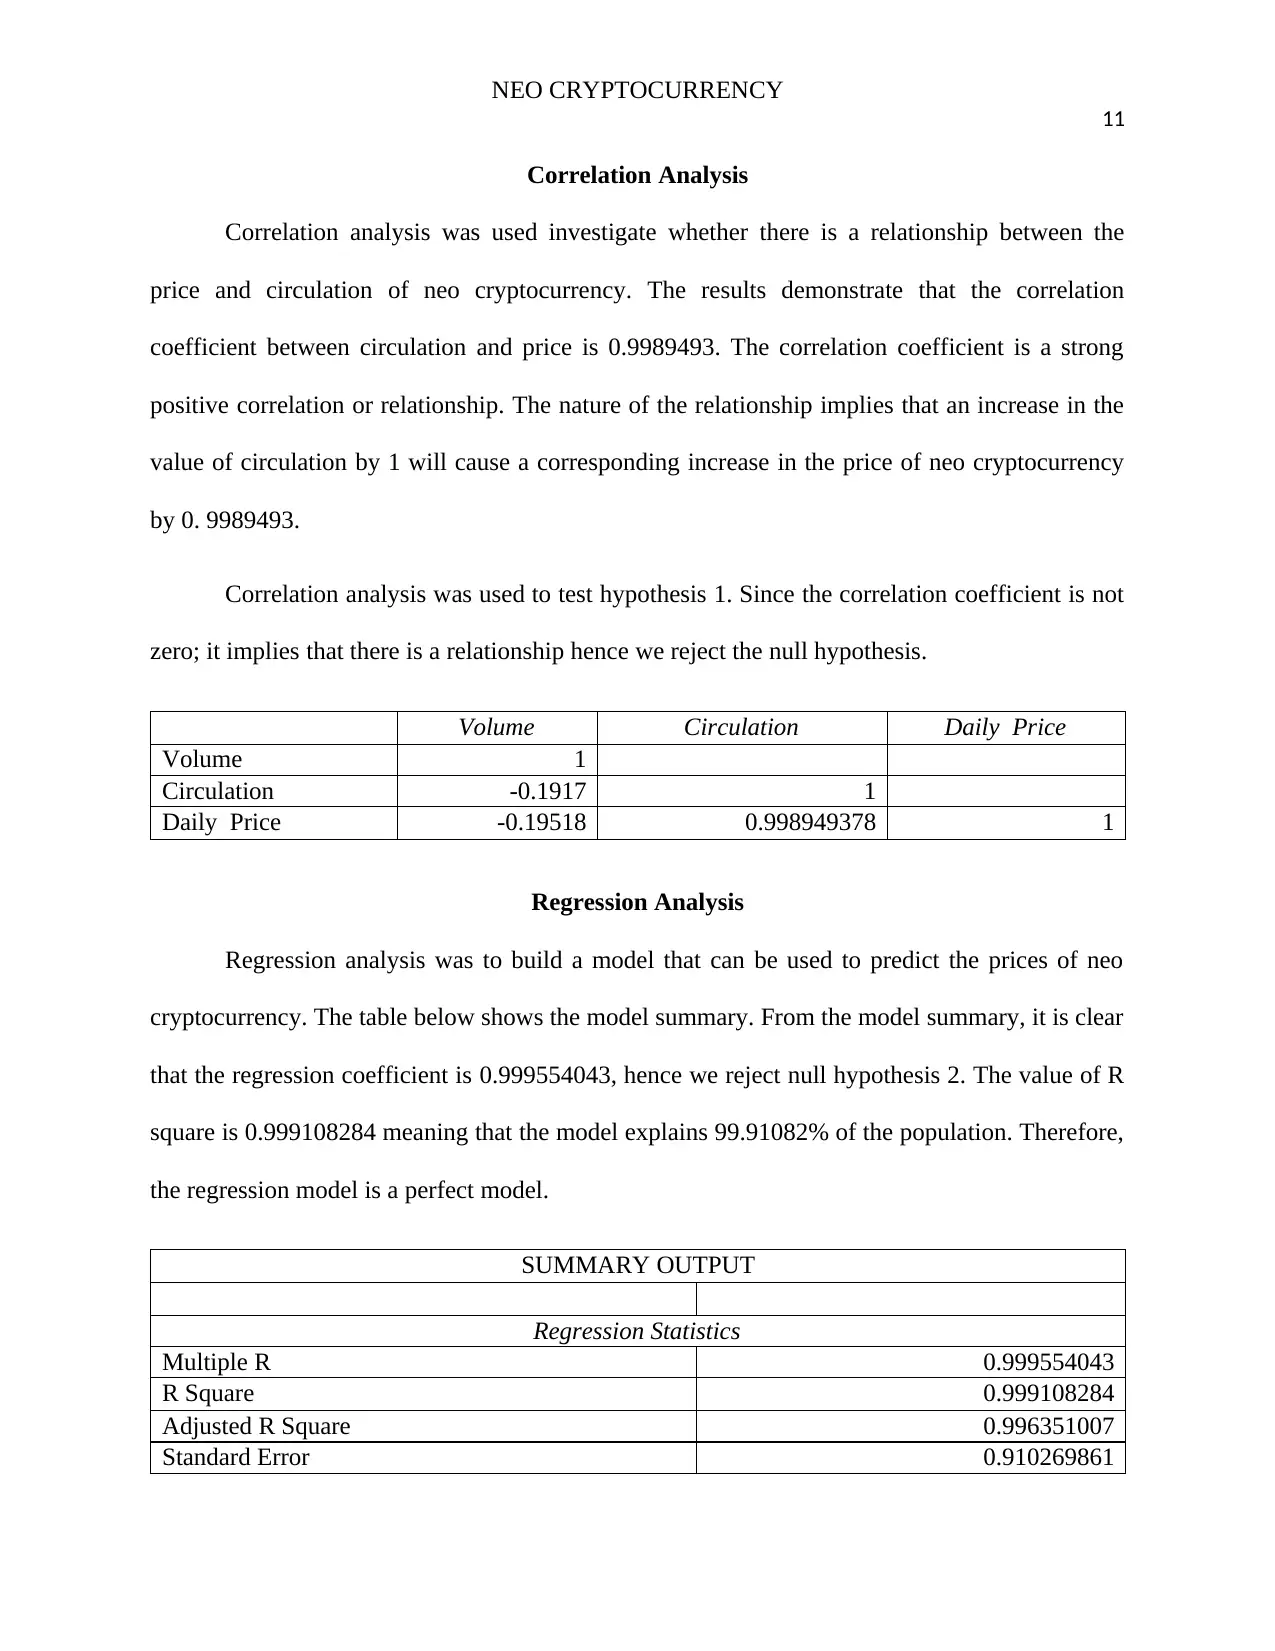
Correlation analysis was used investigate whether there is a relationship between the
price and circulation of neo cryptocurrency. The results demonstrate that the correlation
coefficient between circulation and price is 0.9989493. The correlation coefficient is a strong
positive correlation or relationship. The nature of the relationship implies that an increase in the
value of circulation by 1 will cause a corresponding increase in the price of neo cryptocurrency
by 0. 9989493.
Correlation analysis was used to test hypothesis 1. Since the correlation coefficient is not
zero; it implies that there is a relationship hence we reject the null hypothesis.
Volume Circulation Daily Price
Volume 1
Circulation -0.1917 1
Daily Price -0.19518 0.998949378 1
Regression Analysis
Regression analysis was to build a model that can be used to predict the prices of neo
cryptocurrency. The table below shows the model summary. From the model summary, it is clear
that the regression coefficient is 0.999554043, hence we reject null hypothesis 2. The value of R
square is 0.999108284 meaning that the model explains 99.91082% of the population. Therefore,
the regression model is a perfect model.
SUMMARY OUTPUT
Regression Statistics
Multiple R 0.999554043
R Square 0.999108284
Adjusted R Square 0.996351007
Standard Error 0.910269861
11
Correlation Analysis
Correlation analysis was used investigate whether there is a relationship between the
price and circulation of neo cryptocurrency. The results demonstrate that the correlation
coefficient between circulation and price is 0.9989493. The correlation coefficient is a strong
positive correlation or relationship. The nature of the relationship implies that an increase in the
value of circulation by 1 will cause a corresponding increase in the price of neo cryptocurrency
by 0. 9989493.
Correlation analysis was used to test hypothesis 1. Since the correlation coefficient is not
zero; it implies that there is a relationship hence we reject the null hypothesis.
Volume Circulation Daily Price
Volume 1
Circulation -0.1917 1
Daily Price -0.19518 0.998949378 1
Regression Analysis
Regression analysis was to build a model that can be used to predict the prices of neo
cryptocurrency. The table below shows the model summary. From the model summary, it is clear
that the regression coefficient is 0.999554043, hence we reject null hypothesis 2. The value of R
square is 0.999108284 meaning that the model explains 99.91082% of the population. Therefore,
the regression model is a perfect model.
SUMMARY OUTPUT
Regression Statistics
Multiple R 0.999554043
R Square 0.999108284
Adjusted R Square 0.996351007
Standard Error 0.910269861
NEO CRYPTOCURRENCY
12
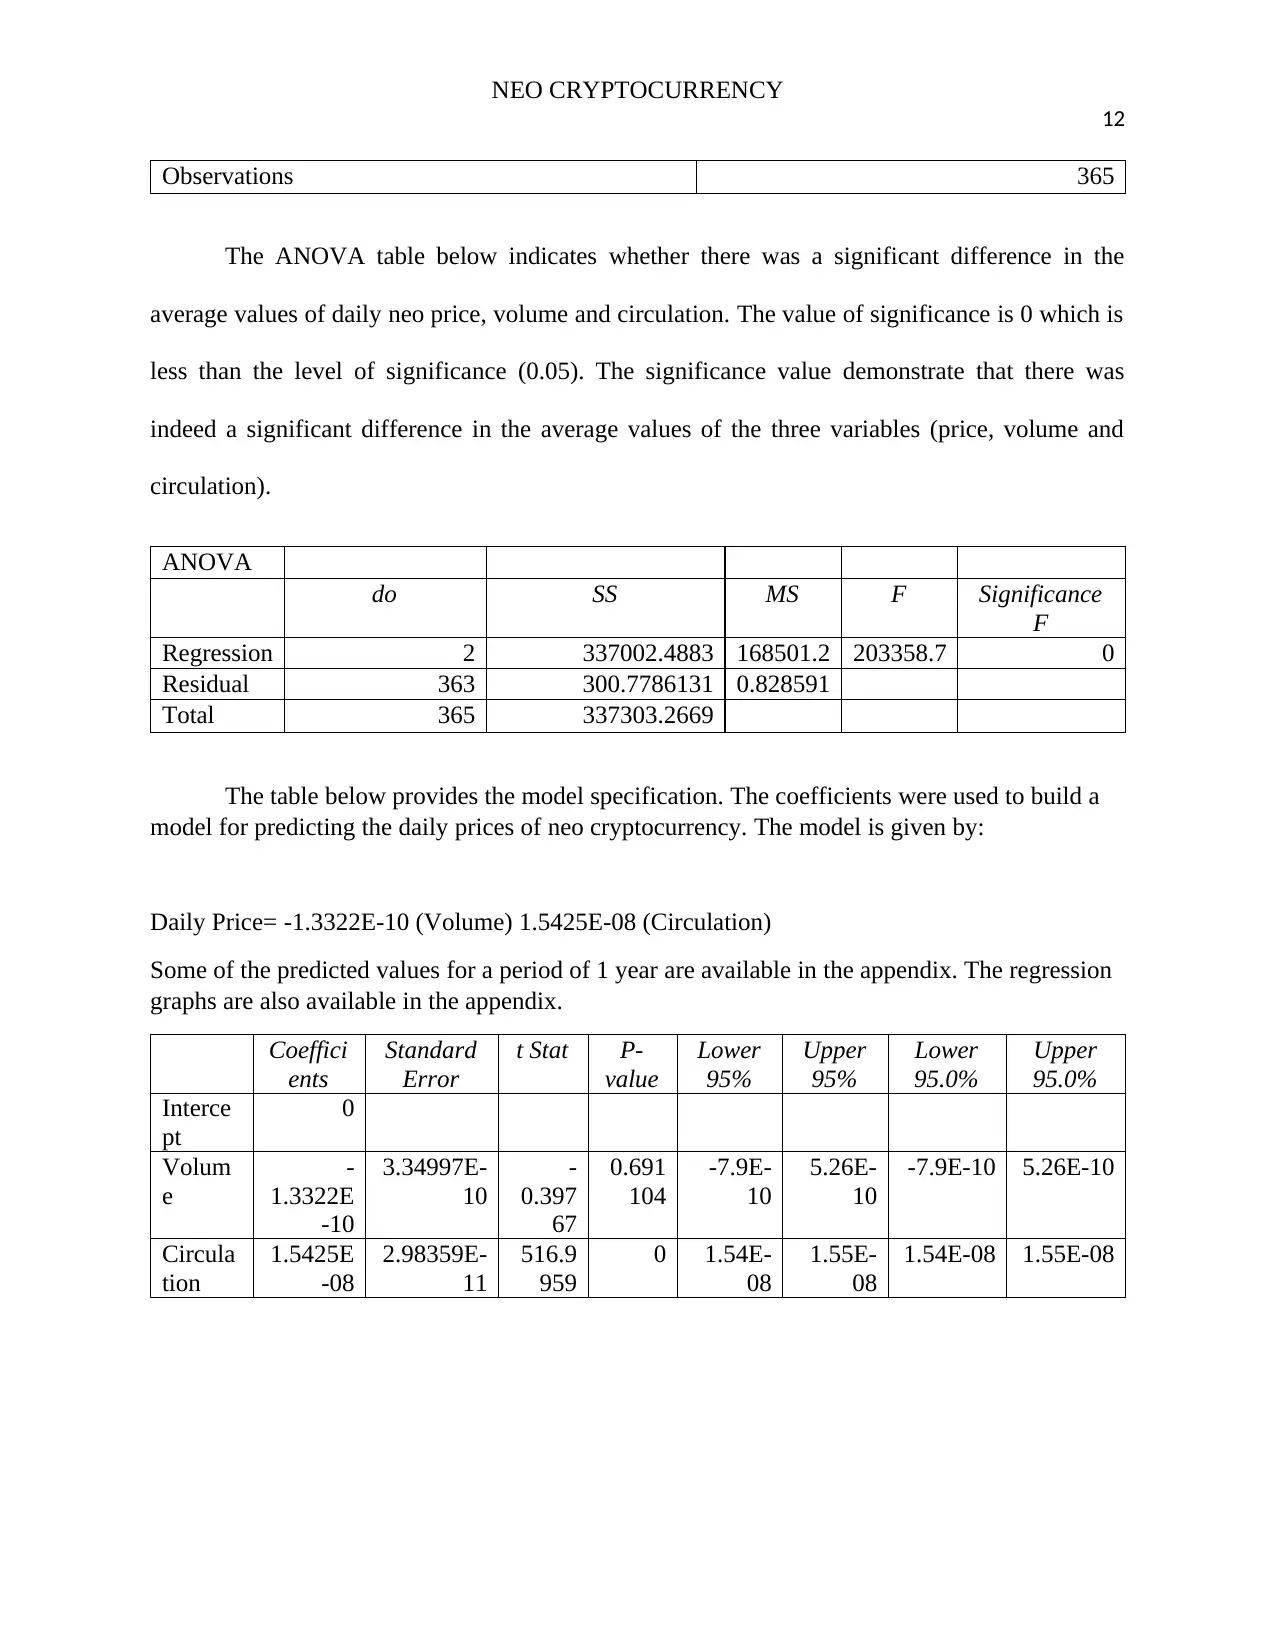
Observations 365
The ANOVA table below indicates whether there was a significant difference in the
average values of daily neo price, volume and circulation. The value of significance is 0 which is
less than the level of significance (0.05). The significance value demonstrate that there was
indeed a significant difference in the average values of the three variables (price, volume and
circulation).
ANOVA
do SS MS F Significance
F
Regression 2 337002.4883 168501.2 203358.7 0
Residual 363 300.7786131 0.828591
Total 365 337303.2669
The table below provides the model specification. The coefficients were used to build a
model for predicting the daily prices of neo cryptocurrency. The model is given by:
Daily Price= -1.3322E-10 (Volume) 1.5425E-08 (Circulation)
Some of the predicted values for a period of 1 year are available in the appendix. The regression
graphs are also available in the appendix.
Coeffici
ents
Standard
Error
t Stat P-
value
Lower
95%
Upper
95%
Lower
95.0%
Upper
95.0%
Interce
pt
0
Volum
e
-
1.3322E
-10
3.34997E-
10
-
0.397
67
0.691
104
-7.9E-
10
5.26E-
10
-7.9E-10 5.26E-10
Circula
tion
1.5425E
-08
2.98359E-
11
516.9
959
0 1.54E-
08
1.55E-
08
1.54E-08 1.55E-08
12
Observations 365
The ANOVA table below indicates whether there was a significant difference in the
average values of daily neo price, volume and circulation. The value of significance is 0 which is
less than the level of significance (0.05). The significance value demonstrate that there was
indeed a significant difference in the average values of the three variables (price, volume and
circulation).
ANOVA
do SS MS F Significance
F
Regression 2 337002.4883 168501.2 203358.7 0
Residual 363 300.7786131 0.828591
Total 365 337303.2669
The table below provides the model specification. The coefficients were used to build a
model for predicting the daily prices of neo cryptocurrency. The model is given by:
Daily Price= -1.3322E-10 (Volume) 1.5425E-08 (Circulation)
Some of the predicted values for a period of 1 year are available in the appendix. The regression
graphs are also available in the appendix.
Coeffici
ents
Standard
Error
t Stat P-
value
Lower
95%
Upper
95%
Lower
95.0%
Upper
95.0%
Interce
pt
0
Volum
e
-
1.3322E
-10
3.34997E-
10
-
0.397
67
0.691
104
-7.9E-
10
5.26E-
10
-7.9E-10 5.26E-10
Circula
tion
1.5425E
-08
2.98359E-
11
516.9
959
0 1.54E-
08
1.55E-
08
1.54E-08 1.55E-08
⊘ This is a preview!⊘
Do you want full access?
Subscribe today to unlock all pages.
Trusted by 1+ million students worldwide
1 out of 25
Related Documents


Your All-in-One AI-Powered Toolkit for Academic Success.
+13062052269
info@desklib.com
Available 24*7 on WhatsApp / Email
![[object Object]](/_next/static/media/star-bottom.7253800d.svg)
Unlock your academic potential
Copyright © 2020–2026 A2Z Services. All Rights Reserved. Developed and managed by ZUCOL.