Neon Inc. E-commerce Data Analysis: Sales, Market, and Strategy Report

Verified

Added on  2021/06/17

|25
|3381
|84
Report
AI Summary
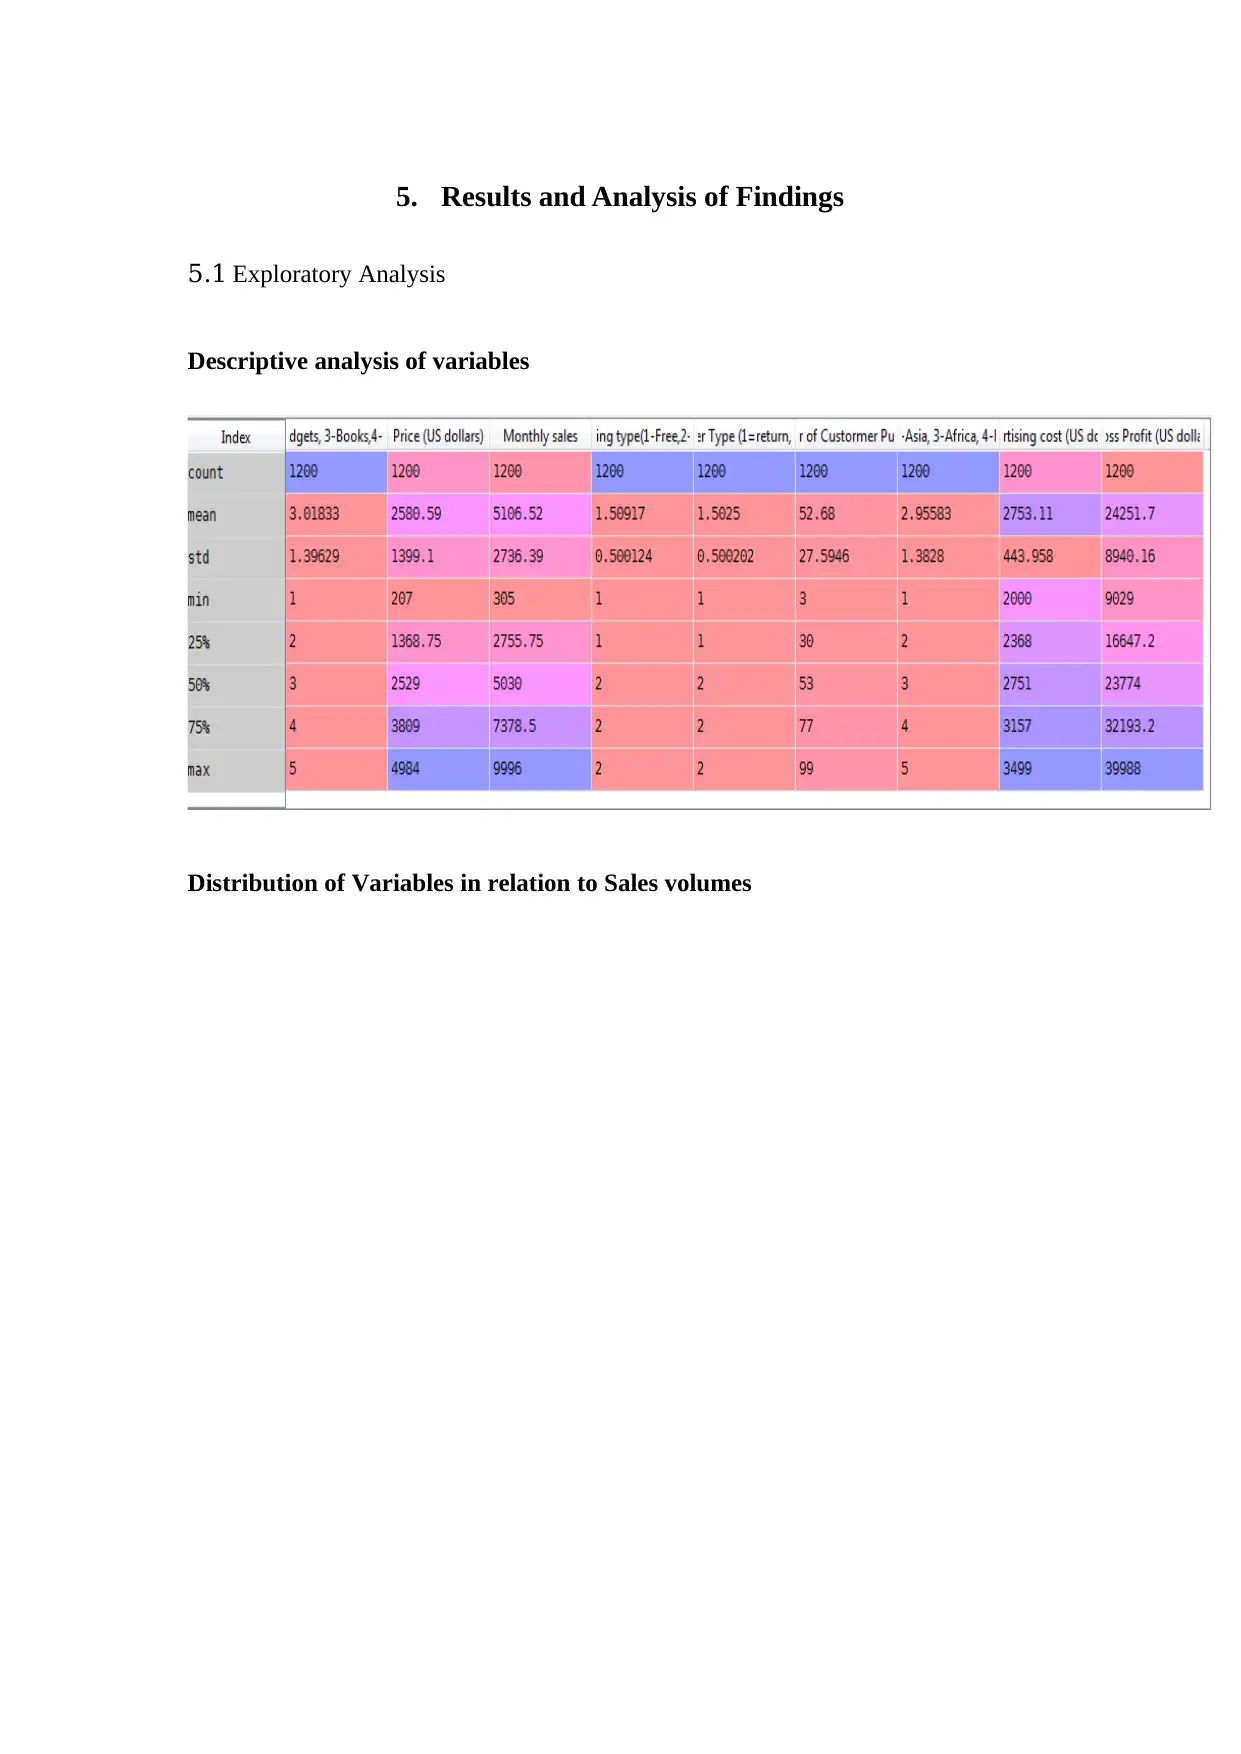
This report provides a comprehensive data analysis of Neon Inc., an e-commerce company, focusing on sales, marketing, and business strategy. The study employs various data science techniques, including exploratory analysis, logistic regression, and multiple regression, to identify relationships between variables such as product sales, geographical region, customer type, and advertising costs. The analysis covers sales data from 2015 to 2018, examining product performance across different markets in Asia, Africa, Europe, and the Americas. Key findings reveal the impact of advertising, customer incentives, and regional sales patterns. The report offers specific recommendations to the executive team, including increasing sales volumes in certain regions, adjusting advertising budgets, and implementing customer loyalty programs like free shipping. The implementation plan outlines actionable steps to achieve the company's goals, with a focus on increasing sales and improving the company's financial performance. The report concludes with a discussion of limitations, such as the relatively short sales record period and the limited number of variables analyzed.
Document Page
1. Executive summary
1.1 Purpose of study
In this paper, we will explore different data science techniques for our E-commerce
company Neon Inc , in order to determine the relationship between various variables
in the company’s business operations so as to suggest new ways to the executive on
coping up with the emerging competition, increasing sales and aggravating the
company image. We will ascertain the classification and analysis methods used in
data mining and data analysis to be used in a business decision-making process. In our
study we will use the “supervised machine learning algorithm” under which we
employ logistic regression for our classification and use regression to develop a
predictive model to suit our analysis objectives. We will also explore the distribution
of our data to general insight on the data and also examine the performance of each
product segment in the different markets.
1.2 General findings
After our analysis we made the following major deductions:
i. Use of new advertising methods may create new product awareness enabling
expansion of our markets
ii. Due to high demand in the regions that we are conducting business, more
exportation to such regions will increase sales volumes
iii. Adoption of customer incentives may foster consumer loyalty to our company
brand and therefore encourage return purchases.
1.3 Research design
For easy exploration, our paper will be divided into:
tabler-icon-diamond-filled.svg

Paraphrase This Document

Need a fresh take? Get an instant paraphrase of this document with our AI Paraphraser
Document Page
i. List of Abbreviations and assumptions made
ii. Introduction
iii. Research Methodology
iv. Analytical Findings
v. Recommendations
vi. Implementation plan
vii. Conclusions
1.4 Limitations of study
There were a number of limitations to our data analysis endeavour, including:
i. Small sales record period of between 2015 and 2018 which may fail to show the
trend of sales development over the years
ii. Using Inc number of variables (10), some of which may not show relationships
and therefore won’t provide useful insights to our questions
iii. We do not have data from competitors, therefore data projection and comparison
for our competitors will be entirely speculative
Document Page
Table Of Contents
2. Abbreviations and assumptions..................................................................................5
2.1 Assumptions.............................................................................................................5
2.2 Abbreviations and key words...................................................................................5
3. Introduction................................................................................................................6
3.1 About Neon Company..............................................................................................6
3.2 Business problem.....................................................................................................6
4. Research Methodology...............................................................................................7
4.1 Data..........................................................................................................................7
4.2 Demography.............................................................................................................7
4.3 Research Instruments...............................................................................................8
5. Results and Analysis of Findings...............................................................................9
5.1 Exploratory Analysis................................................................................................9
6. Assessment Of Results.............................................................................................17
7. Recommendations....................................................................................................19
8. Implementations of recommendations.....................................................................20
9. Conclusion................................................................................................................21
10. Bibliography...........................................................................................................22
11. Appendix................................................................................................................24
Document Page
2. Abbreviations and assumptions
2.1Assumptions
The following assumptions were made for our study:
All products were at least shipped to the five market regions covered by Neon
company
All the sales indicated were correct from the initial entries
Gross profit is generally unaffected by excessive expense revenue and therefore
are indicative of general returns from sales
There were different market needs for different market products in the different
market segments
2.2Abbreviations and key words
Abbreviations
In our study the abbreviations used include: CSR- corporate social responsibility, PLS
-Partial Least Squares, SEM - Structural Equation Modelling, Corporate ability- CA.
Keywords
Meta-data, Logistic Regression, Machine learning, Data mining, Regression,
consumer motivation, regional scaling, Ordinary least squares
tabler-icon-diamond-filled.svg

Paraphrase This Document

Need a fresh take? Get an instant paraphrase of this document with our AI Paraphraser
Document Page
3. Introduction
1.1 Background Information
The business world, like any other autonomous set-up, is competitive and ever-
changing. Most often, the changes may include structural changes, tactical changes,
strategical changes etcetera. Therefore, for a business firm to be able to sustain itself
in the market, it ought to adopt itself in such a way that it is dynamic enough to keep
up with different market needs and flex itself to meet them. In an article on strategic
marketing, Zare et al.(2018) note that there are a number of factors that influence
consumer interests. Further, they argue that “motivations, inhibitors, and co-creation
tools preference vary according to the consumer segment…” The varying consumer
needs breed a number of business problems. Some of which include:
i. What product most likely to be bought and where?
ii. Which is the optimal price to ensure both consumer fairness and optimal profits
for the firm?
iii. What are the factors that promote sales
In order to answer such questions, the executive may opt for drawing inferences
owing past statistics and therefore employ data analysis.
3.1About Neon Company
Neon company is a leading international e-commerce company specialized in the
supply of:
Document Page
i. Electronic gadgets
ii. Toys
iii. Clothes
iv. Books
v. Household Items
Our main marketing regions include: Asia, Africa, Europe, North and South America.
We supply for both wholesaler, retailer, and consumer purposes
3.2Business problem
In the past three years, venture into the e-commerce field of business has been rising
due to its lucrative prospects. Pressure from the shareholders on the executive to
improvise strategies to ensure more profits in order to increase share value and stock
returns, prompting the executive to review its strategies and the emergence of new
competitors has posed a challenge due to a shared market thus affecting our sales
avenues. Thereby requiring new techniques to counter competition and ensure sales
growth.
Hopkins and Swift (2008) argue that “most common strategic problems relate to
threats from new technology, and new competitors…” and that the existing threats
originate mostly from outside the firm. Our strategic problem includes that of : which
of our company product to increase sales volumes and to what region in order to
ensure more sales and profits consequently. Also we need to innovate more ways with
which to engage in business so as to be able to have an upper-hand in the current
competition of the e-commerce space.
With the obtained insights, the company hopes to restructure its strategies and
priorities to accommodate more shipping to sales promising regions.
Document Page
4. Research Methodology
4.1Data
Data used for our analysis was generated for Neon Company for the sales period
beginning on 1/9/2015 to 4/22/2018. It contains 10 variables i.e.: (Name of product,
Monthly sales, price of products, date of sales, customer type geographical region,
gross profit, cost of advertising, number of repeat sales,Shipping type )
4.2 Demography
Variable Size (n) Variable description
Date of Sales 1200 1/9/2015 to 4/22/2018
Price 1200 US dollars
Monthly sales recorded 1200 US dollars
Product name 1200 1-Toys
2-Gadgets,
3-Books
4-Household Items, 5-
Clothes
Shipping type 1200 1-Free shipping
2-Paid shipping
Number of repeat sales 1200 -
Customer type 1200 1=return customer
2=New Customer
Advertising cost 1200 US dollars
tabler-icon-diamond-filled.svg

Paraphrase This Document

Need a fresh take? Get an instant paraphrase of this document with our AI Paraphraser
Document Page
Gross profits 1200 US dollars
Geographical region 1200 1-Europe
2-Asia
3-Africa
4-North America
5-South America
4.3Research Instruments
We used Anaconda python to conduct our data analysis using logistic regression as
our classification technique and multiple regression as a predictive modelling
technique.
For us to be specific in our research aims, we formulated four hypothesis which we
will prove using results of our analysis.
Hypothesis
Null Hypotheses
Ho- There is a relationship between sales region, sales volume and gross profits
Alternative Hypotheses
H1- There is no relationship between sales region, sales volume and gross profits
H2- Different products record different sales
H3- Type of Shipping has an effect on sales made
Document Page
5. Results and Analysis of Findings
5.1 Exploratory Analysis
Descriptive analysis of variables
Distribution of Variables in relation to Sales volumes
Document Page
Scatter-plot for sales and geographical region
Scatter-plot for sales and gross profit
tabler-icon-diamond-filled.svg

Paraphrase This Document

Need a fresh take? Get an instant paraphrase of this document with our AI Paraphraser
Document Page
Scatter-Plot for customer type and Number of Customer Purchases
Document Page
Scatter-Plot for Shipping type and Number of purchases
Relationship between Monthly sales and Gross profit
Relationship between monthly sales and type of products
chevron_up_icon
1 out of 25
circle_padding
hide_on_mobile
zoom_out_icon
[object Object]