Infectious Disease Modeling: Nc Infection in Dairy Cattle
VerifiedAdded on 2022/09/08
|15
|2338
|26
Project
AI Summary
This project presents a mathematical model of Neospora caninum (Nc) infection in dairy cattle, inspired by French et al.'s research. The model explores various transmission routes, including vertical, horizontal, and external sources, with parameters derived from existing studies. The study uses differential equations and R code to simulate the dynamics of infection within a cow population, considering birth and death rates, and infection rates. The results indicate that external transmission has the most significant impact on the prevalence of Nc infection compared to horizontal transmission. The analysis also highlights the roles of birth rates and vertical transmission in shaping the epidemic model. The project concludes that controlling external infection is crucial for managing the disease, and the birth of non-infected calves from infected cows contributes to long-term infection saturation.
Running head: INFECTIOUS DISEASE MODELLING
Infectious Disease Modelling
Name of the Student
Name of the University
Author note
Infectious Disease Modelling
Name of the Student
Name of the University
Author note
Paraphrase This Document
Need a fresh take? Get an instant paraphrase of this document with our AI Paraphraser
1INFECTIOUS DISEASE MODELLING
1.
Let,
Susceptible=S
Infected=I
Total population of cow=N
Birth Rate=B
Death Rate=D
Infection rate coefficient=β
As per the Standard SI model
Susceptible rate (dS/dt)=BN-( βSI/N)-DS
Infection rate (dI/dt)=( βSI/N)-DI
In this case the Birth Rate in Susceptible and Infection is different
Let,
Birth Rate in Susceptible= B1
Birth Rate in Infected=B2
If the rate of external transmission is T
Then, the transmission within same generation through vertical transmission is (βSI/N)-
DI+TS
Vertical Transmission probability in infected population is P1
Hence Vertical Transmission probability in susceptible population is 1-P1
Susceptible rate (dS/dt)=(B1-D1)S+B2(1-P1)I-(βSI/N)-TS
2INFECTIOUS DISEASE MODELLING
Infected Rate (dI/dt)=B2P1I-D2S+(βSI/N)+TS
From the above model it can be found that that the birth rate of both susceptible and infected
population has strong impact on the total number of susceptible and infected population of
next year. The equation clearly shows that the external infection can influence the infection
and susceptible cow population in in two ways considering the coefficient β and the
transmission rate T. In this model the birth-rate has been divided into two categories namely
Birth Rate in Infected and Birth Rate in Susceptible. It can be seen that the force of infection
required to maintain a given equilibrium prevalence is higher if the parasite is more virulent
(i.e. has a greater negative impact on reducing fertility and/or increasing mortality).
2.
Hence, in new model
Susceptible rate (dS/dt)=(B1-D1)S+B2(1-P1)I-(βSI/N)-TS
Infected Rate (dI/dt)=B2P1I-D2I+(βSI/N)+TS
Birth Rate in Susceptible cows= B1=30%=0.3
Birth Rate in Infected cows =B2=20%=0.2
Death Rate in Susceptible cows= D1=D2/1.6
Death Rate in Infected cows =D2=0.3
Rate of external transmission is T=0 or unknown
Infection rate coefficient=β=0.025
Vertical Transmission probability in infected population is P1=90to95%=0.925
Hence Vertical Transmission probability in susceptible population is 1-P1=(1-0.925)=0.075
⊘ This is a preview!⊘
Do you want full access?
Subscribe today to unlock all pages.
Trusted by 1+ million students worldwide
3INFECTIOUS DISEASE MODELLING
Hence, the updated model with numeric
Susceptible rate (dS/dt)=(0.3-D1)S+0.2(1-0.925)I-(0.025SI/N)
Infected Rate (dI/dt)=(0.2x0.925xI)-(D2*I)+(0.025SI/N)
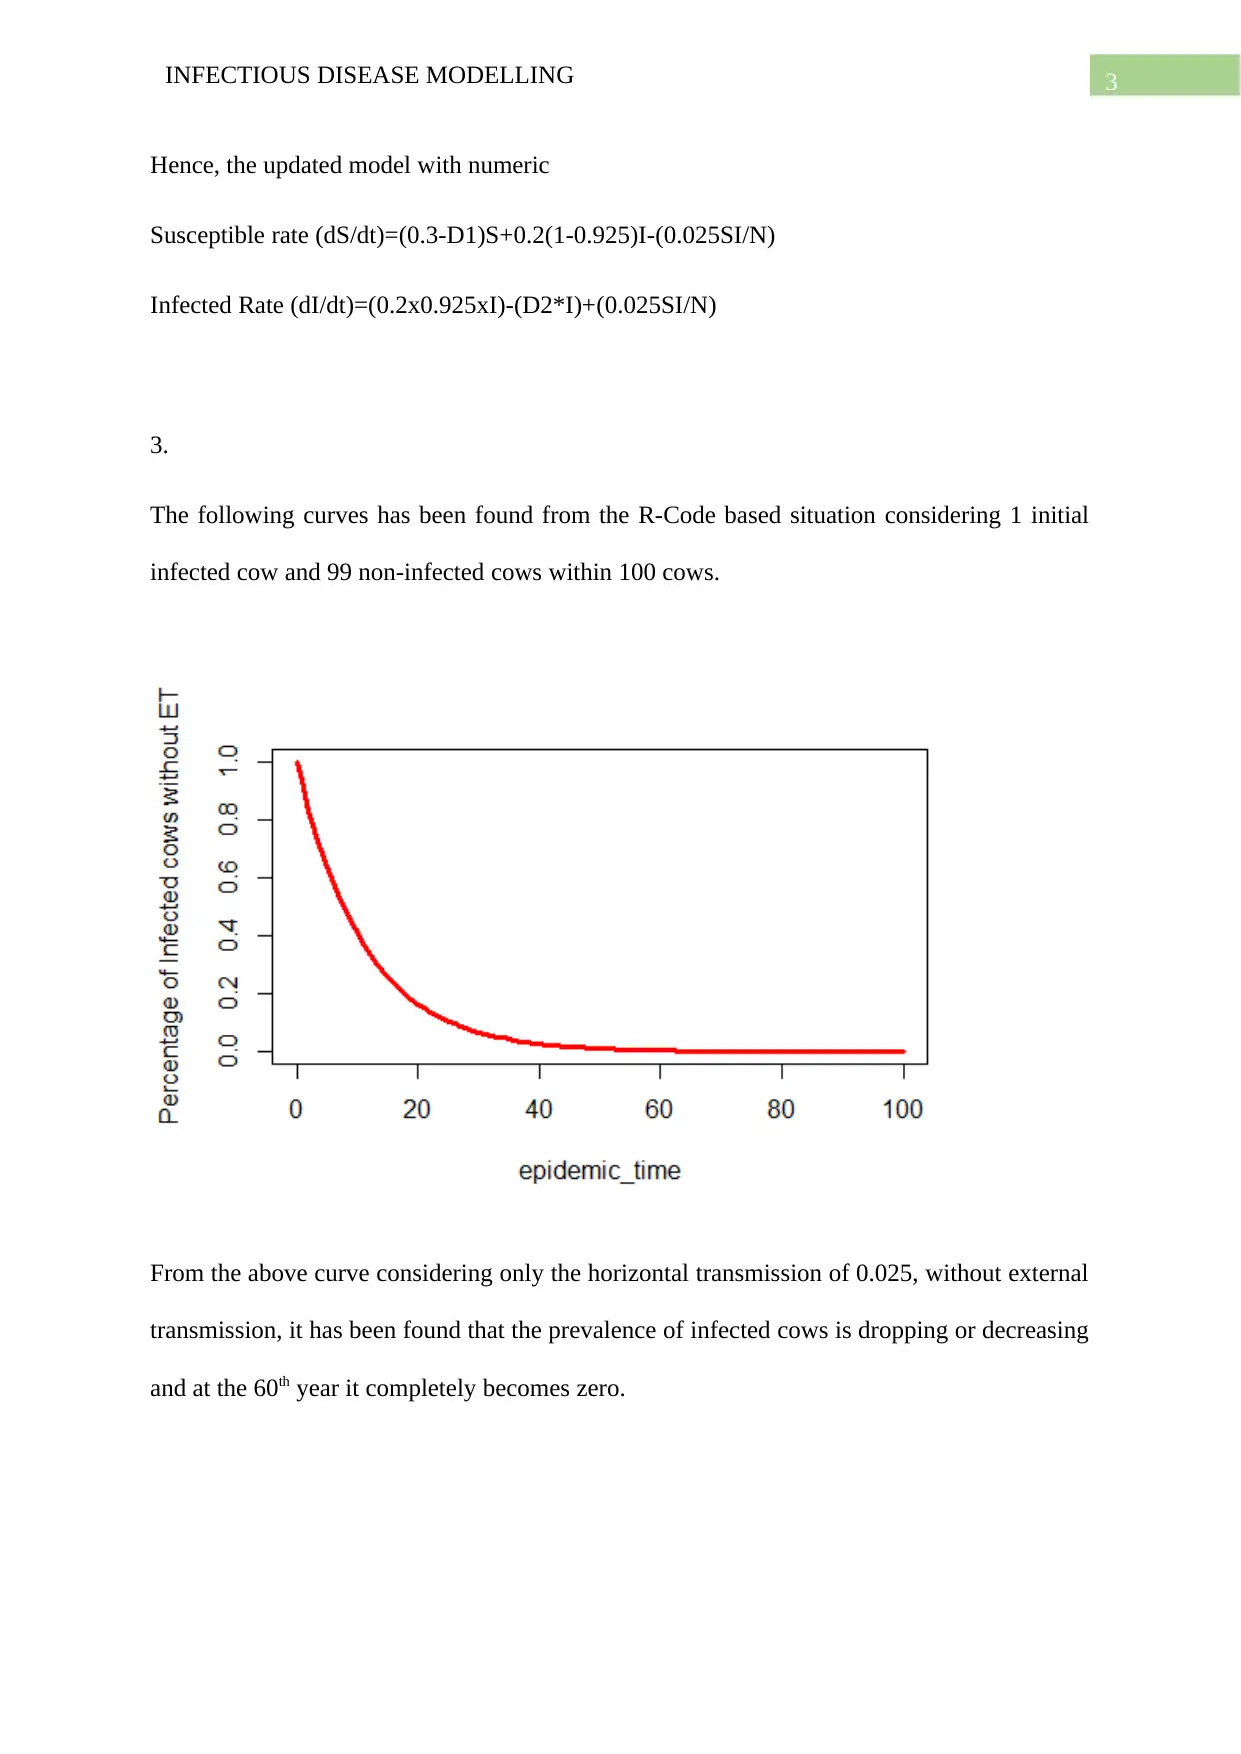
3.
The following curves has been found from the R-Code based situation considering 1 initial
infected cow and 99 non-infected cows within 100 cows.
From the above curve considering only the horizontal transmission of 0.025, without external
transmission, it has been found that the prevalence of infected cows is dropping or decreasing
and at the 60th year it completely becomes zero.
Hence, the updated model with numeric
Susceptible rate (dS/dt)=(0.3-D1)S+0.2(1-0.925)I-(0.025SI/N)
Infected Rate (dI/dt)=(0.2x0.925xI)-(D2*I)+(0.025SI/N)
3.
The following curves has been found from the R-Code based situation considering 1 initial
infected cow and 99 non-infected cows within 100 cows.
From the above curve considering only the horizontal transmission of 0.025, without external
transmission, it has been found that the prevalence of infected cows is dropping or decreasing
and at the 60th year it completely becomes zero.
Paraphrase This Document
Need a fresh take? Get an instant paraphrase of this document with our AI Paraphraser
4INFECTIOUS DISEASE MODELLING
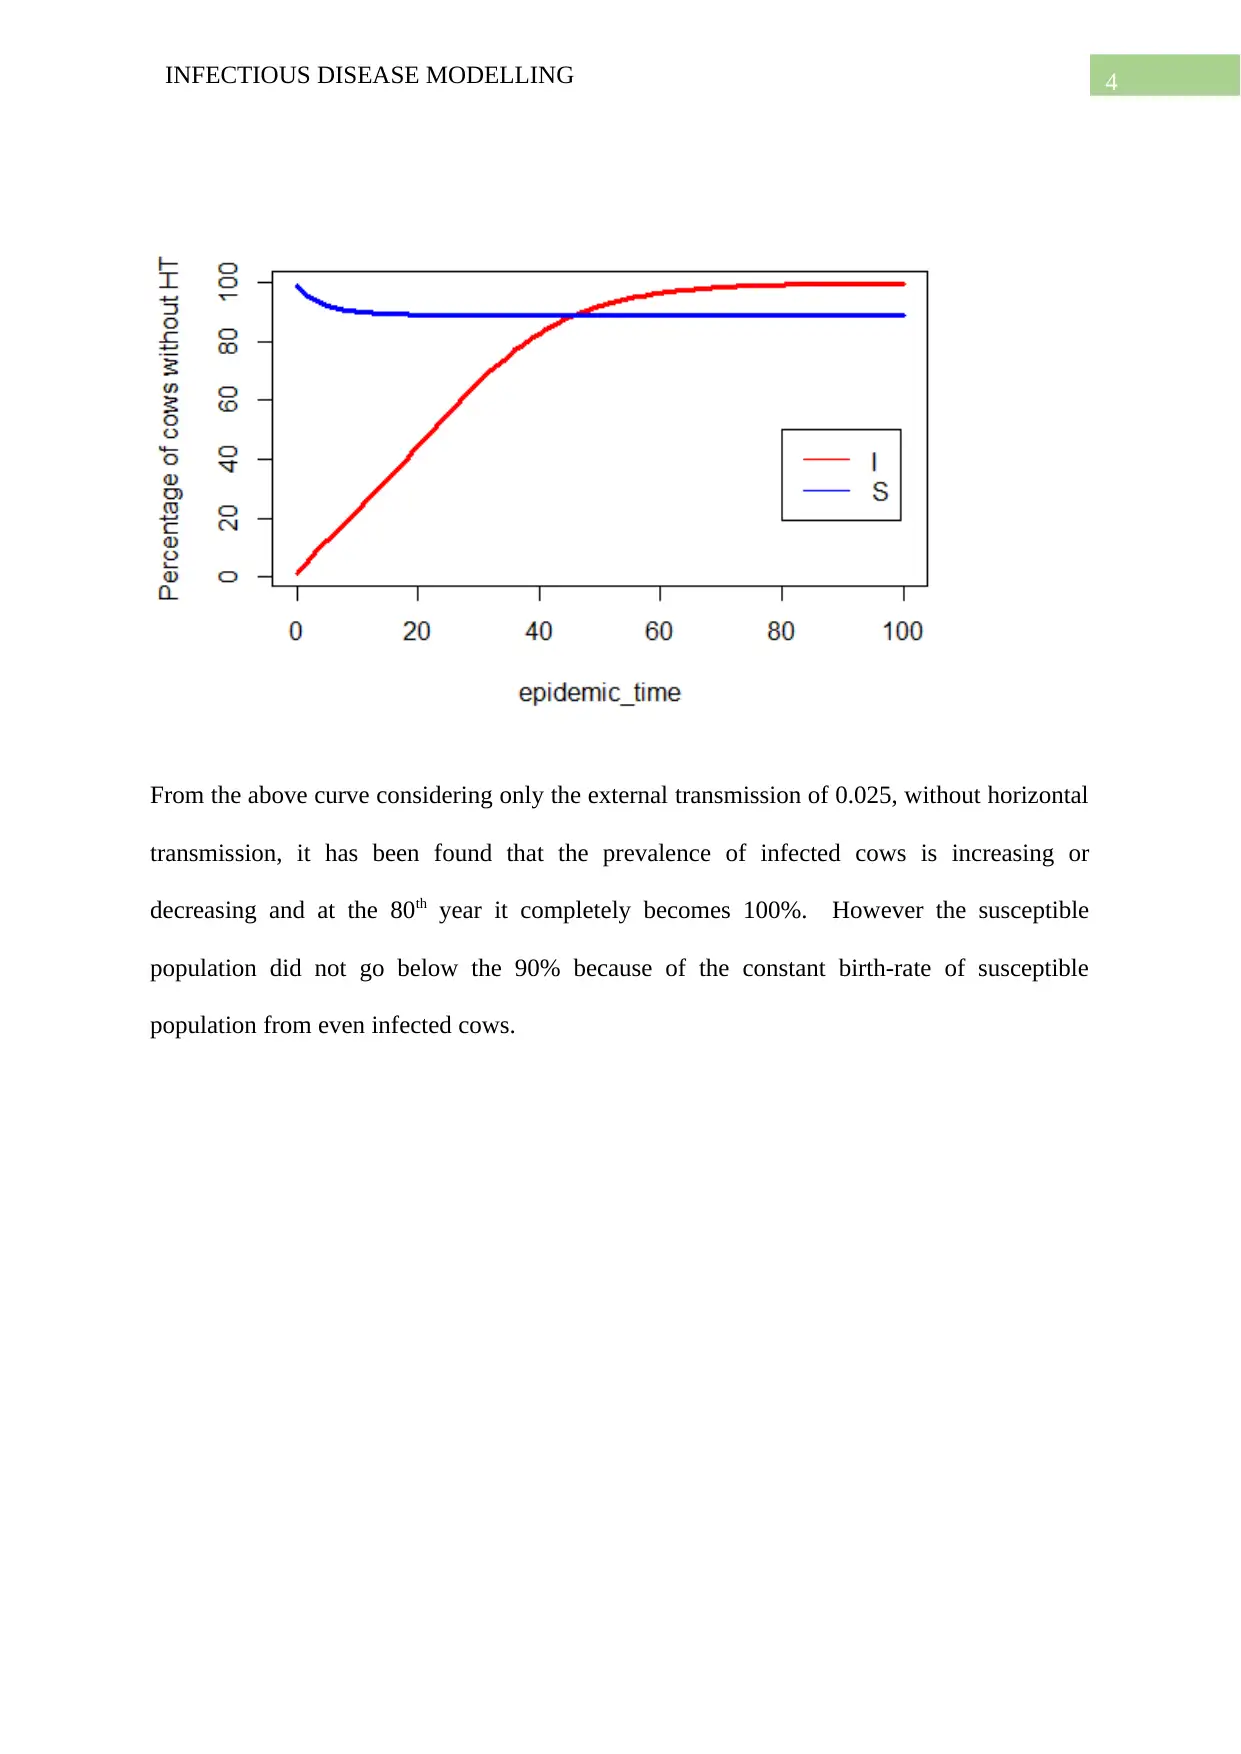
From the above curve considering only the external transmission of 0.025, without horizontal
transmission, it has been found that the prevalence of infected cows is increasing or
decreasing and at the 80th year it completely becomes 100%. However the susceptible
population did not go below the 90% because of the constant birth-rate of susceptible
population from even infected cows.
5INFECTIOUS DISEASE MODELLING
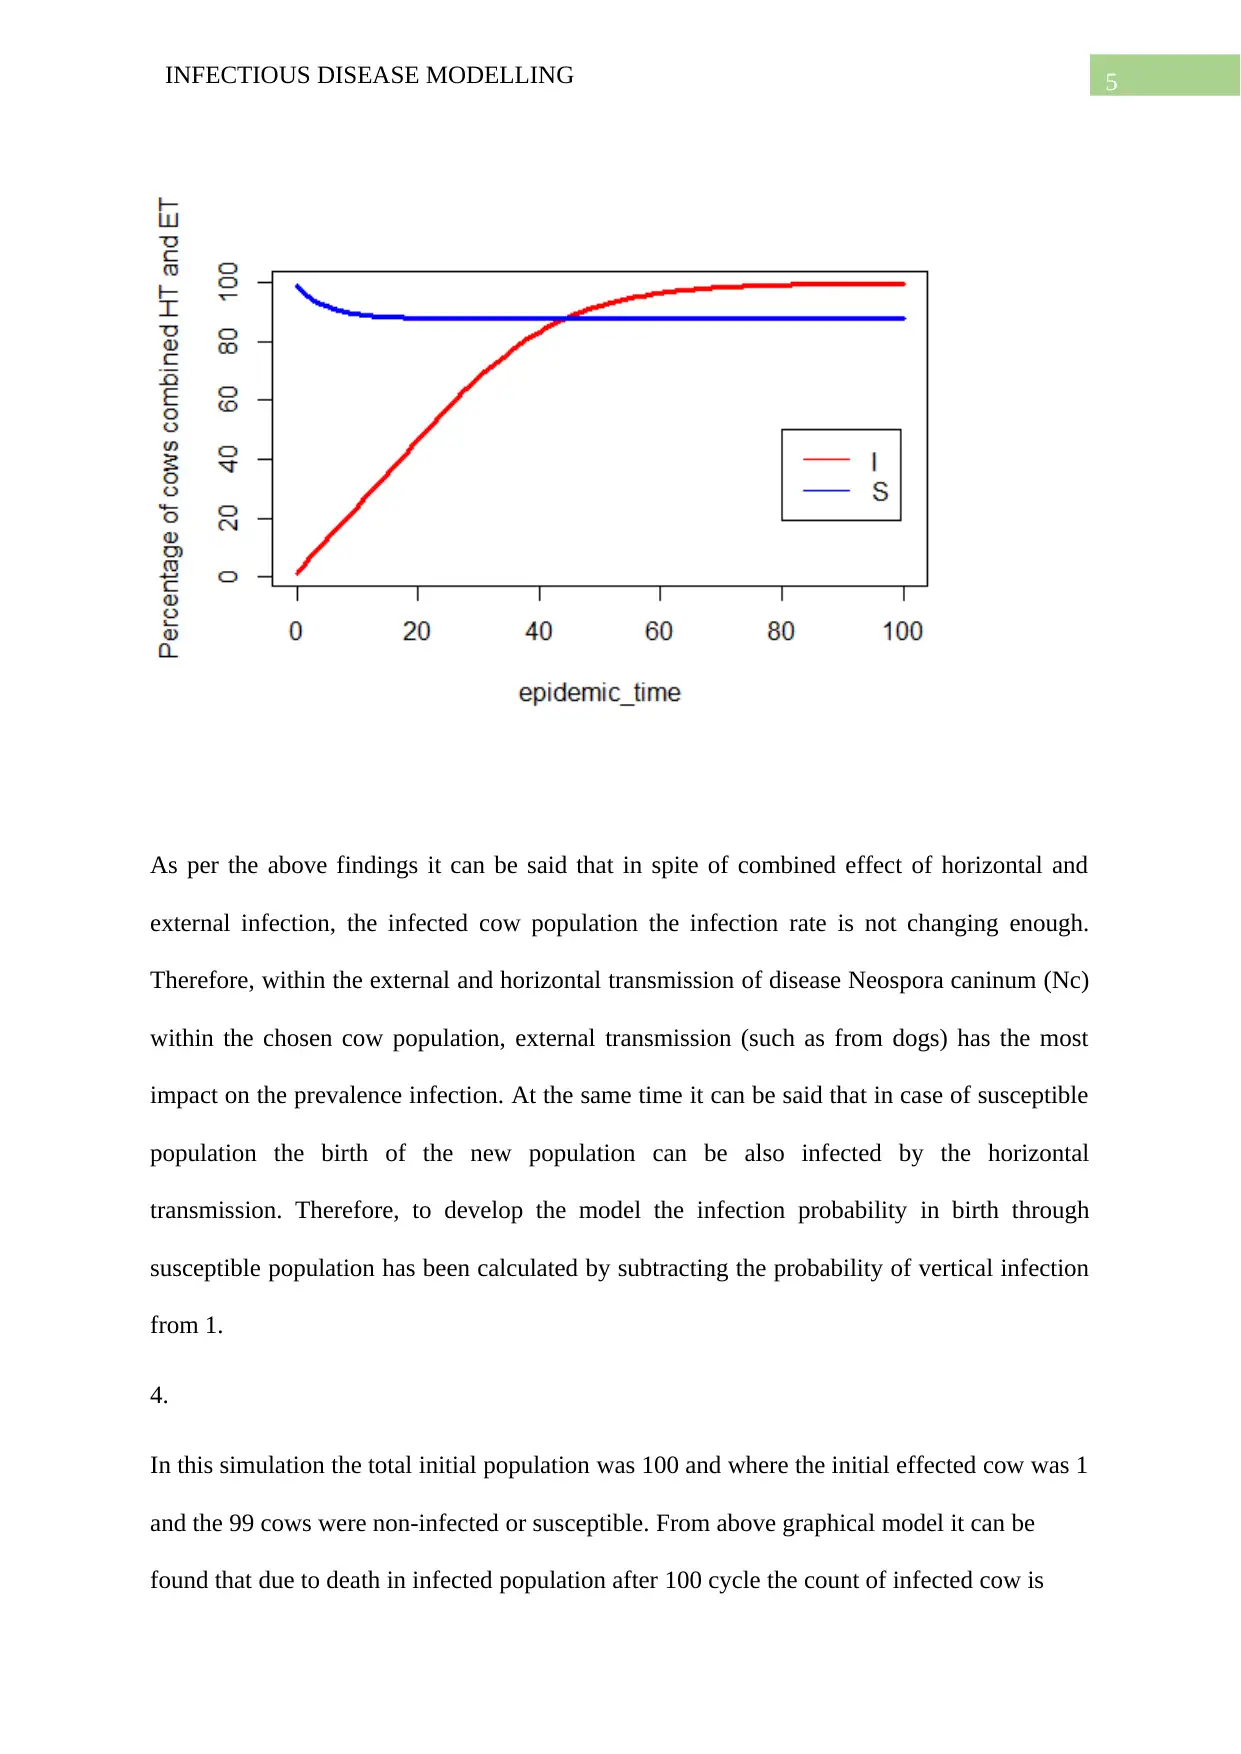
As per the above findings it can be said that in spite of combined effect of horizontal and
external infection, the infected cow population the infection rate is not changing enough.
Therefore, within the external and horizontal transmission of disease Neospora caninum (Nc)
within the chosen cow population, external transmission (such as from dogs) has the most
impact on the prevalence infection. At the same time it can be said that in case of susceptible
population the birth of the new population can be also infected by the horizontal
transmission. Therefore, to develop the model the infection probability in birth through
susceptible population has been calculated by subtracting the probability of vertical infection
from 1.
4.
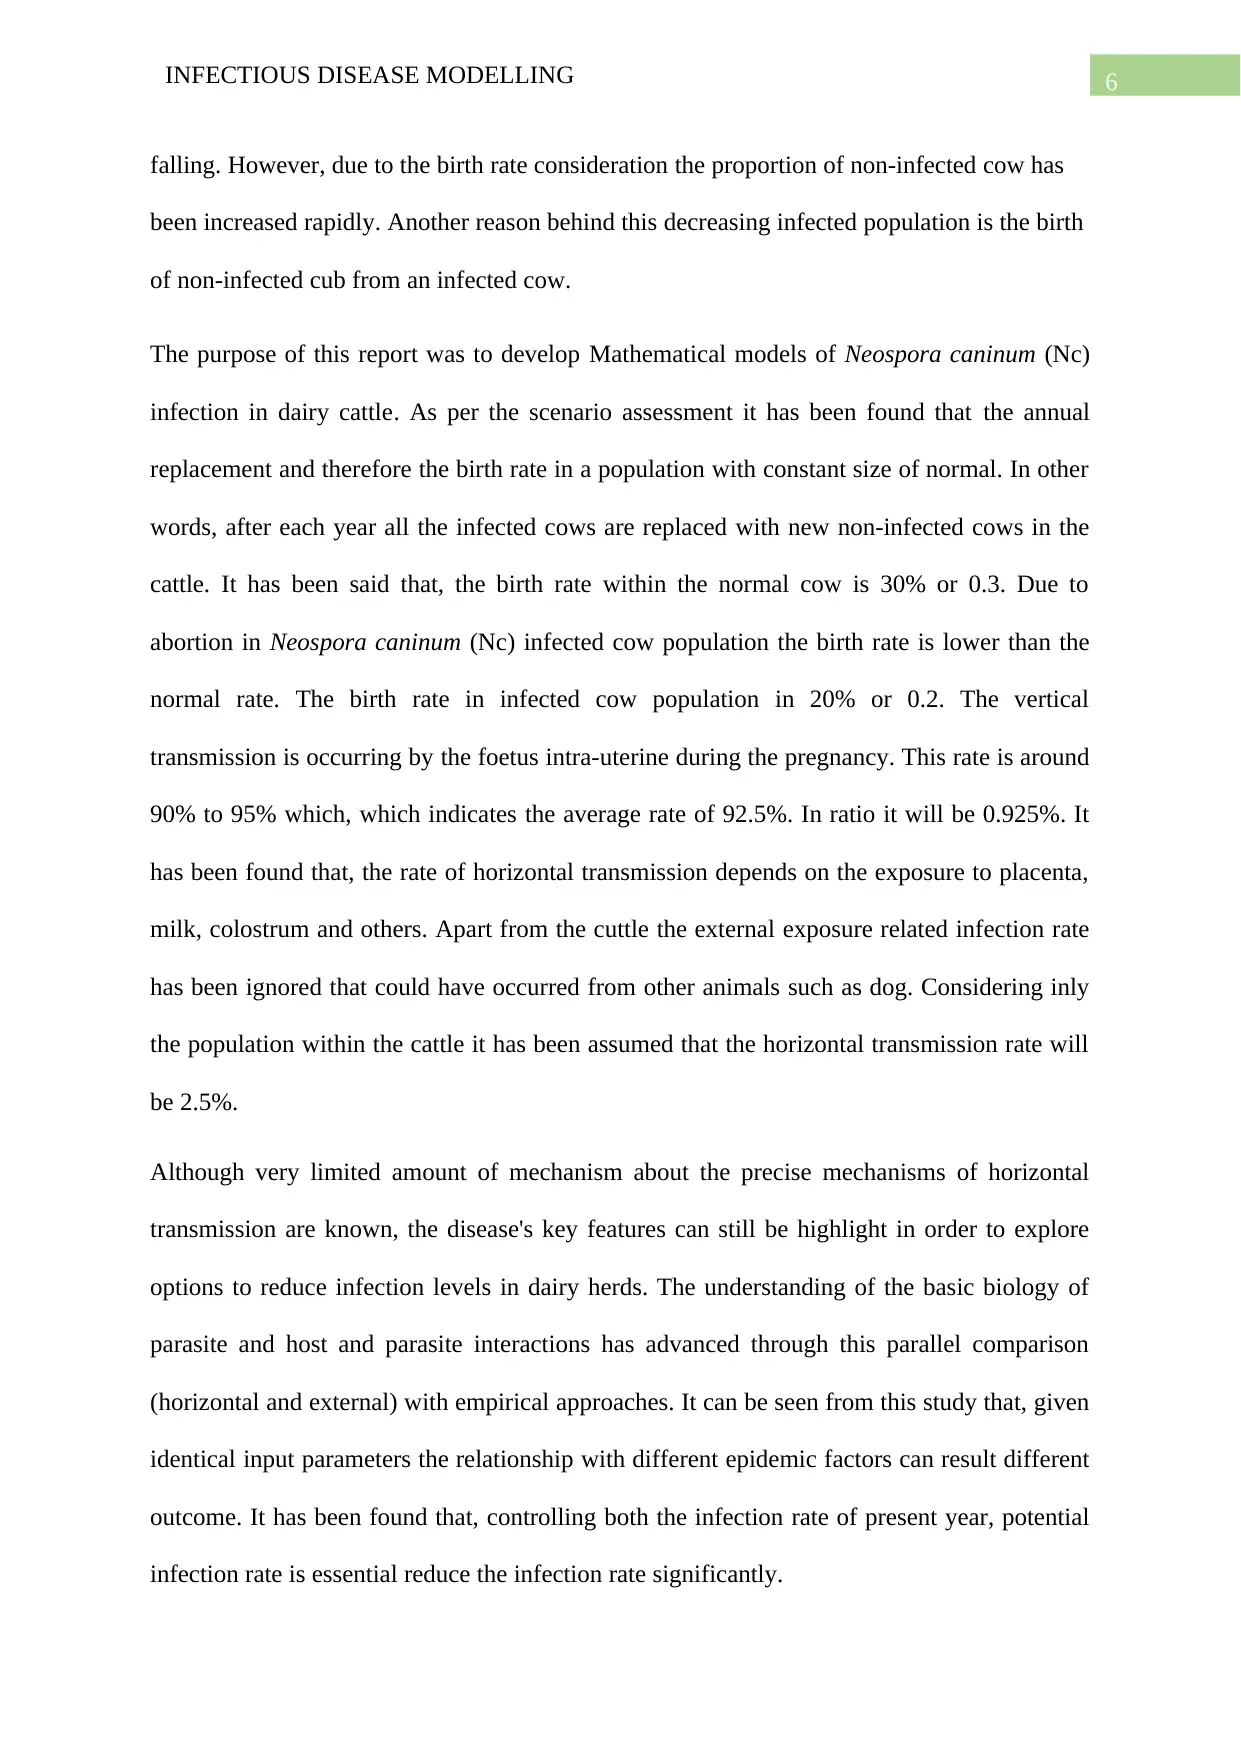
In this simulation the total initial population was 100 and where the initial effected cow was 1
and the 99 cows were non-infected or susceptible. From above graphical model it can be
found that due to death in infected population after 100 cycle the count of infected cow is
As per the above findings it can be said that in spite of combined effect of horizontal and
external infection, the infected cow population the infection rate is not changing enough.
Therefore, within the external and horizontal transmission of disease Neospora caninum (Nc)
within the chosen cow population, external transmission (such as from dogs) has the most
impact on the prevalence infection. At the same time it can be said that in case of susceptible
population the birth of the new population can be also infected by the horizontal
transmission. Therefore, to develop the model the infection probability in birth through
susceptible population has been calculated by subtracting the probability of vertical infection
from 1.
4.
In this simulation the total initial population was 100 and where the initial effected cow was 1
and the 99 cows were non-infected or susceptible. From above graphical model it can be
found that due to death in infected population after 100 cycle the count of infected cow is
⊘ This is a preview!⊘
Do you want full access?
Subscribe today to unlock all pages.
Trusted by 1+ million students worldwide
6INFECTIOUS DISEASE MODELLING
falling. However, due to the birth rate consideration the proportion of non-infected cow has
been increased rapidly. Another reason behind this decreasing infected population is the birth
of non-infected cub from an infected cow.
The purpose of this report was to develop Mathematical models of Neospora caninum (Nc)
infection in dairy cattle. As per the scenario assessment it has been found that the annual
replacement and therefore the birth rate in a population with constant size of normal. In other
words, after each year all the infected cows are replaced with new non-infected cows in the
cattle. It has been said that, the birth rate within the normal cow is 30% or 0.3. Due to
abortion in Neospora caninum (Nc) infected cow population the birth rate is lower than the
normal rate. The birth rate in infected cow population in 20% or 0.2. The vertical
transmission is occurring by the foetus intra-uterine during the pregnancy. This rate is around
90% to 95% which, which indicates the average rate of 92.5%. In ratio it will be 0.925%. It
has been found that, the rate of horizontal transmission depends on the exposure to placenta,
milk, colostrum and others. Apart from the cuttle the external exposure related infection rate
has been ignored that could have occurred from other animals such as dog. Considering inly
the population within the cattle it has been assumed that the horizontal transmission rate will
be 2.5%.
Although very limited amount of mechanism about the precise mechanisms of horizontal
transmission are known, the disease's key features can still be highlight in order to explore
options to reduce infection levels in dairy herds. The understanding of the basic biology of
parasite and host and parasite interactions has advanced through this parallel comparison
(horizontal and external) with empirical approaches. It can be seen from this study that, given
identical input parameters the relationship with different epidemic factors can result different
outcome. It has been found that, controlling both the infection rate of present year, potential
infection rate is essential reduce the infection rate significantly.
Paraphrase This Document
Need a fresh take? Get an instant paraphrase of this document with our AI Paraphraser
7INFECTIOUS DISEASE MODELLING
Conclusion:
From the findings of the disease’s epidemic model it can be concluded that in spite of
combined effect of horizontal, vertical and external infection, the horizontal transmission has
negligible impact of the epidemic model. On the other hand, infection rate Neospora
caninum (Nc) mostly depends on the external transmission. Apart from that, due to birth of
non-infected calf from infected cow and infected calf from non-infected cow the level of
infection over long period meets the saturation as per inversely relationship between infected
and non-infected population.
Annex
Number of population plot
Code for without External Transmission
##disease parameters
N<-100
8INFECTIOUS DISEASE MODELLING
beta<-0.025
T<-0.0
#Birth Rate
BS<-0.3
BI<-0.2
#probability birth of infected baby for vertical infection
PI<-0.925
PS<-1-PI
#death rate
DI<-0.3
DS<-DI/1.6
SEIR.par<- c(beta,DS,DI,BS,BI,beta,N,PI,PS)
##initial counts
S_init<-99
I_init<-1
SEIR.init <- c(S_init,I_init)
## define timescale
SEIR.t <- seq(0,100,by=1)
# Define function to describe differential equation for SEIR model
SEIR.dyn <- function(t,var,par)
⊘ This is a preview!⊘
Do you want full access?
Subscribe today to unlock all pages.
Trusted by 1+ million students worldwide
9INFECTIOUS DISEASE MODELLING
{
S <- var[1]
I <- var[2]
N<-S+I
beta<- par[1]
# Differential equation
dI <- (BI*PI*I)+(beta*S*I/N)-(DI*I)+(T*S)
dS <- (BS*S)+(BI*PS*I)-(beta*S*I/N)-(DS*S)-(T*S)
list(c(dS,dI))
}
# Create an object that saves results
library(deSolve)
SEIR.sol <- lsoda(SEIR.init,SEIR.t,SEIR.dyn,SEIR.par)
epidemic_time <- SEIR.sol[,1]
S <- SEIR.sol[,2]
I <- SEIR.sol[,3]
S<-S/(S+I)*100
I<-I/(S+I)*100
#Visualising Results
plot(epidemic_time,I,type="l",lwd=3,col="red",ylab="Percentage of Infected cows without
ET")
Paraphrase This Document
Need a fresh take? Get an instant paraphrase of this document with our AI Paraphraser
10INFECTIOUS DISEASE MODELLING
lines(epidemic_time,S,type="l",lwd=3,col="blue")
legend(80,50,legend=c("I","S"),col=c("red","blue"),lty=1)
Code for without Horizontal Transmission
##disease parameters
N<-100
beta<-0.0
T<-0.025
#Birth Rate
BS<-0.3
BI<-0.2
#probability birth of infected baby for vertical infection
PI<-0.925
PS<-1-PI
#death rate
DI<-0.3
DS<-DI/1.6
SEIR.par<- c(beta,DS,DI,BS,BI,beta,N,PI,PS)
##initial counts
S_init<-99
11INFECTIOUS DISEASE MODELLING
I_init<-1
SEIR.init <- c(S_init,I_init)
## define timescale
SEIR.t <- seq(0,100,by=1)
# Define function to describe differential equation for SEIR model
SEIR.dyn <- function(t,var,par)
{
S <- var[1]
I <- var[2]
N<-S+I
beta<- par[1]
# Differential equation
dI <- (BI*PI*I)+(beta*S*I/N)-(DI*I)+(T*S)
dS <- (BS*S)+(BI*PS*I)-(beta*S*I/N)-(DS*S)-(T*S)
list(c(dS,dI))
}
# Create an object that saves results
library(deSolve)
SEIR.sol <- lsoda(SEIR.init,SEIR.t,SEIR.dyn,SEIR.par)
epidemic_time <- SEIR.sol[,1]
S <- SEIR.sol[,2]
⊘ This is a preview!⊘
Do you want full access?
Subscribe today to unlock all pages.
Trusted by 1+ million students worldwide
1 out of 15

Your All-in-One AI-Powered Toolkit for Academic Success.
+13062052269
info@desklib.com
Available 24*7 on WhatsApp / Email
![[object Object]](/_next/static/media/star-bottom.7253800d.svg)
Unlock your academic potential
Copyright © 2020–2026 A2Z Services. All Rights Reserved. Developed and managed by ZUCOL.